| Param | Original file | Final file |
|---|---|---|
| Filename | modeM0/AS1A07_007T02_9000003244_21942cztM0_level2.evt | modeM0/AS1A07_007T02_9000003244_21942cztM0_level2_quad_clean.evt |
| Size (bytes) | 488,594,880 | 103,688,640 |
| Size | 466.0 MB | 98.9 MB |
| Events in quadrant A | 3,496,179 | 688,713 |
| Events in quadrant B | 3,652,504 | 694,663 |
| Events in quadrant C | 3,495,517 | 664,050 |
| Events in quadrant D | 3,721,999 | 649,756 |
| Mode M0 | |||
|---|---|---|---|
| Quadrant | BADHDUFLAG | Total packets | Discarded packets |
| A | 0 | 14569 | 1 |
| B | 0 | 14922 | 1 |
| C | 0 | 14454 | 1 |
| D | 0 | 15318 | 1 |
| Mode M9 | |||
|---|---|---|---|
| Quadrant | BADHDUFLAG | Total packets | Discarded packets |
| A | 0 | 13 | 0 |
| B | 0 | 13 | 0 |
| C | 0 | 13 | 0 |
| D | 0 | 13 | 0 |
| Mode SS | |||
|---|---|---|---|
| Quadrant | BADHDUFLAG | Total packets | Discarded packets |
| A | 0 | 128 | 0 |
| B | 0 | 128 | 0 |
| C | 0 | 128 | 0 |
| D | 0 | 128 | 0 |
| Quadrant | Total seconds | Saturated seconds | Saturation percentage |
|---|---|---|---|
| A | 6355 | 82 | 1.290323% |
| B | 6354 | 141 | 2.219075% |
| C | 6355 | 129 | 2.029898% |
| D | 6355 | 115 | 1.809599% |
Noise dominated data is calculated using 1-second bins in cleaned event files. If a bin has >2000 counts, and if more than 50% of those come from <1% of pixels, then it is considered to be noise-dominated and hence unusable.
| Quadrant | # 1 sec bins | Bins with >0 counts | Bins with >2000 counts | High rate bins dominated by noise | Noise dominated (total time) | Noise dominated (detector-on time) | Marked lightcurve |
|---|---|---|---|---|---|---|---|
| A | 7625 | 6355 | 0 | 0 | 0.00% | 0.00% | 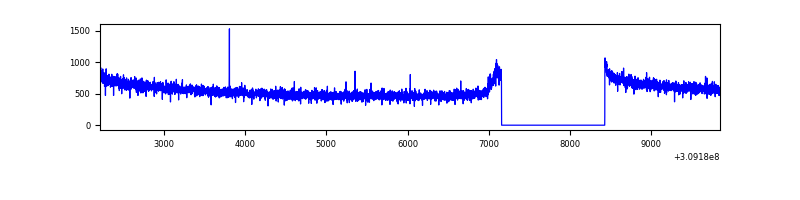 |
| B | 7624 | 6354 | 28 | 28 | 0.37% | 0.44% | 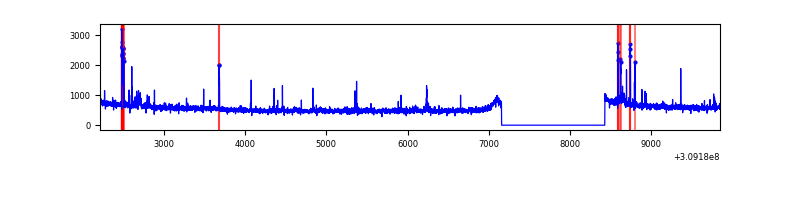 |
| C | 7625 | 6355 | 0 | 0 | 0.00% | 0.00% | 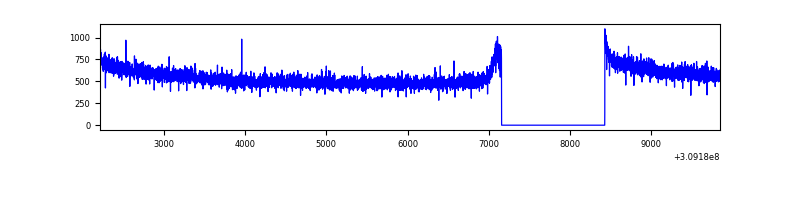 |
| D | 7625 | 6355 | 45 | 45 | 0.59% | 0.71% | 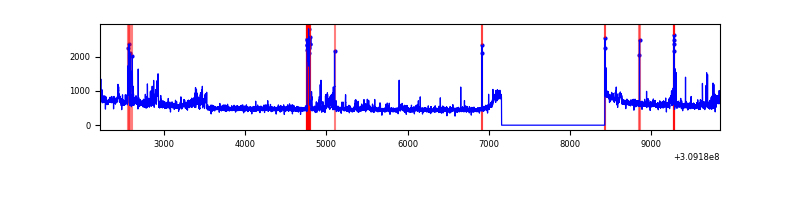 |
Top three noisy pixels from each quadrant. If the there are fewer than three noisy pixels in the level2.evt file, extra rows are filled as -1
| Pixel properties | Quadrant properties | ||||||
|---|---|---|---|---|---|---|---|
| Quadrant | DetID | PixID | Counts | Sigma | Mean | Median | Sigma |
| A | 4 | 2 | 10704 | 55.26 | 904 | 889 | 177.6 |
| A | 13 | 254 | 9018 | 45.77 | 904 | 889 | 177.6 |
| A | 0 | 226 | 7949 | 39.75 | 904 | 889 | 177.6 |
| B | 3 | 64 | 116173 | 704.44 | 882 | 862 | 163.7 |
| B | 0 | 230 | 44215 | 264.85 | 882 | 862 | 163.7 |
| B | 0 | 229 | 24990 | 147.4 | 882 | 862 | 163.7 |
| C | 14 | 238 | 137157 | 688.56 | 861 | 868 | 197.9 |
| C | 13 | 61 | 5776 | 24.8 | 861 | 868 | 197.9 |
| C | 3 | 202 | 2066 | 6.05 | 861 | 868 | 197.9 |
| D | 1 | 52 | 151706 | 723.55 | 877 | 855 | 208.5 |
| D | 11 | 176 | 86605 | 411.29 | 877 | 855 | 208.5 |
| D | 12 | 235 | 74871 | 355.01 | 877 | 855 | 208.5 |
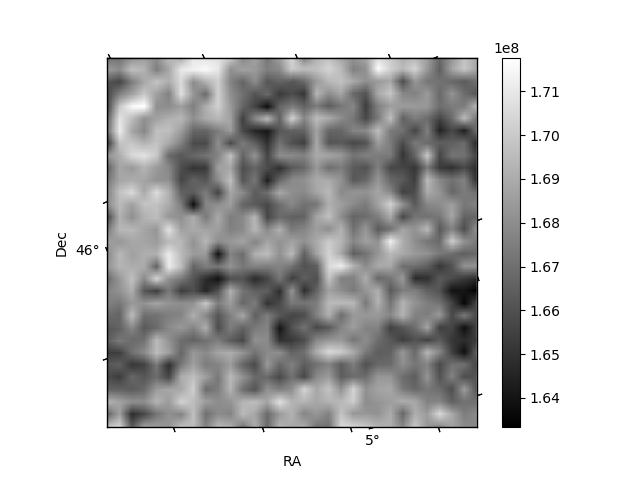
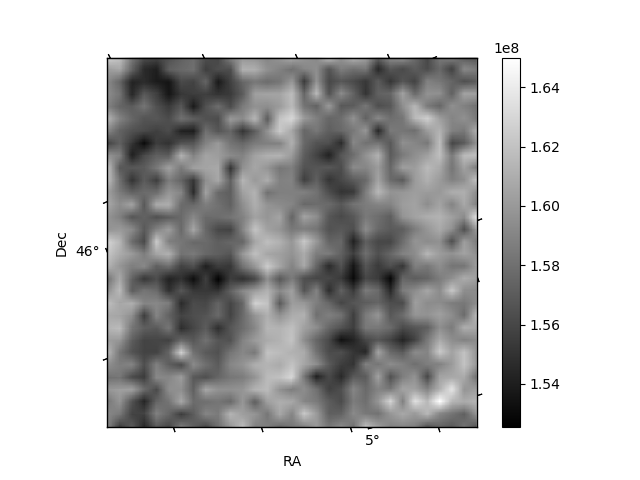
Histogram calculated using DETX and DETY for each event in the final _common_clean file
| Quadrant A | 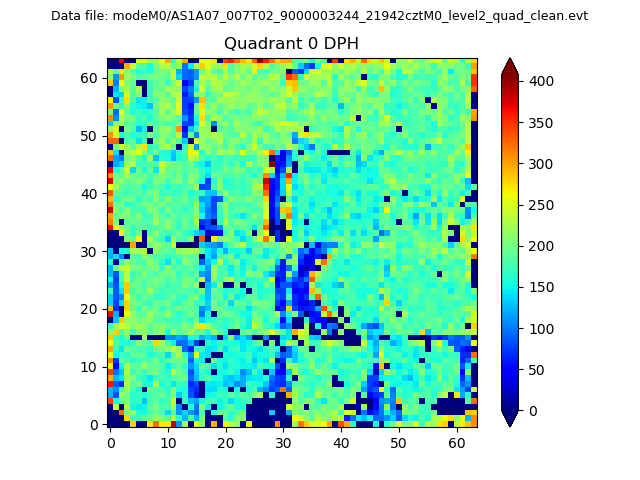 |
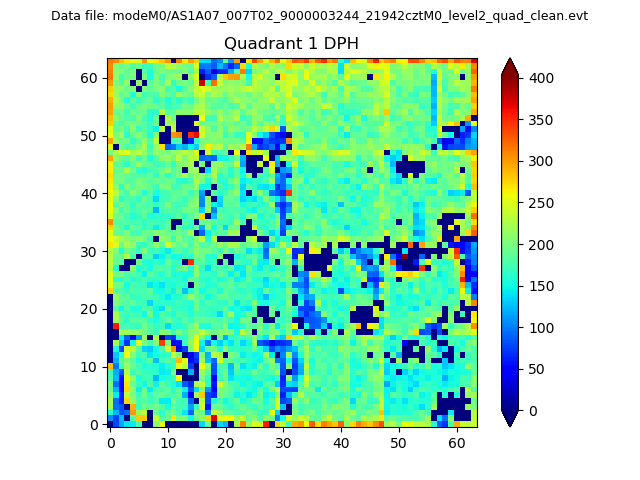 |
Quadrant B |
|---|---|---|---|
| Quadrant D | 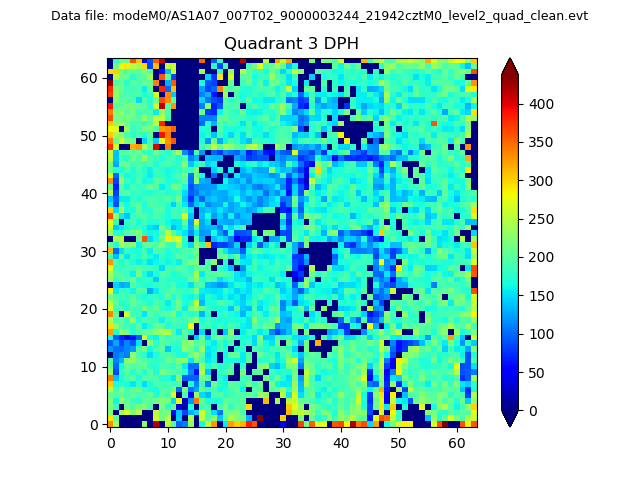 |
 |
Quadrant C |
| Plot type | Count rate plots | Images |
|---|---|---|
| Comparison with Poisson distribution Blue bars denote a histogram of data divided into 1 sec bins. Red curve is a Poisson curve with rate = median count rate of data. |
 |
 |
| Quadrant-wise count rates Data is divided into 100 sec bins |
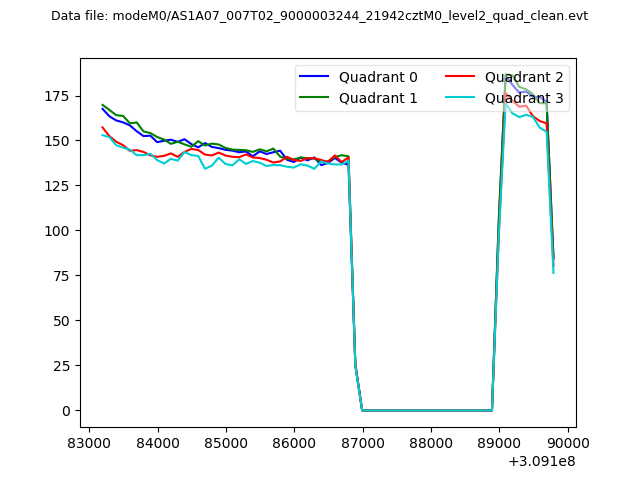 |
|
| Module-wise count rates for Quadrant A Data is divided into 100 sec bins |
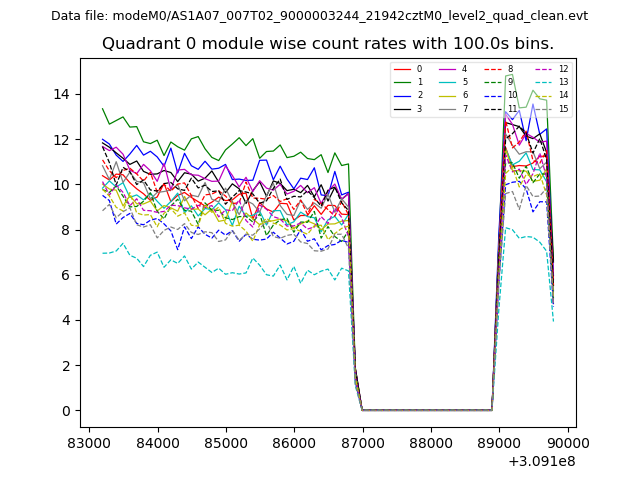 |
 |
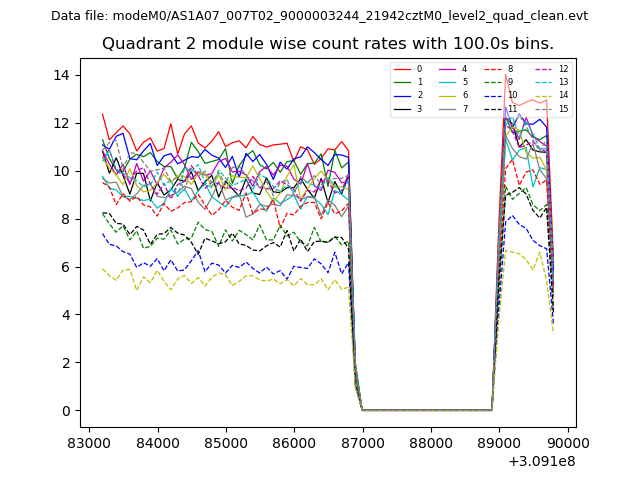
| Module-wise count rates for Quadrant B Data is divided into 100 sec bins |
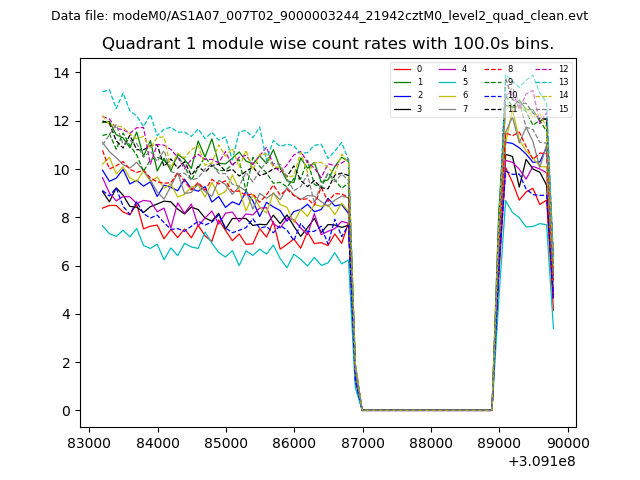 |
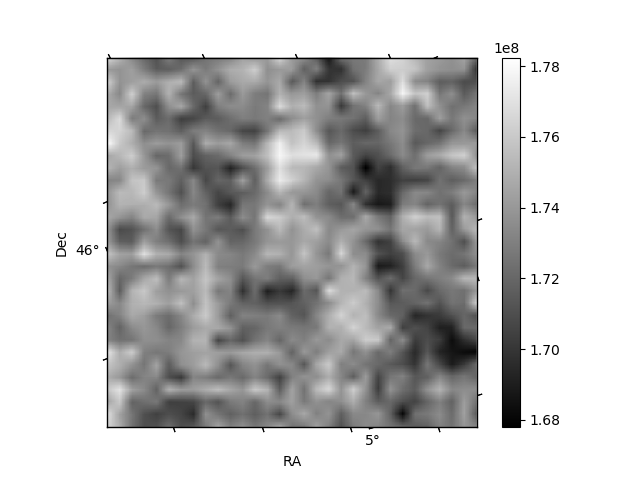 |
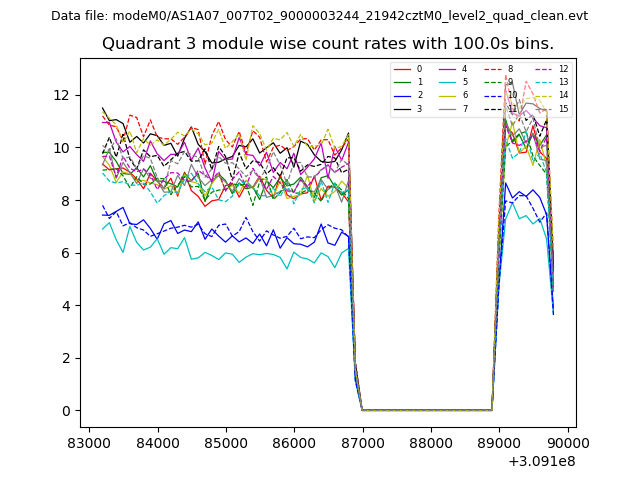
| Module-wise count rates for Quadrant C Data is divided into 100 sec bins |
 |
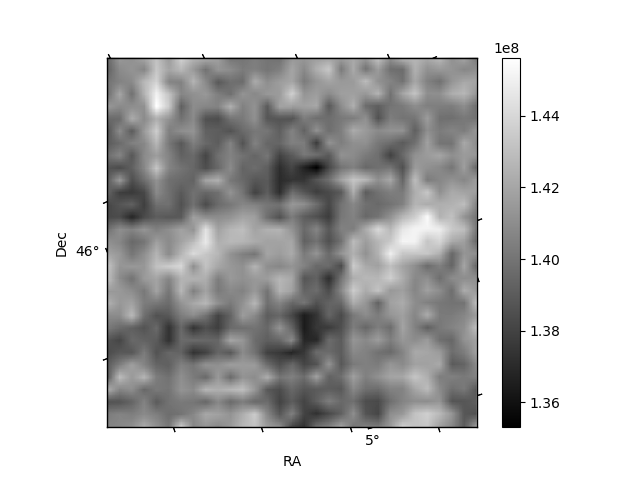 |
| Module-wise count rates for Quadrant D Data is divided into 100 sec bins |
 |
 |
| Parameter | Plot |
|---|---|
| CZT HV Monitor | 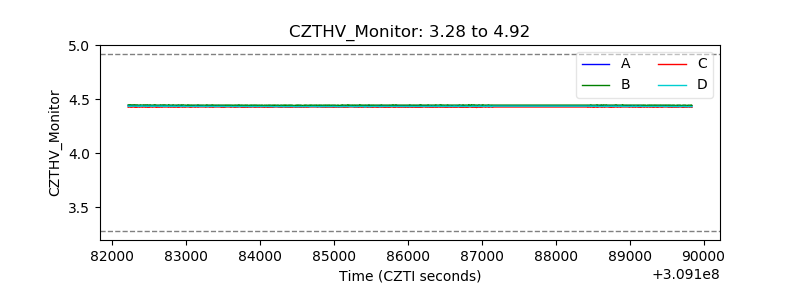 |
| D_VDD | 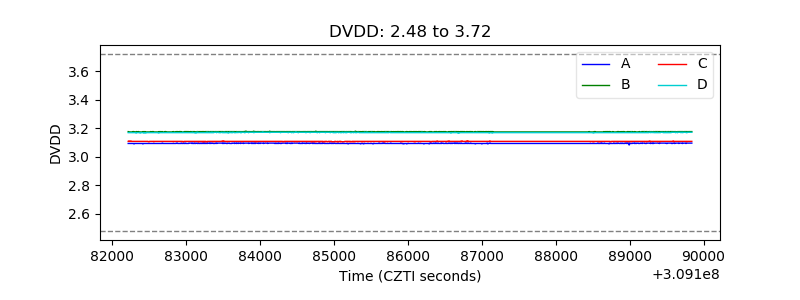 |
| Temperature 1 | 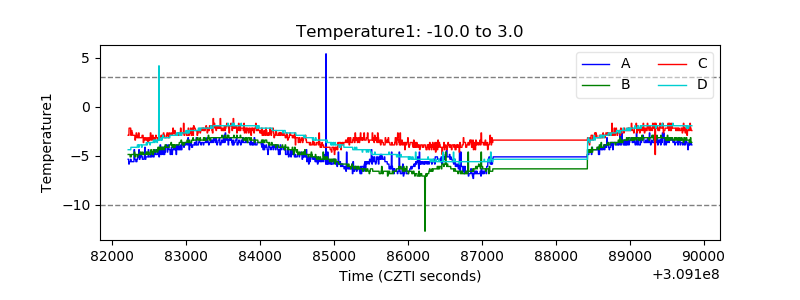 |
| Veto HV Monitor |  |
| Veto LLD | 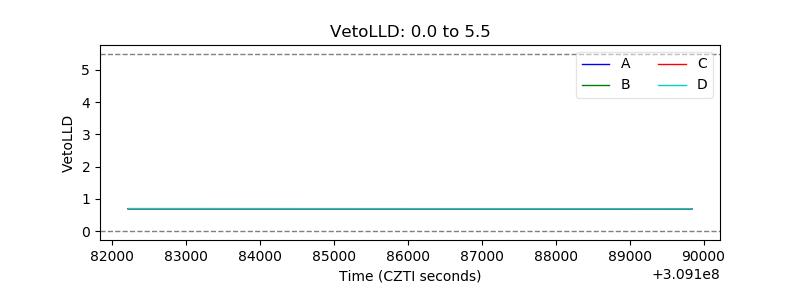 |
| Alpha Counter | 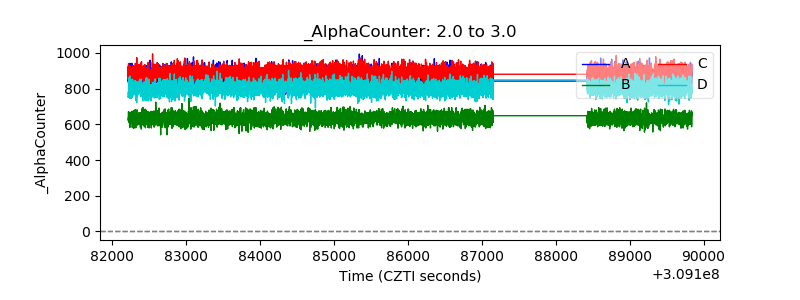 |
| _CPM_Rate | 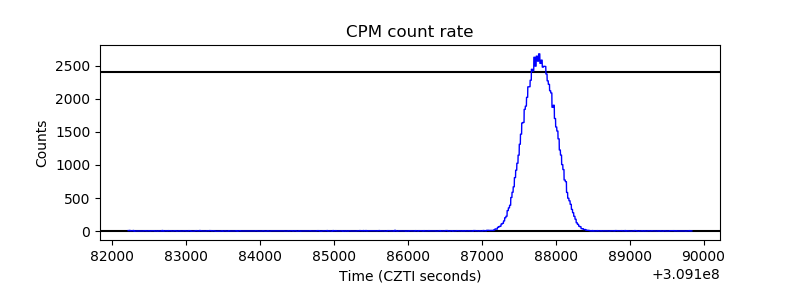 |
| CZT Counter | 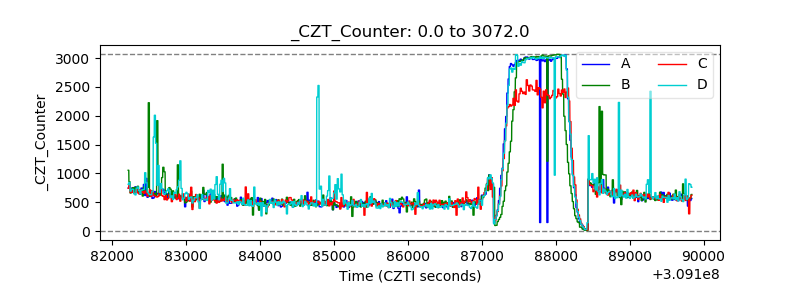 |
| +2.5 Volts monitor | 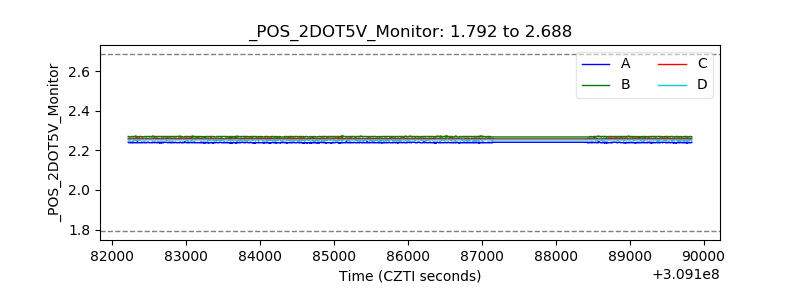 |
| +5 Volts monitor |  |
| _ROLL_ROT | 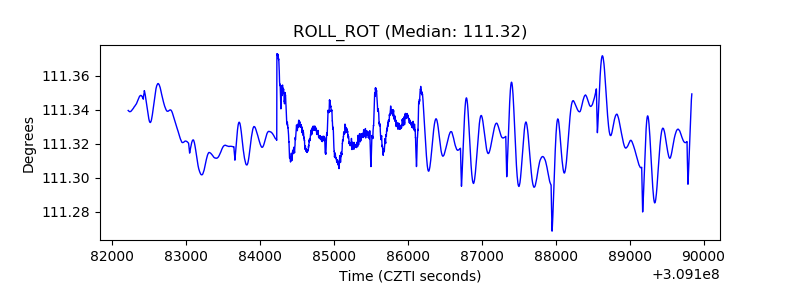 |
| _Roll_DEC | 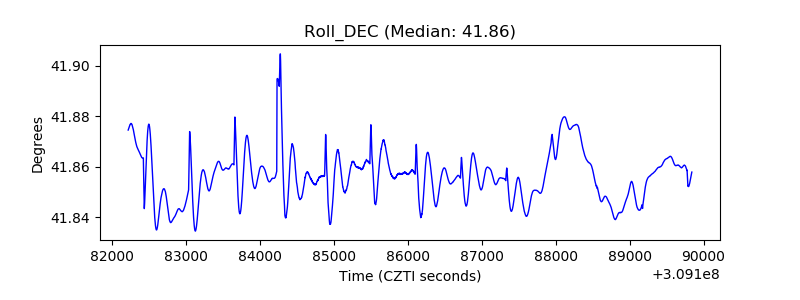 |
| _Roll_RA | 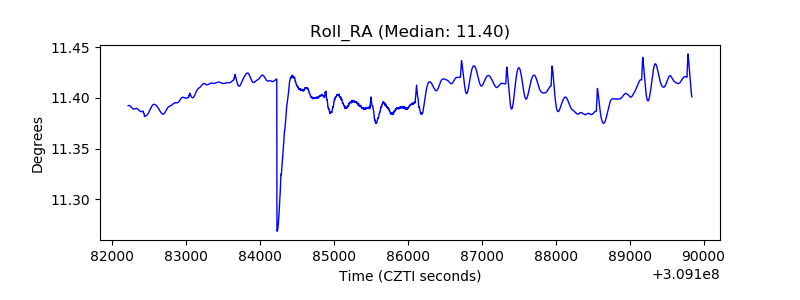 |
| Veto Counter | 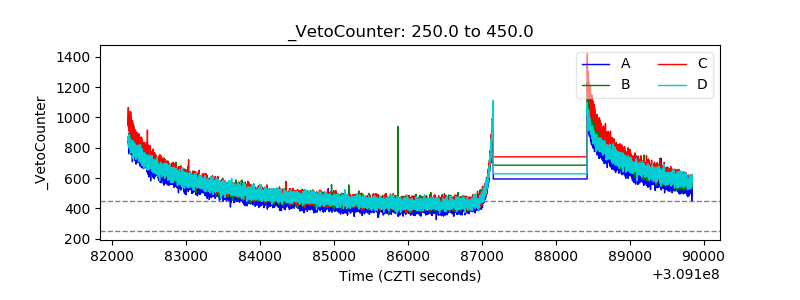 |