| Param | Original file | Final file |
|---|---|---|
| Filename | modeM0/AS1A07_007T02_9000003244_21944cztM0_level2.evt | modeM0/AS1A07_007T02_9000003244_21944cztM0_level2_quad_clean.evt |
| Size (bytes) | 470,376,000 | 118,154,880 |
| Size | 448.6 MB | 112.7 MB |
| Events in quadrant A | 3,334,683 | 797,253 |
| Events in quadrant B | 3,577,328 | 803,204 |
| Events in quadrant C | 3,428,187 | 783,490 |
| Events in quadrant D | 3,484,027 | 761,884 |
| Mode M0 | |||
|---|---|---|---|
| Quadrant | BADHDUFLAG | Total packets | Discarded packets |
| A | 0 | 13916 | 2 |
| B | 0 | 14766 | 2 |
| C | 0 | 14150 | 2 |
| D | 0 | 14382 | 3 |
| Mode M9 | |||
|---|---|---|---|
| Quadrant | BADHDUFLAG | Total packets | Discarded packets |
| A | 0 | 20 | 0 |
| B | 0 | 21 | 0 |
| C | 0 | 21 | 0 |
| D | 0 | 21 | 0 |
| Mode SS | |||
|---|---|---|---|
| Quadrant | BADHDUFLAG | Total packets | Discarded packets |
| A | 0 | 126 | 0 |
| B | 0 | 126 | 0 |
| C | 0 | 126 | 0 |
| D | 0 | 126 | 0 |
| Quadrant | Total seconds | Saturated seconds | Saturation percentage |
|---|---|---|---|
| A | 6202 | 124 | 1.999355% |
| B | 6202 | 171 | 2.757175% |
| C | 6202 | 169 | 2.724927% |
| D | 6201 | 112 | 1.806160% |
Noise dominated data is calculated using 1-second bins in cleaned event files. If a bin has >2000 counts, and if more than 50% of those come from <1% of pixels, then it is considered to be noise-dominated and hence unusable.
| Quadrant | # 1 sec bins | Bins with >0 counts | Bins with >2000 counts | High rate bins dominated by noise | Noise dominated (total time) | Noise dominated (detector-on time) | Marked lightcurve |
|---|---|---|---|---|---|---|---|
| A | 7512 | 6202 | 0 | 0 | 0.00% | 0.00% | 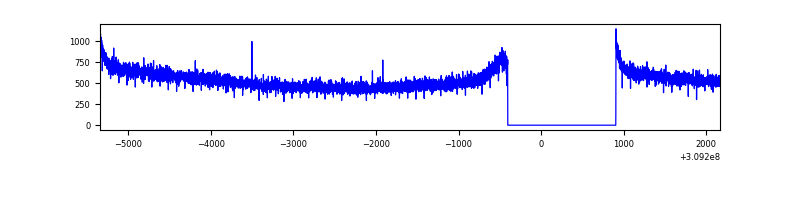 |
| B | 7512 | 6202 | 22 | 22 | 0.29% | 0.35% | 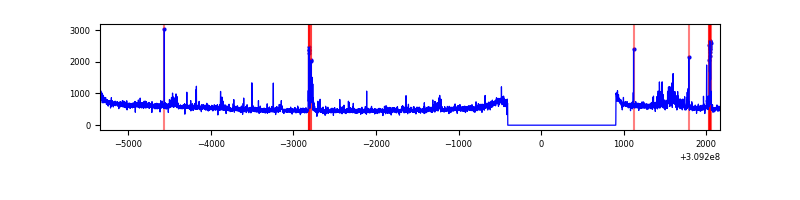 |
| C | 7512 | 6202 | 0 | 0 | 0.00% | 0.00% | 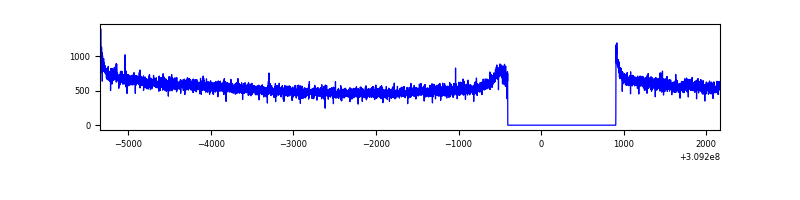 |
| D | 7511 | 6201 | 5 | 5 | 0.07% | 0.08% | 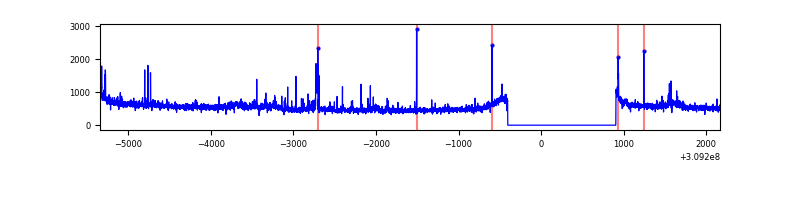 |
Top three noisy pixels from each quadrant. If the there are fewer than three noisy pixels in the level2.evt file, extra rows are filled as -1
| Pixel properties | Quadrant properties | ||||||
|---|---|---|---|---|---|---|---|
| Quadrant | DetID | PixID | Counts | Sigma | Mean | Median | Sigma |
| A | 13 | 254 | 9290 | 49.56 | 865 | 849 | 170.3 |
| A | 0 | 226 | 7543 | 39.3 | 865 | 849 | 170.3 |
| A | 3 | 137 | 6848 | 35.22 | 865 | 849 | 170.3 |
| B | 0 | 197 | 97209 | 612.3 | 851 | 833 | 157.4 |
| B | 0 | 230 | 69757 | 437.89 | 851 | 833 | 157.4 |
| B | 3 | 64 | 54789 | 342.79 | 851 | 833 | 157.4 |
| C | 14 | 238 | 134957 | 688.6 | 843 | 852 | 194.8 |
| C | 0 | 10 | 7307 | 33.15 | 843 | 852 | 194.8 |
| C | 13 | 61 | 5648 | 24.63 | 843 | 852 | 194.8 |
| D | 1 | 52 | 199854 | 969.93 | 854 | 829 | 205.2 |
| D | 13 | 172 | 34433 | 163.77 | 854 | 829 | 205.2 |
| D | 2 | 234 | 23116 | 108.61 | 854 | 829 | 205.2 |
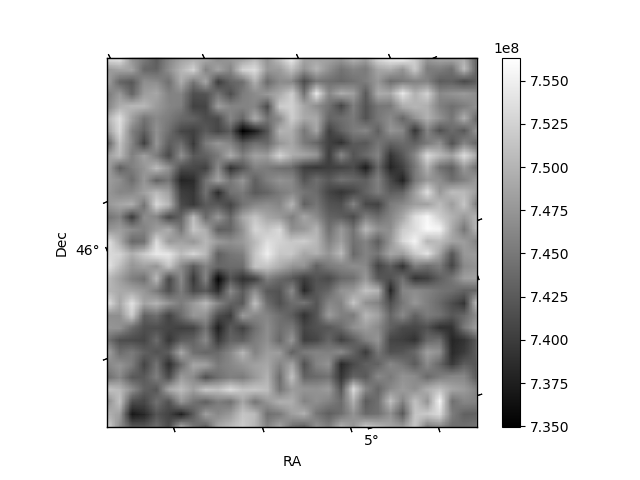
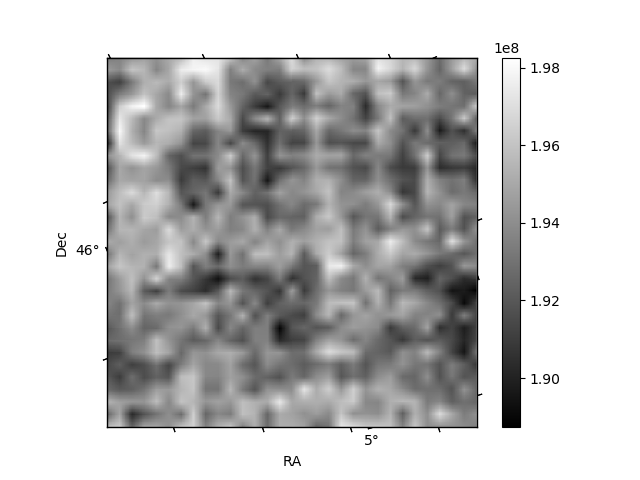
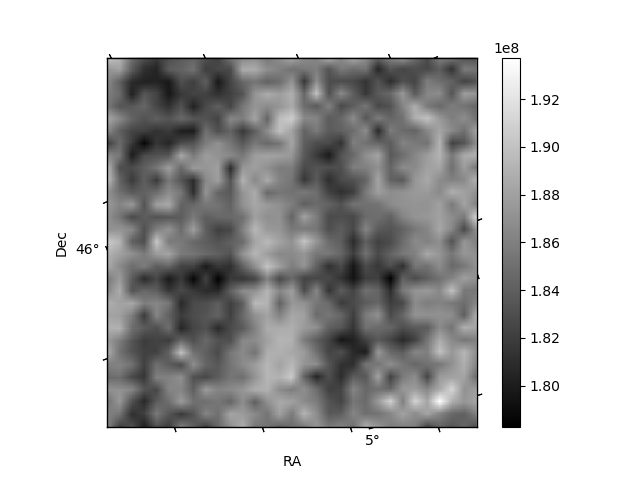
Histogram calculated using DETX and DETY for each event in the final _common_clean file
| Quadrant A | 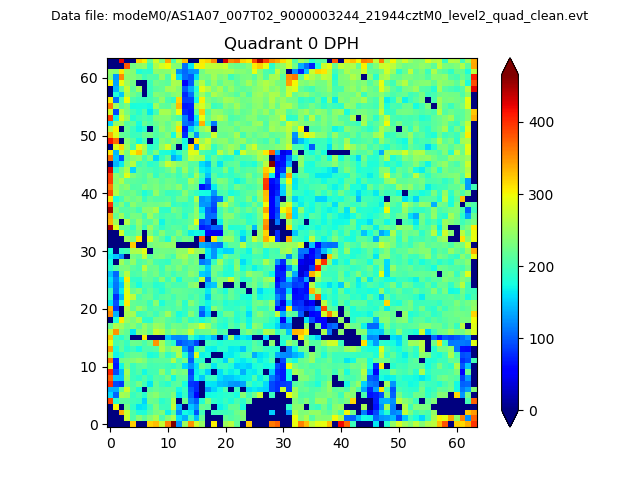 |
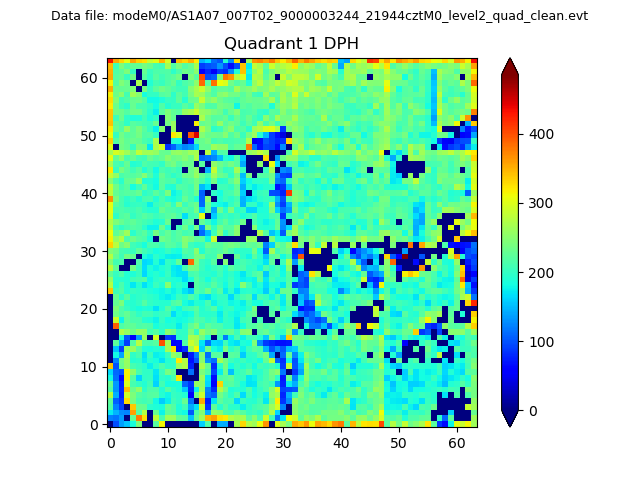 |
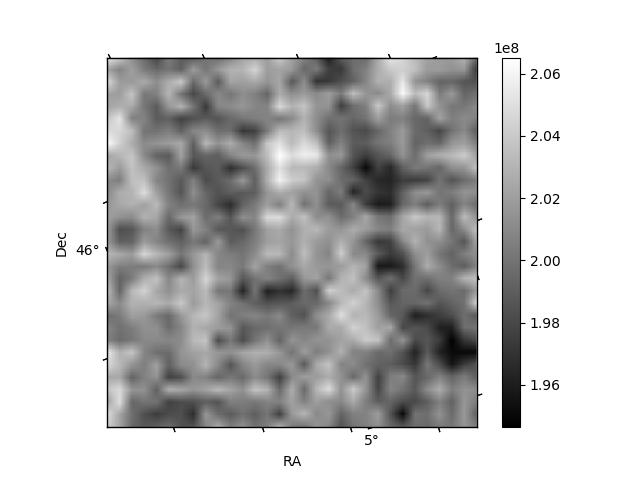
Quadrant B |
|---|---|---|---|
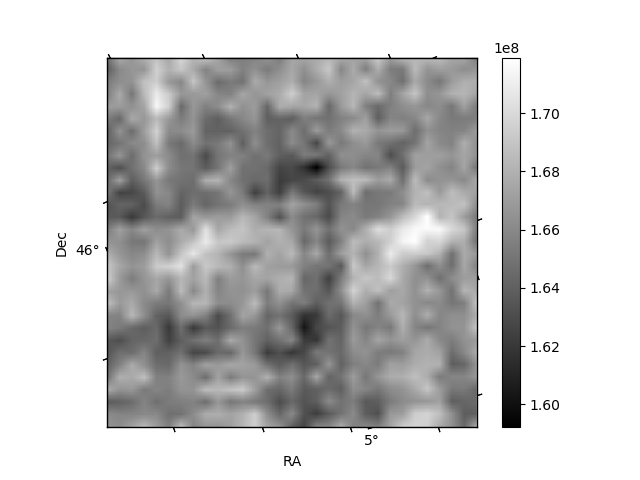
| Quadrant D | 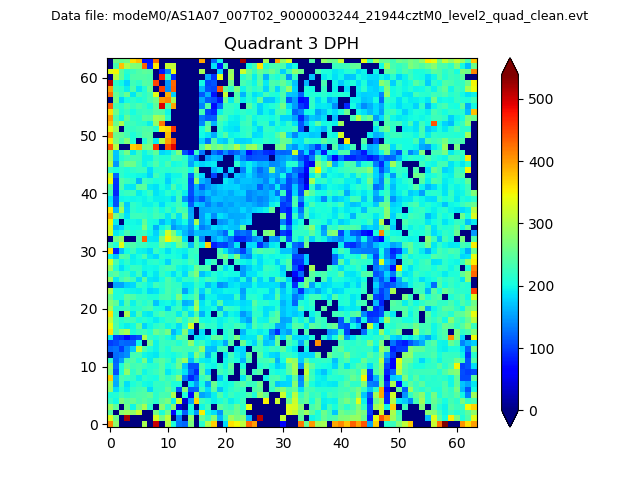 |
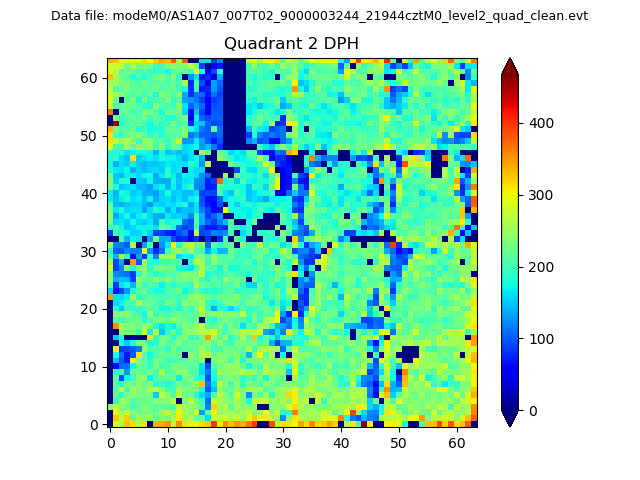 |
Quadrant C |
| Plot type | Count rate plots | Images |
|---|---|---|
| Comparison with Poisson distribution Blue bars denote a histogram of data divided into 1 sec bins. Red curve is a Poisson curve with rate = median count rate of data. |
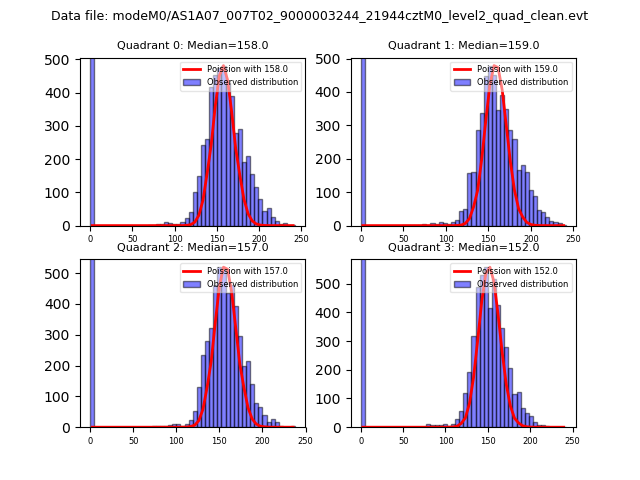 |
 |
| Quadrant-wise count rates Data is divided into 100 sec bins |
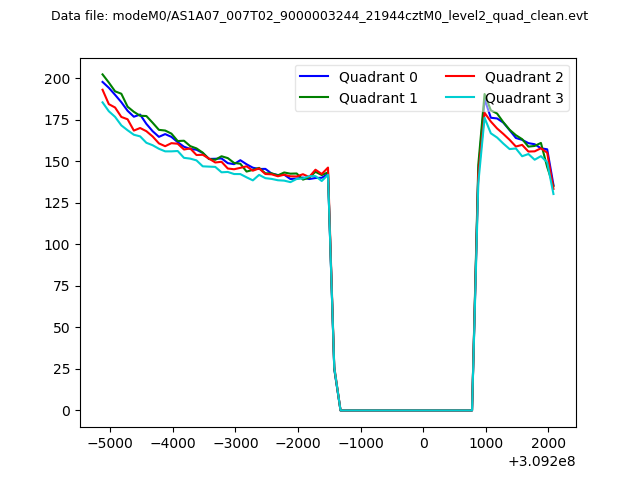 |
|
| Module-wise count rates for Quadrant A Data is divided into 100 sec bins |
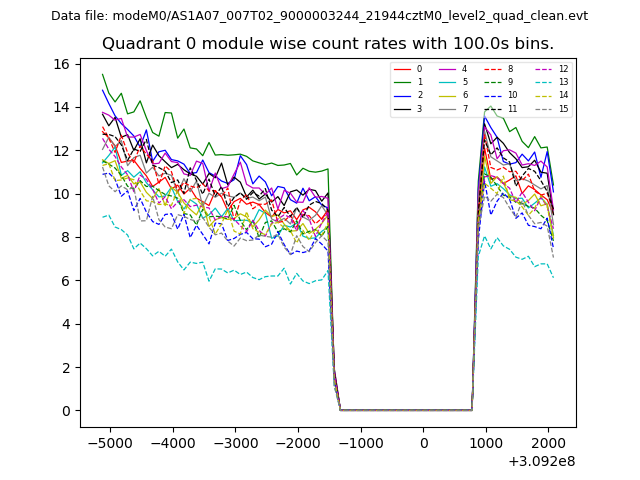 |
 |
| Module-wise count rates for Quadrant B Data is divided into 100 sec bins |
 |
 |
| Module-wise count rates for Quadrant C Data is divided into 100 sec bins |
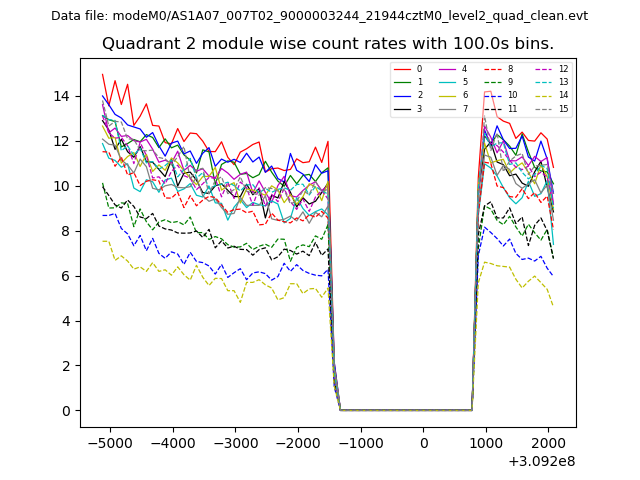 |
 |
| Module-wise count rates for Quadrant D Data is divided into 100 sec bins |
 |
 |
| Parameter | Plot |
|---|---|
| CZT HV Monitor | 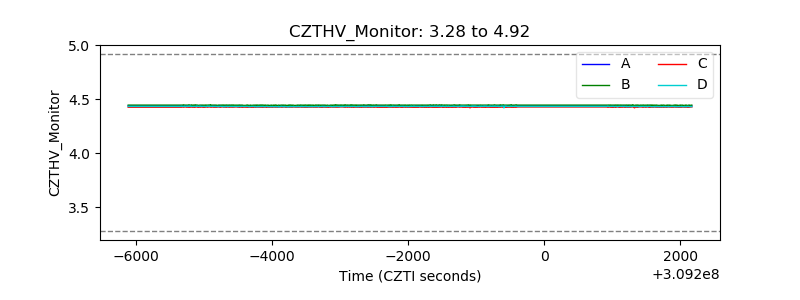 |
| D_VDD | 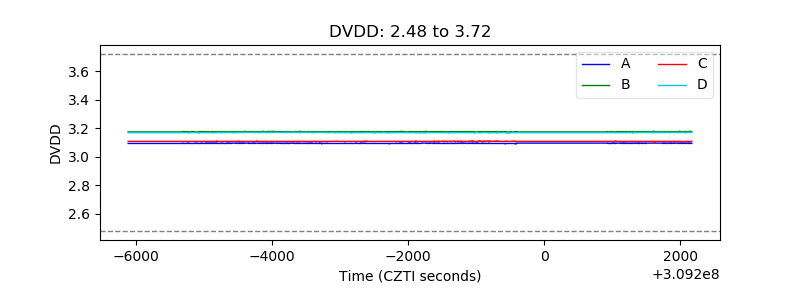 |
| Temperature 1 | 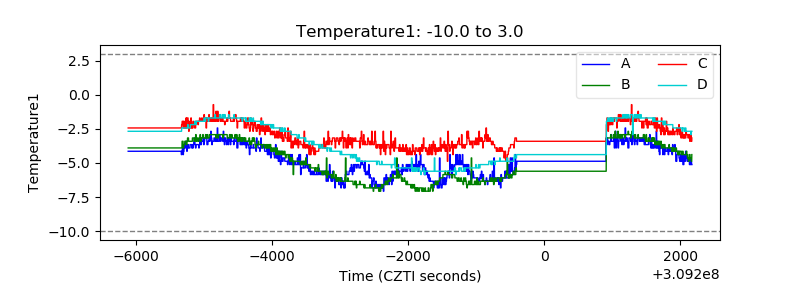 |
| Veto HV Monitor | 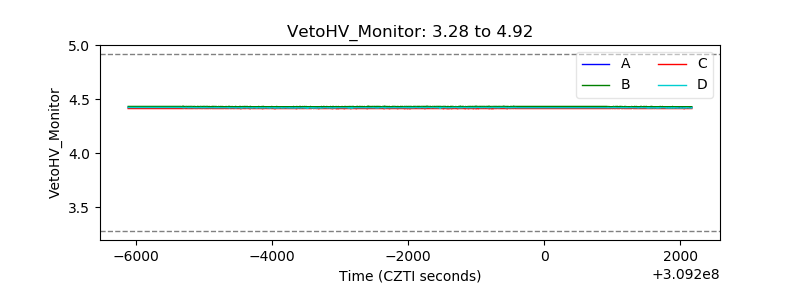 |
| Veto LLD |  |
| Alpha Counter | 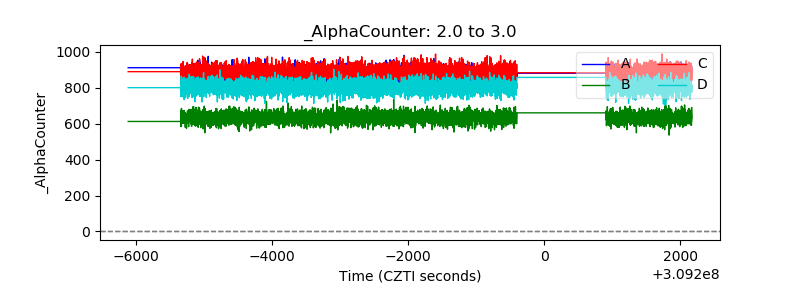 |
| _CPM_Rate | 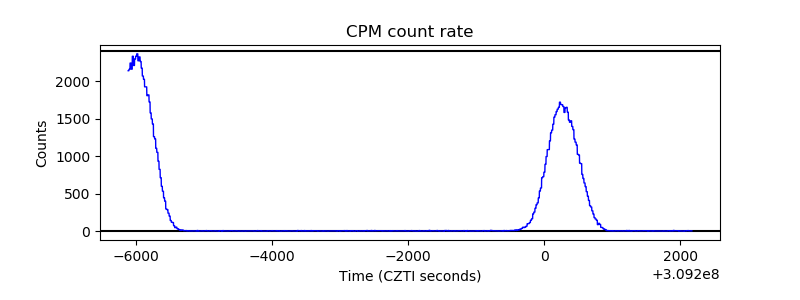 |
| CZT Counter | 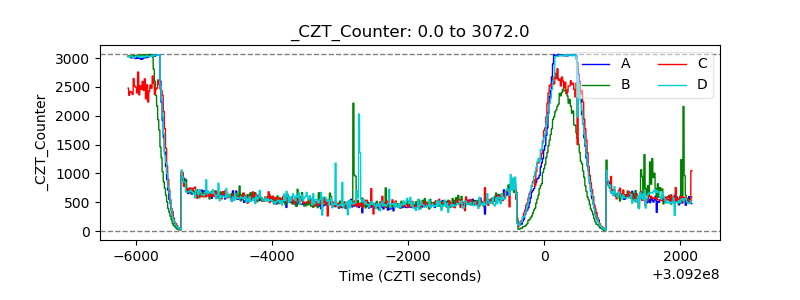 |
| +2.5 Volts monitor | 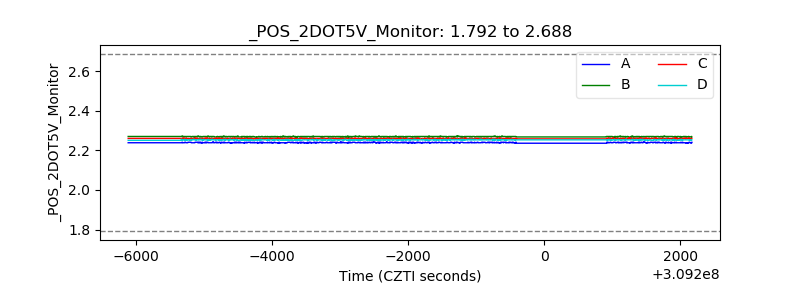 |
| +5 Volts monitor |  |
| _ROLL_ROT | 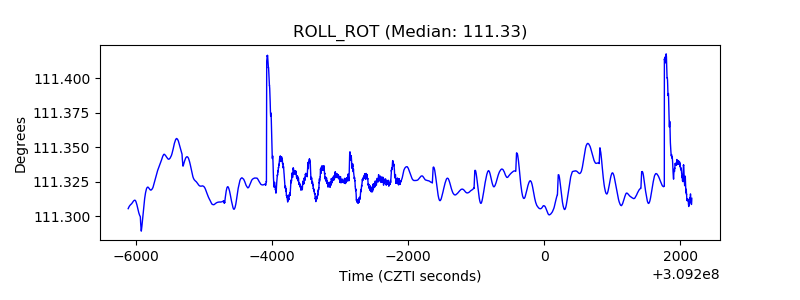 |
| _Roll_DEC | 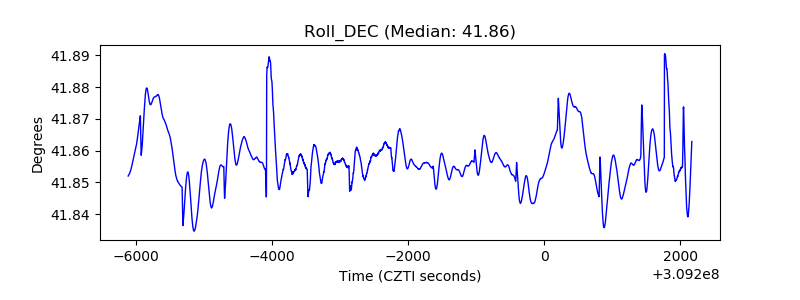 |
| _Roll_RA | 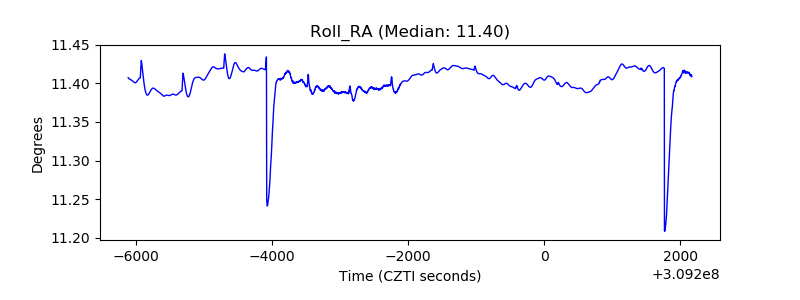 |
| Veto Counter | 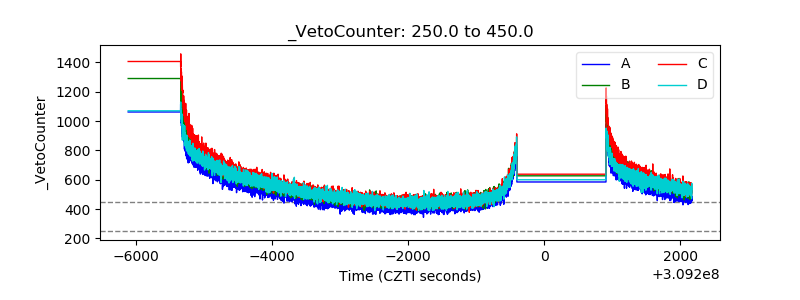 |