| Param | Original file | Final file |
|---|---|---|
| Filename | modeM0/AS1A07_007T02_9000003244_21945cztM0_level2.evt | modeM0/AS1A07_007T02_9000003244_21945cztM0_level2_quad_clean.evt |
| Size (bytes) | 465,209,280 | 110,108,160 |
| Size | 443.7 MB | 105.0 MB |
| Events in quadrant A | 3,225,054 | 729,156 |
| Events in quadrant B | 3,611,988 | 737,238 |
| Events in quadrant C | 3,338,635 | 723,353 |
| Events in quadrant D | 3,479,279 | 699,339 |
| Mode M0 | |||
|---|---|---|---|
| Quadrant | BADHDUFLAG | Total packets | Discarded packets |
| A | 0 | 13636 | 2 |
| B | 0 | 14783 | 2 |
| C | 0 | 13814 | 2 |
| D | 0 | 14507 | 2 |
| Mode M9 | |||
|---|---|---|---|
| Quadrant | BADHDUFLAG | Total packets | Discarded packets |
| A | 0 | 23 | 0 |
| B | 0 | 24 | 0 |
| C | 0 | 24 | 0 |
| D | 0 | 24 | 0 |
| Mode SS | |||
|---|---|---|---|
| Quadrant | BADHDUFLAG | Total packets | Discarded packets |
| A | 0 | 130 | 0 |
| B | 0 | 130 | 0 |
| C | 0 | 130 | 0 |
| D | 0 | 130 | 0 |
| Quadrant | Total seconds | Saturated seconds | Saturation percentage |
|---|---|---|---|
| A | 6389 | 50 | 0.782595% |
| B | 6389 | 119 | 1.862576% |
| C | 6389 | 107 | 1.674753% |
| D | 6388 | 110 | 1.721979% |
Noise dominated data is calculated using 1-second bins in cleaned event files. If a bin has >2000 counts, and if more than 50% of those come from <1% of pixels, then it is considered to be noise-dominated and hence unusable.
| Quadrant | # 1 sec bins | Bins with >0 counts | Bins with >2000 counts | High rate bins dominated by noise | Noise dominated (total time) | Noise dominated (detector-on time) | Marked lightcurve |
|---|---|---|---|---|---|---|---|
| A | 7599 | 6390 | 0 | 0 | 0.00% | 0.00% | 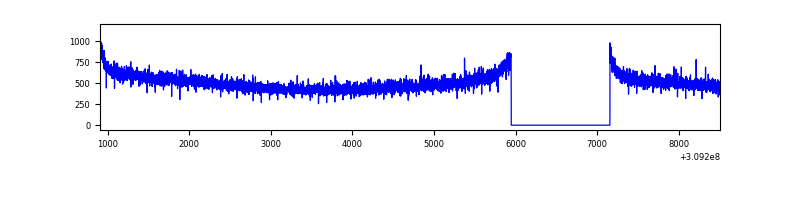 |
| B | 7599 | 6390 | 47 | 47 | 0.62% | 0.74% | 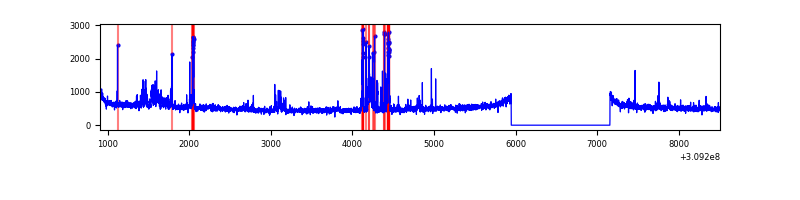 |
| C | 7599 | 6389 | 0 | 0 | 0.00% | 0.00% | 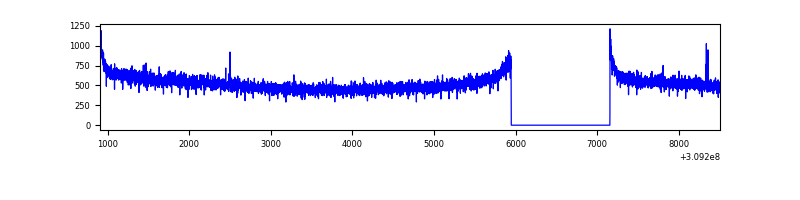 |
| D | 7598 | 6389 | 71 | 71 | 0.93% | 1.11% | 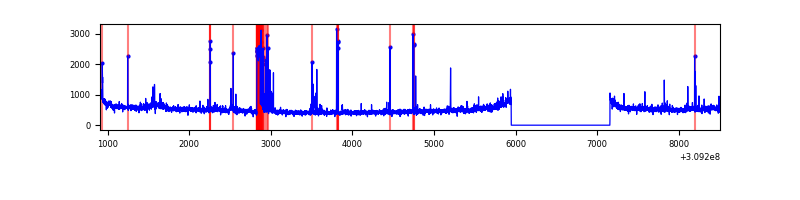 |
Top three noisy pixels from each quadrant. If the there are fewer than three noisy pixels in the level2.evt file, extra rows are filled as -1
| Pixel properties | Quadrant properties | ||||||
|---|---|---|---|---|---|---|---|
| Quadrant | DetID | PixID | Counts | Sigma | Mean | Median | Sigma |
| A | 13 | 254 | 9904 | 54.51 | 836 | 819 | 166.7 |
| A | 0 | 226 | 7160 | 38.04 | 836 | 819 | 166.7 |
| A | 3 | 137 | 6729 | 35.46 | 836 | 819 | 166.7 |
| B | 3 | 64 | 218688 | 1403.33 | 828 | 808 | 155.3 |
| B | 0 | 197 | 93554 | 597.36 | 828 | 808 | 155.3 |
| B | 0 | 230 | 41552 | 262.43 | 828 | 808 | 155.3 |
| C | 14 | 238 | 129590 | 677.98 | 820 | 828 | 189.9 |
| C | 0 | 10 | 7025 | 32.63 | 820 | 828 | 189.9 |
| C | 13 | 61 | 5571 | 24.97 | 820 | 828 | 189.9 |
| D | 1 | 52 | 320756 | 1601.86 | 824 | 802 | 199.7 |
| D | 13 | 172 | 40652 | 199.51 | 824 | 802 | 199.7 |
| D | 2 | 234 | 22267 | 107.47 | 824 | 802 | 199.7 |
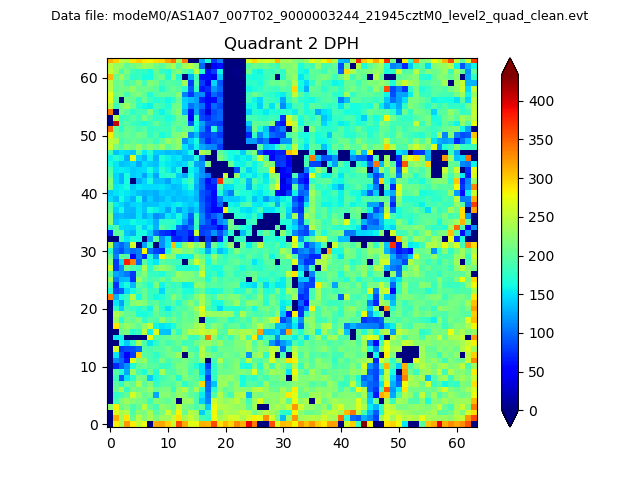
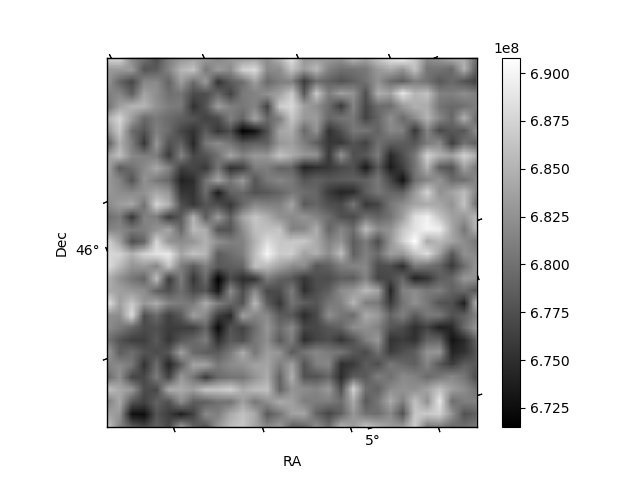
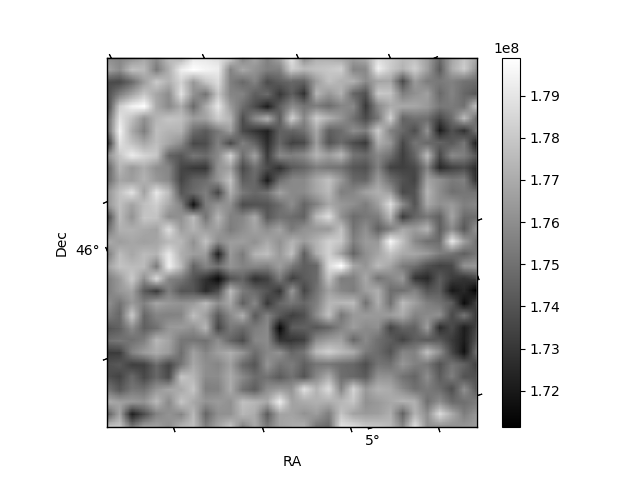
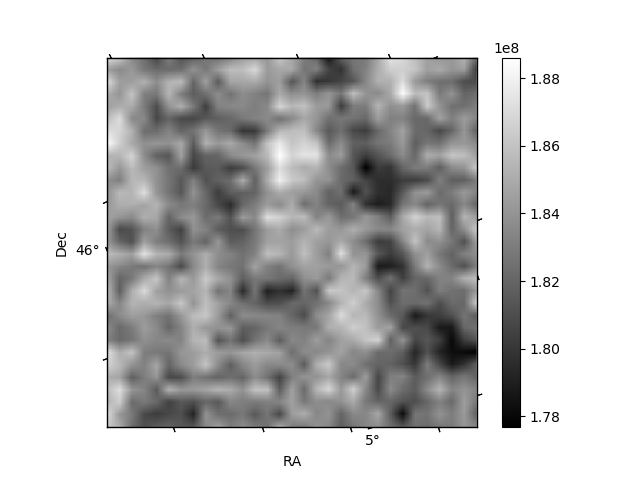
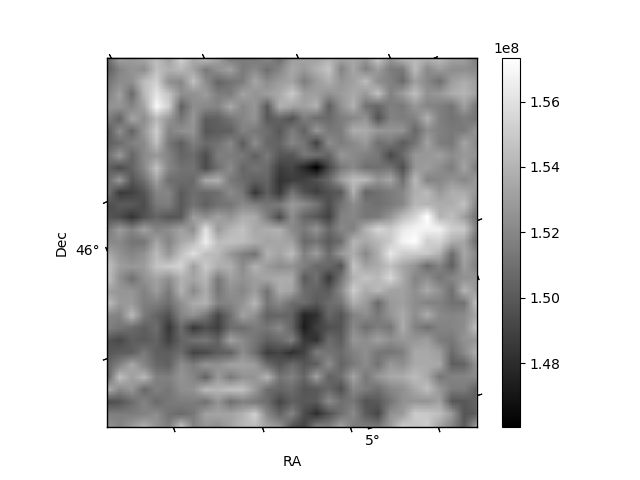
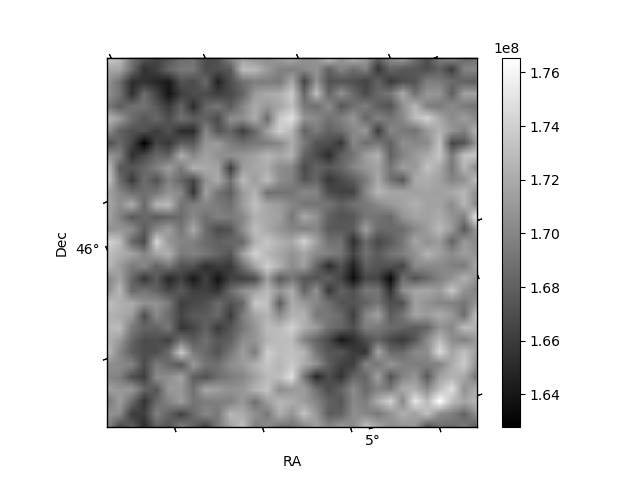
Histogram calculated using DETX and DETY for each event in the final _common_clean file
| Quadrant A | 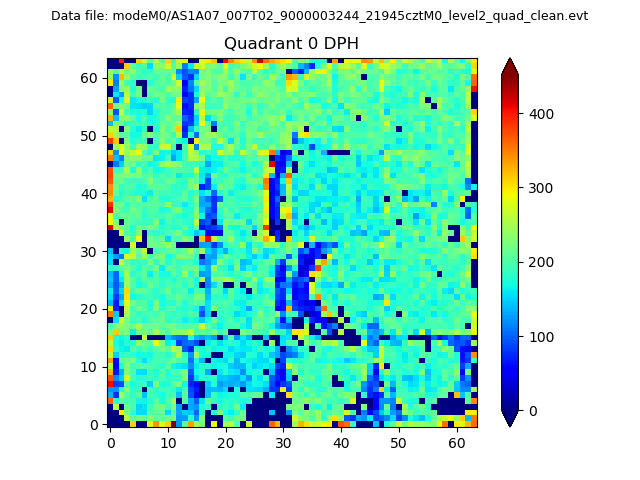 |
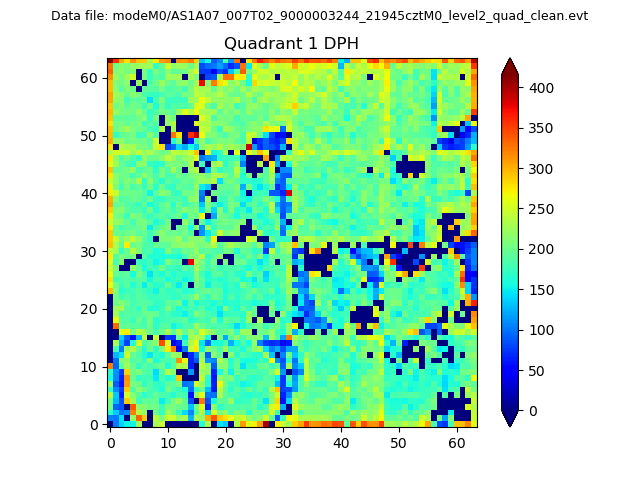 |
Quadrant B |
|---|---|---|---|
| Quadrant D | 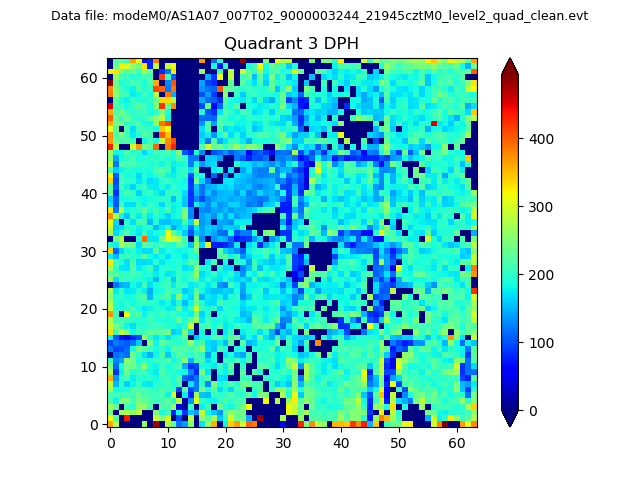 |
 |
Quadrant C |
| Plot type | Count rate plots | Images |
|---|---|---|
| Comparison with Poisson distribution Blue bars denote a histogram of data divided into 1 sec bins. Red curve is a Poisson curve with rate = median count rate of data. |
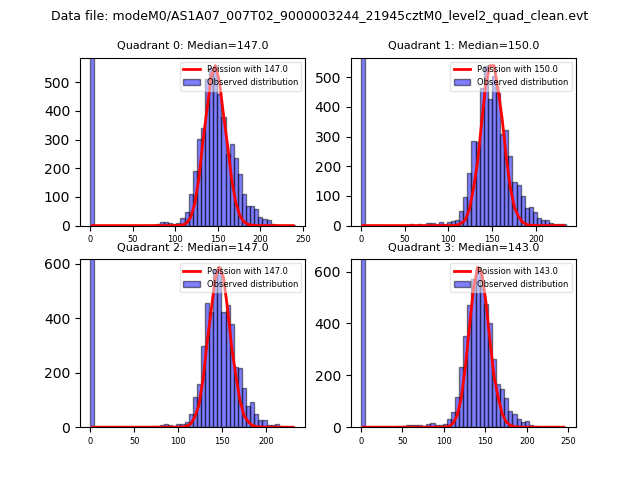 |
 |
| Quadrant-wise count rates Data is divided into 100 sec bins |
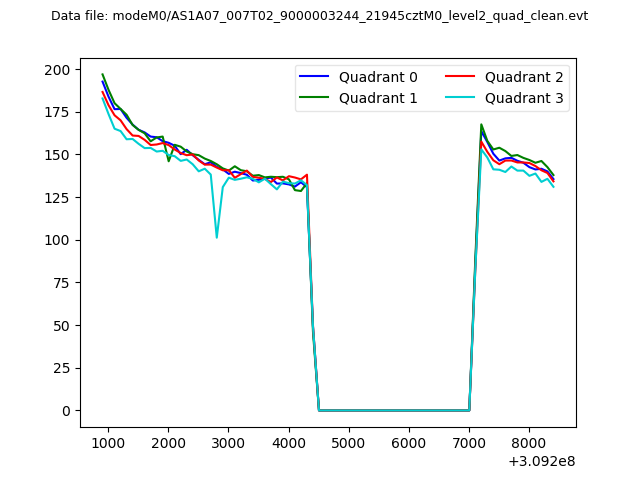 |
|
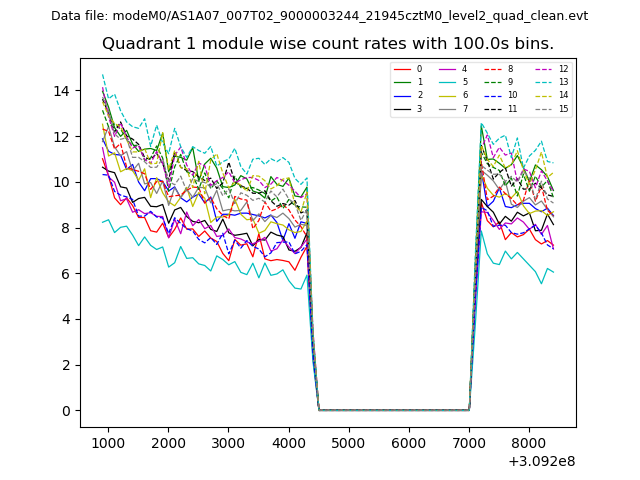
| Module-wise count rates for Quadrant A Data is divided into 100 sec bins |
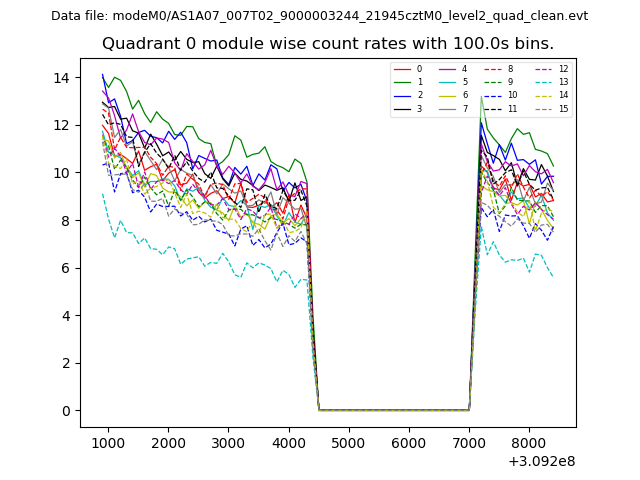 |
 |
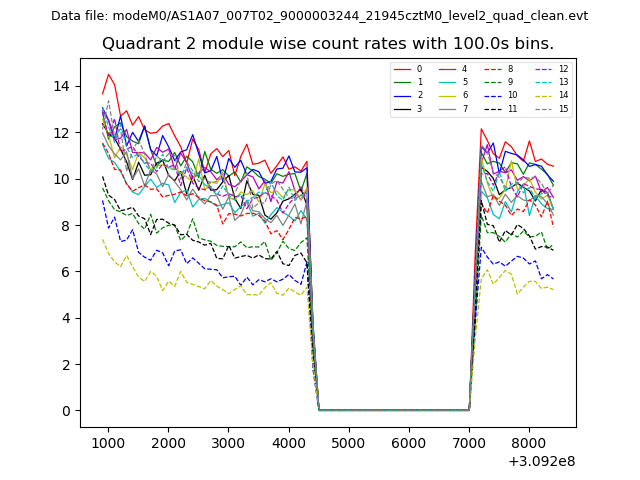
| Module-wise count rates for Quadrant B Data is divided into 100 sec bins |
 |
 |
| Module-wise count rates for Quadrant C Data is divided into 100 sec bins |
 |
 |
| Module-wise count rates for Quadrant D Data is divided into 100 sec bins |
 |
 |
| Parameter | Plot |
|---|---|
| CZT HV Monitor |  |
| D_VDD | 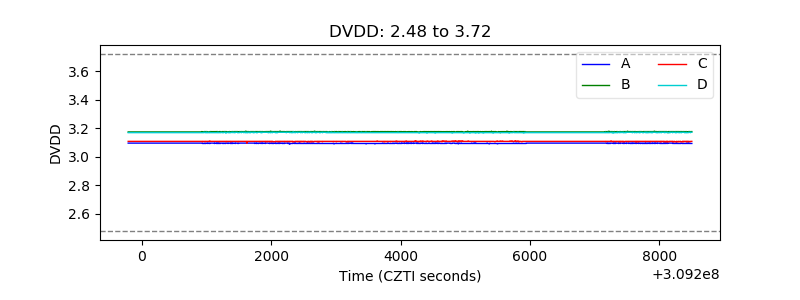 |
| Temperature 1 | 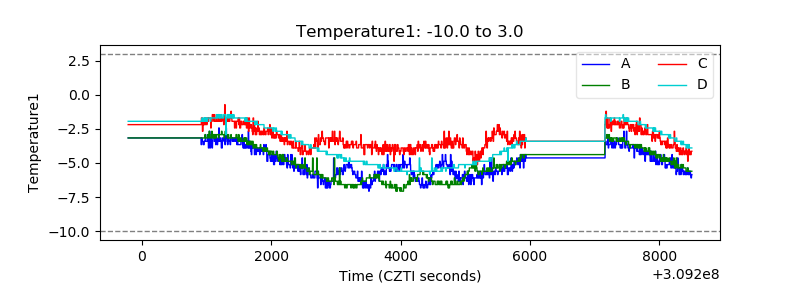 |
| Veto HV Monitor | 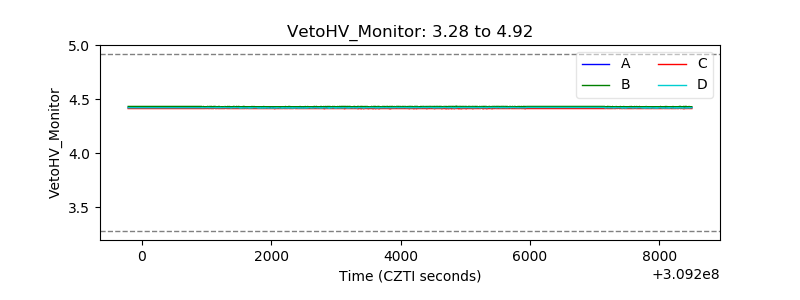 |
| Veto LLD |  |
| Alpha Counter | 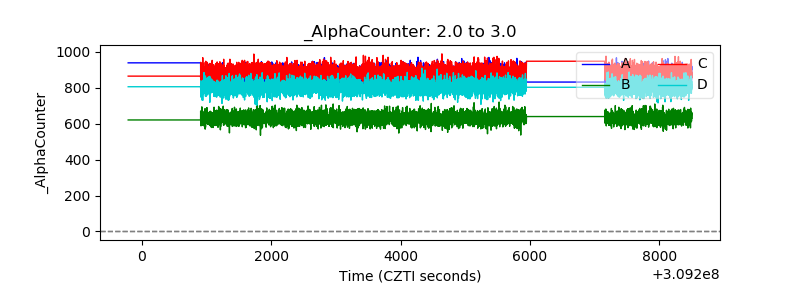 |
| _CPM_Rate | 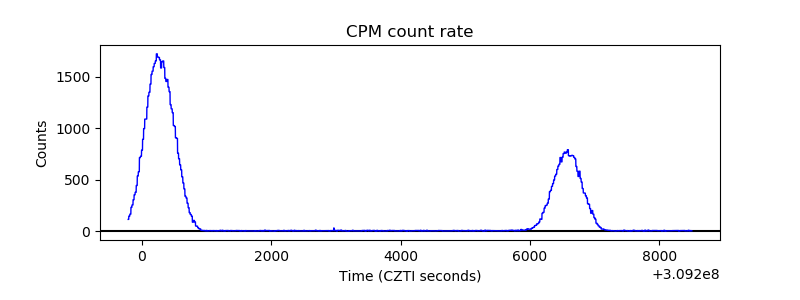 |
| CZT Counter | 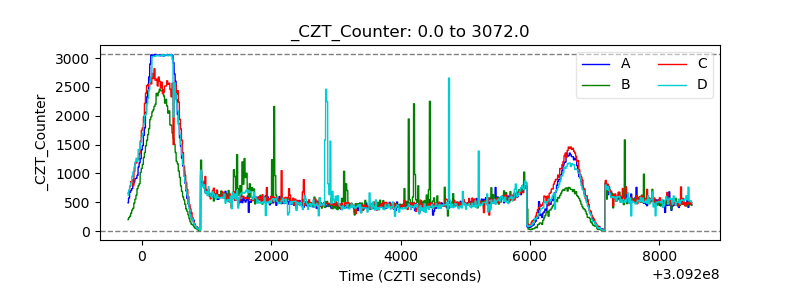 |
| +2.5 Volts monitor |  |
| +5 Volts monitor |  |
| _ROLL_ROT |  |
| _Roll_DEC | 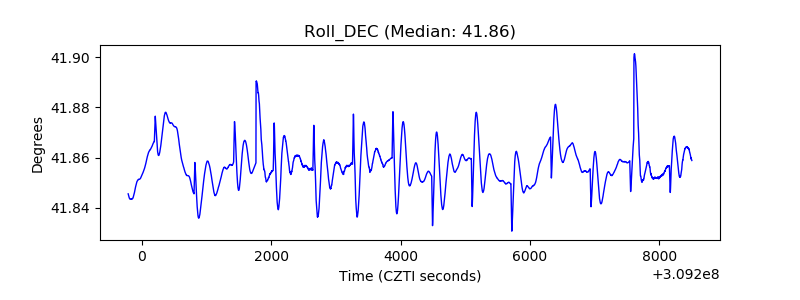 |
| _Roll_RA | 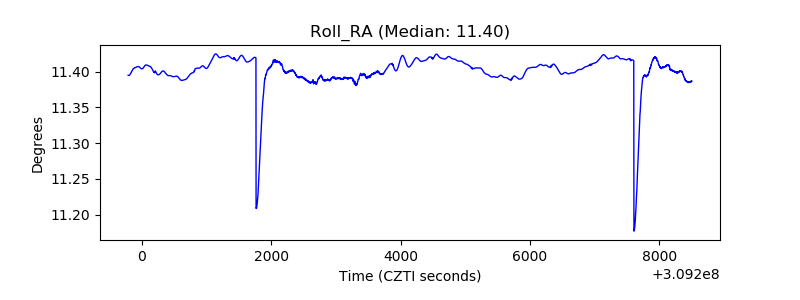 |
| Veto Counter | 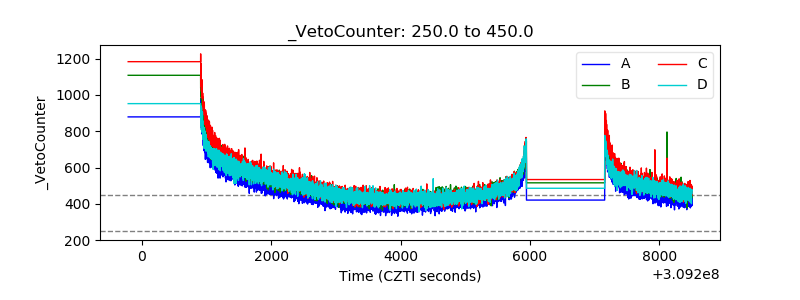 |