| Param | Original file | Final file |
|---|---|---|
| Filename | modeM0/AS1A07_007T02_9000003244_21946cztM0_level2.evt | modeM0/AS1A07_007T02_9000003244_21946cztM0_level2_quad_clean.evt |
| Size (bytes) | 473,181,120 | 98,043,840 |
| Size | 451.3 MB | 93.5 MB |
| Events in quadrant A | 3,337,188 | 624,680 |
| Events in quadrant B | 3,562,570 | 636,122 |
| Events in quadrant C | 3,439,394 | 622,371 |
| Events in quadrant D | 3,524,447 | 607,508 |
| Mode M0 | |||
|---|---|---|---|
| Quadrant | BADHDUFLAG | Total packets | Discarded packets |
| A | 0 | 14379 | 2 |
| B | 0 | 14939 | 2 |
| C | 0 | 14458 | 2 |
| D | 0 | 15033 | 2 |
| Mode M9 | |||
|---|---|---|---|
| Quadrant | BADHDUFLAG | Total packets | Discarded packets |
| A | 0 | 20 | 0 |
| B | 0 | 20 | 0 |
| C | 0 | 20 | 0 |
| D | 0 | 20 | 0 |
| Mode SS | |||
|---|---|---|---|
| Quadrant | BADHDUFLAG | Total packets | Discarded packets |
| A | 0 | 144 | 0 |
| B | 0 | 144 | 0 |
| C | 0 | 144 | 0 |
| D | 0 | 144 | 0 |
| Quadrant | Total seconds | Saturated seconds | Saturation percentage |
|---|---|---|---|
| A | 6858 | 60 | 0.874891% |
| B | 6859 | 124 | 1.807844% |
| C | 6859 | 132 | 1.924479% |
| D | 6859 | 85 | 1.239248% |
Noise dominated data is calculated using 1-second bins in cleaned event files. If a bin has >2000 counts, and if more than 50% of those come from <1% of pixels, then it is considered to be noise-dominated and hence unusable.
| Quadrant | # 1 sec bins | Bins with >0 counts | Bins with >2000 counts | High rate bins dominated by noise | Noise dominated (total time) | Noise dominated (detector-on time) | Marked lightcurve |
|---|---|---|---|---|---|---|---|
| A | 8963 | 6860 | 0 | 0 | 0.00% | 0.00% | 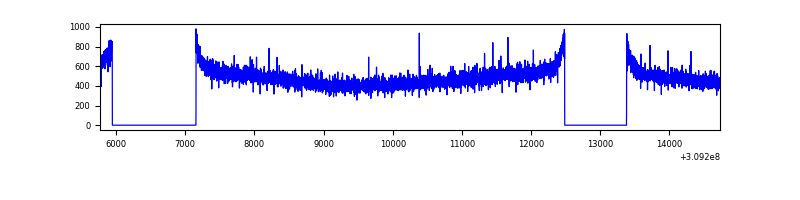 |
| B | 8964 | 6861 | 24 | 24 | 0.27% | 0.35% | 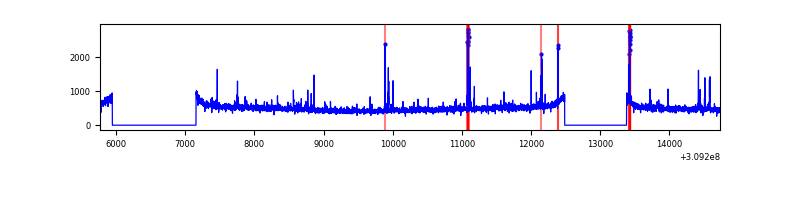 |
| C | 8964 | 6859 | 0 | 0 | 0.00% | 0.00% | 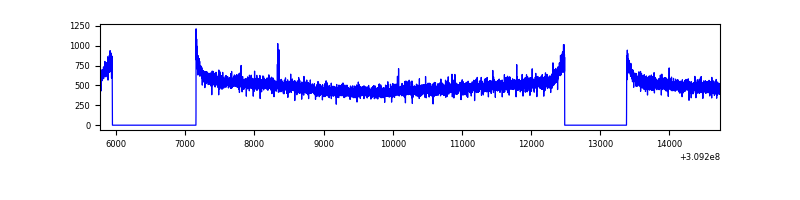 |
| D | 8964 | 6861 | 42 | 42 | 0.47% | 0.61% | 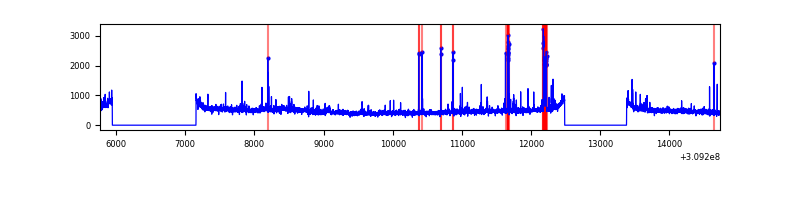 |
Top three noisy pixels from each quadrant. If the there are fewer than three noisy pixels in the level2.evt file, extra rows are filled as -1
| Pixel properties | Quadrant properties | ||||||
|---|---|---|---|---|---|---|---|
| Quadrant | DetID | PixID | Counts | Sigma | Mean | Median | Sigma |
| A | 13 | 254 | 11071 | 58.93 | 864 | 846 | 173.5 |
| A | 3 | 137 | 7492 | 38.3 | 864 | 846 | 173.5 |
| A | 0 | 226 | 7460 | 38.12 | 864 | 846 | 173.5 |
| B | 3 | 64 | 135193 | 829.86 | 856 | 834 | 161.9 |
| B | 0 | 230 | 30089 | 180.69 | 856 | 834 | 161.9 |
| B | 0 | 197 | 22118 | 131.46 | 856 | 834 | 161.9 |
| C | 14 | 238 | 131936 | 661.56 | 846 | 853 | 198.1 |
| C | 13 | 61 | 5617 | 24.04 | 846 | 853 | 198.1 |
| C | 4 | 175 | 4650 | 19.16 | 846 | 853 | 198.1 |
| D | 11 | 176 | 158420 | 765.18 | 850 | 826 | 206.0 |
| D | 1 | 52 | 121100 | 583.97 | 850 | 826 | 206.0 |
| D | 2 | 234 | 23956 | 112.3 | 850 | 826 | 206.0 |
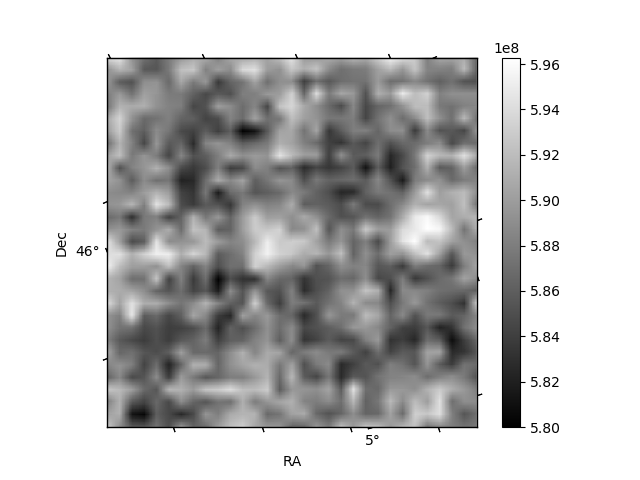
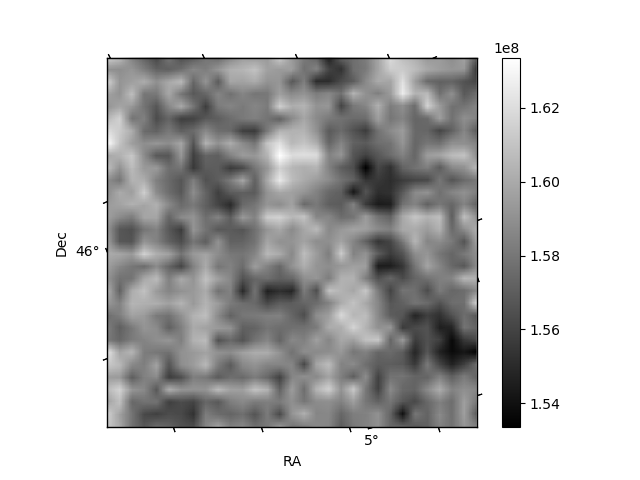
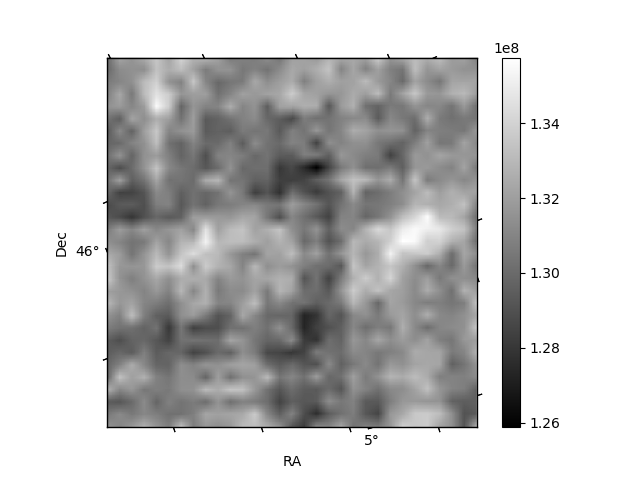
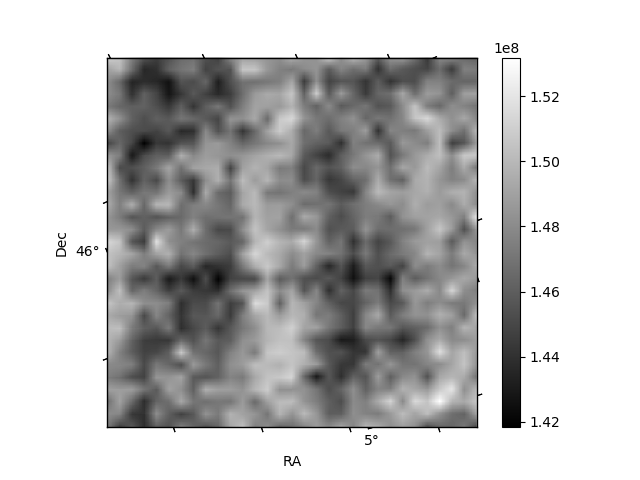
Histogram calculated using DETX and DETY for each event in the final _common_clean file
| Quadrant A | 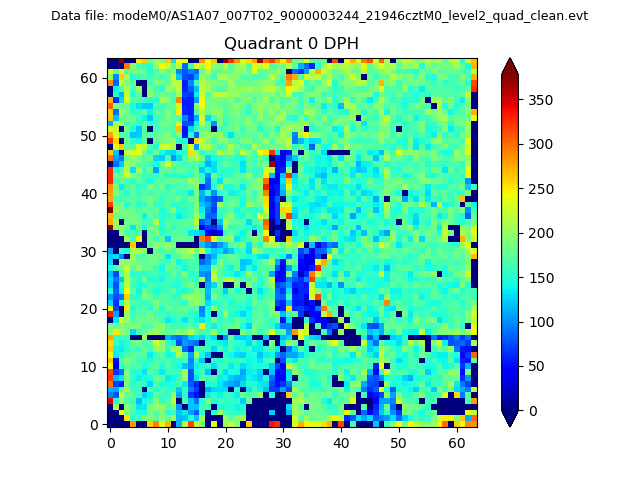 |
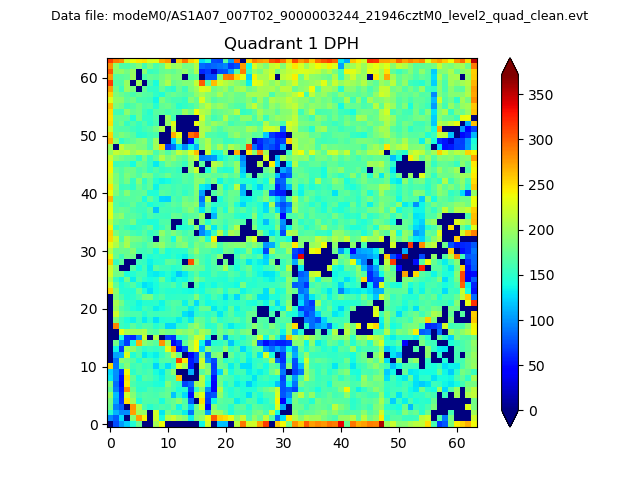 |
Quadrant B |
|---|---|---|---|
| Quadrant D | 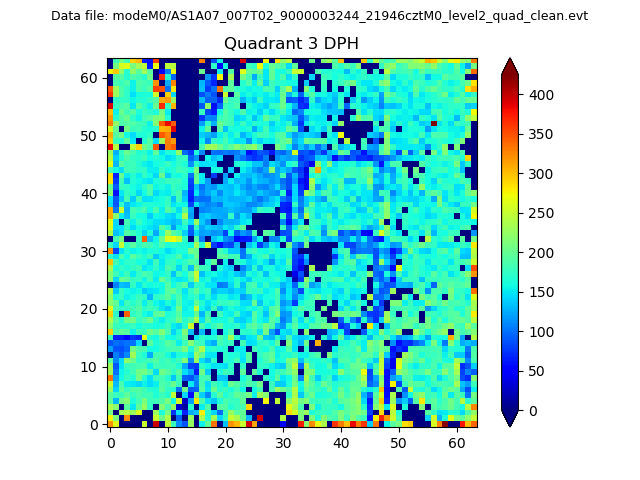 |
 |
Quadrant C |
| Plot type | Count rate plots | Images |
|---|---|---|
| Comparison with Poisson distribution Blue bars denote a histogram of data divided into 1 sec bins. Red curve is a Poisson curve with rate = median count rate of data. |
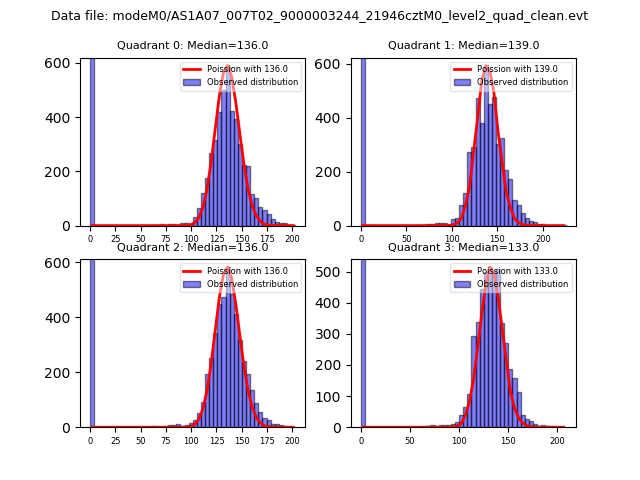 |
 |
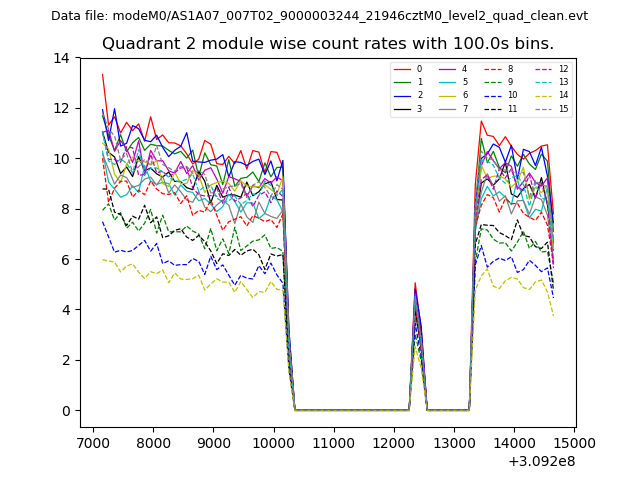
| Quadrant-wise count rates Data is divided into 100 sec bins |
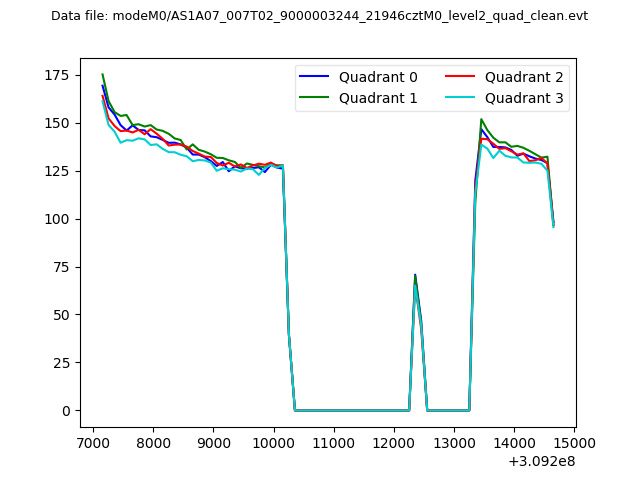 |
|
| Module-wise count rates for Quadrant A Data is divided into 100 sec bins |
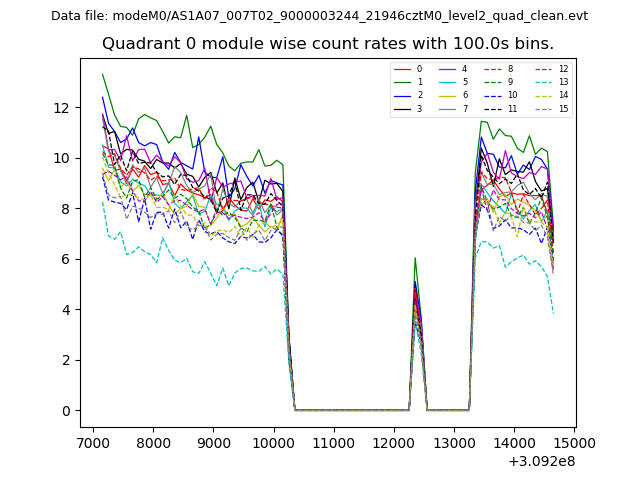 |
 |
| Module-wise count rates for Quadrant B Data is divided into 100 sec bins |
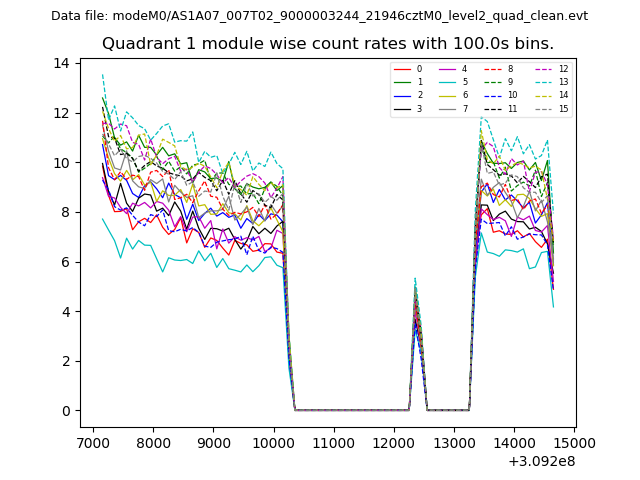 |
 |
| Module-wise count rates for Quadrant C Data is divided into 100 sec bins |
 |
 |
| Module-wise count rates for Quadrant D Data is divided into 100 sec bins |
 |
 |
| Parameter | Plot |
|---|---|
| CZT HV Monitor | 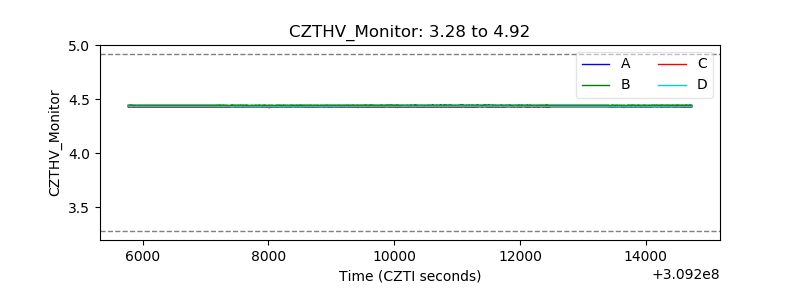 |
| D_VDD | 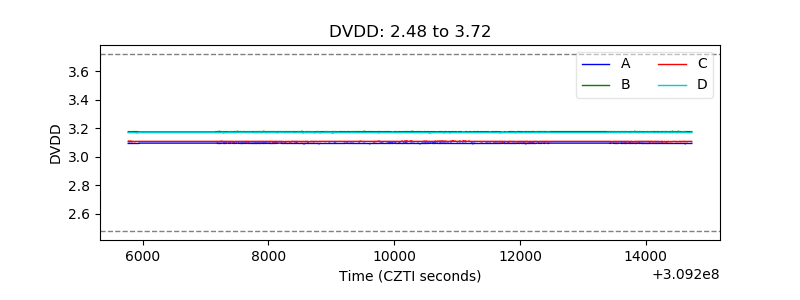 |
| Temperature 1 | 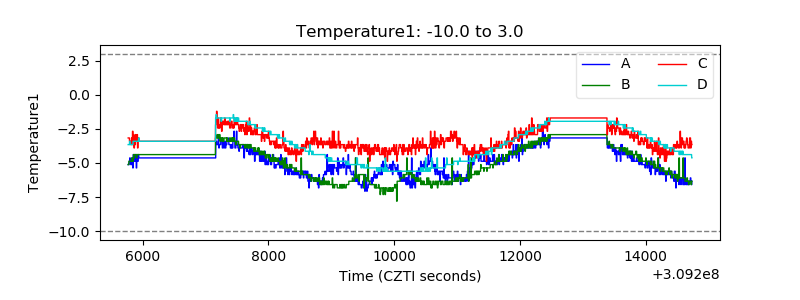 |
| Veto HV Monitor | 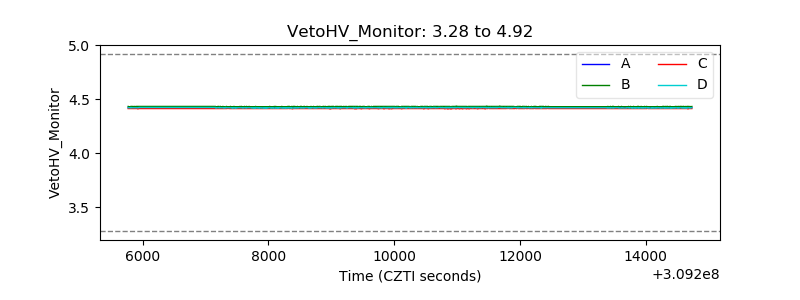 |
| Veto LLD | 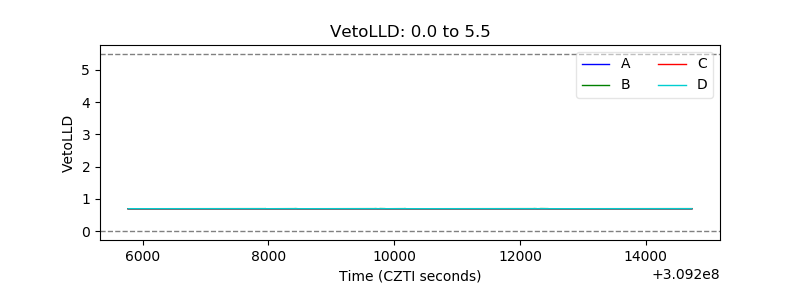 |
| Alpha Counter | 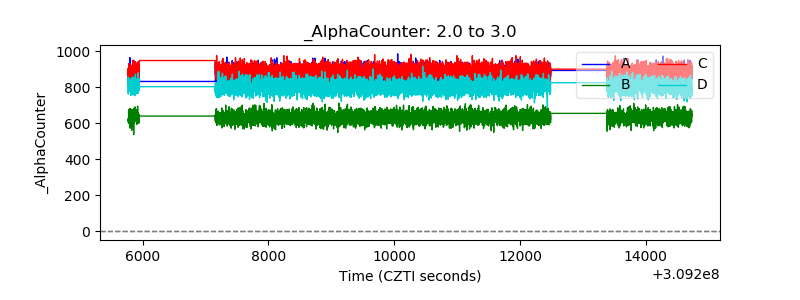 |
| _CPM_Rate | 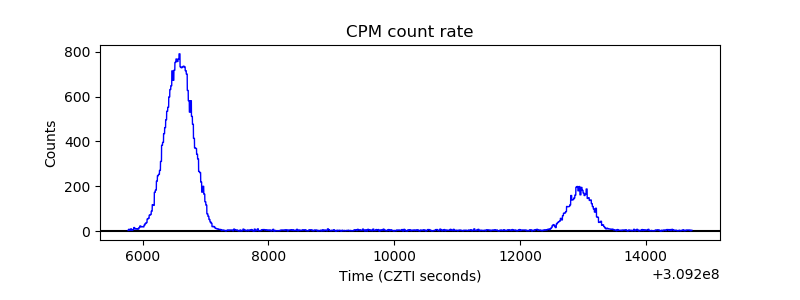 |
| CZT Counter |  |
| +2.5 Volts monitor |  |
| +5 Volts monitor | 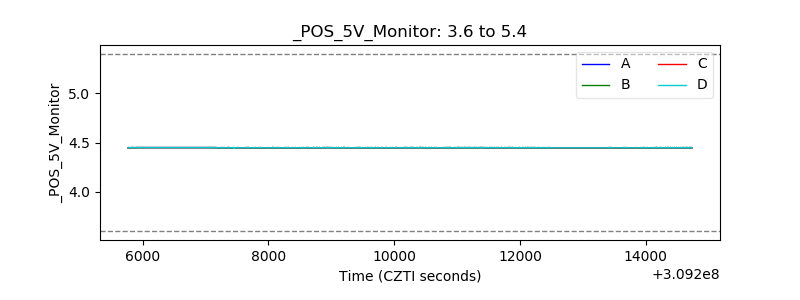 |
| _ROLL_ROT | 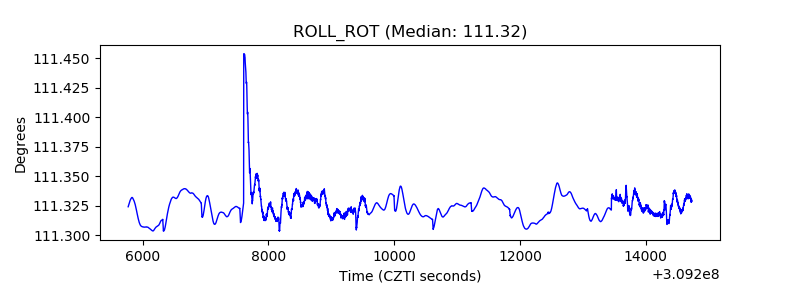 |
| _Roll_DEC | 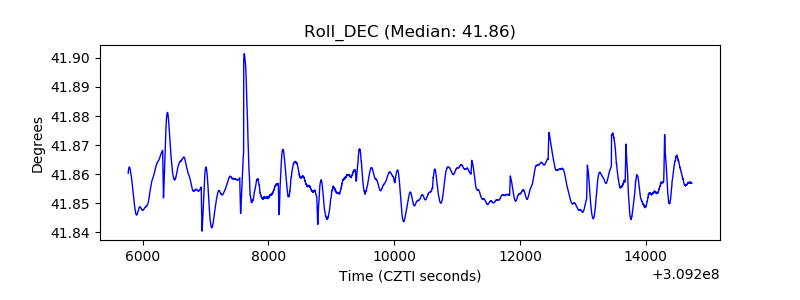 |
| _Roll_RA | 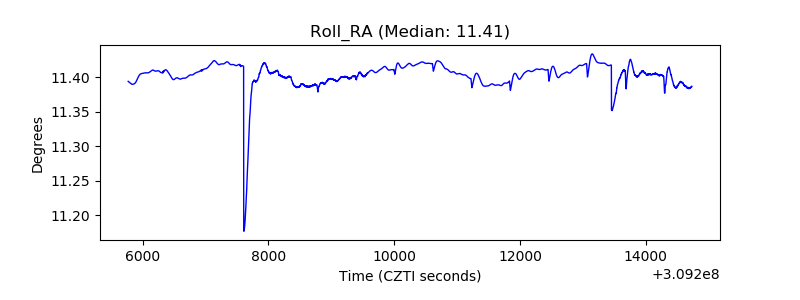 |
| Veto Counter | 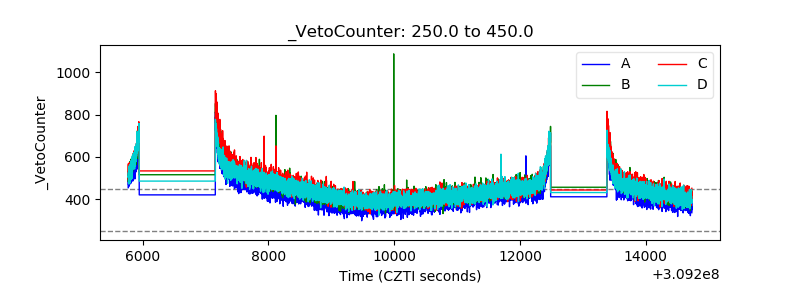 |