| Param | Original file | Final file |
|---|---|---|
| Filename | modeM0/AS1A07_007T02_9000003244_21947cztM0_level2.evt | modeM0/AS1A07_007T02_9000003244_21947cztM0_level2_quad_clean.evt |
| Size (bytes) | 528,831,360 | 109,624,320 |
| Size | 504.3 MB | 104.5 MB |
| Events in quadrant A | 3,763,571 | 699,296 |
| Events in quadrant B | 3,984,522 | 707,397 |
| Events in quadrant C | 3,862,890 | 690,805 |
| Events in quadrant D | 3,873,251 | 678,479 |
| Mode M0 | |||
|---|---|---|---|
| Quadrant | BADHDUFLAG | Total packets | Discarded packets |
| A | 0 | 16378 | 2 |
| B | 0 | 16913 | 2 |
| C | 0 | 16454 | 2 |
| D | 0 | 16903 | 2 |
| Mode M9 | |||
|---|---|---|---|
| Quadrant | BADHDUFLAG | Total packets | Discarded packets |
| A | 0 | 12 | 0 |
| B | 0 | 12 | 0 |
| C | 0 | 12 | 0 |
| D | 0 | 12 | 0 |
| Mode SS | |||
|---|---|---|---|
| Quadrant | BADHDUFLAG | Total packets | Discarded packets |
| A | 0 | 162 | 0 |
| B | 0 | 162 | 0 |
| C | 0 | 162 | 0 |
| D | 0 | 162 | 0 |
| Quadrant | Total seconds | Saturated seconds | Saturation percentage |
|---|---|---|---|
| A | 7819 | 62 | 0.792940% |
| B | 7819 | 138 | 1.764932% |
| C | 7820 | 140 | 1.790281% |
| D | 7820 | 80 | 1.023018% |
Noise dominated data is calculated using 1-second bins in cleaned event files. If a bin has >2000 counts, and if more than 50% of those come from <1% of pixels, then it is considered to be noise-dominated and hence unusable.
| Quadrant | # 1 sec bins | Bins with >0 counts | Bins with >2000 counts | High rate bins dominated by noise | Noise dominated (total time) | Noise dominated (detector-on time) | Marked lightcurve |
|---|---|---|---|---|---|---|---|
| A | 9104 | 7820 | 0 | 0 | 0.00% | 0.00% | 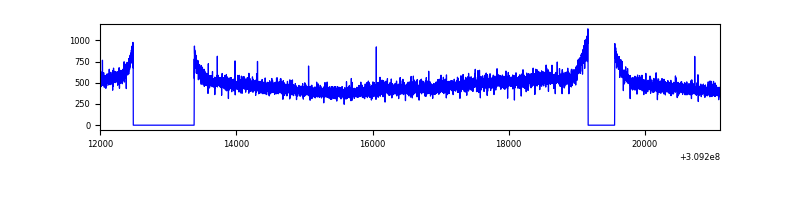 |
| B | 9104 | 7820 | 19 | 19 | 0.21% | 0.24% | 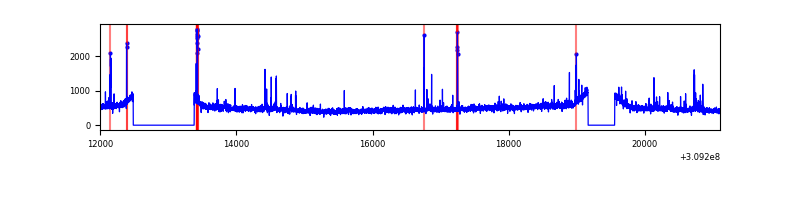 |
| C | 9105 | 7821 | 0 | 0 | 0.00% | 0.00% | 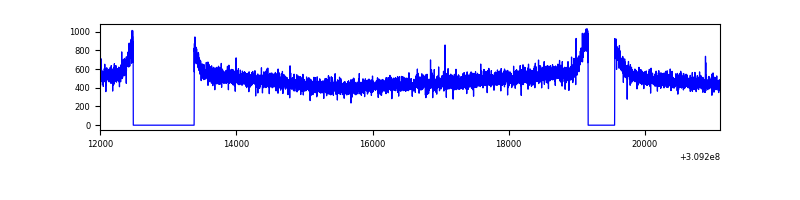 |
| D | 9105 | 7822 | 38 | 38 | 0.42% | 0.49% | 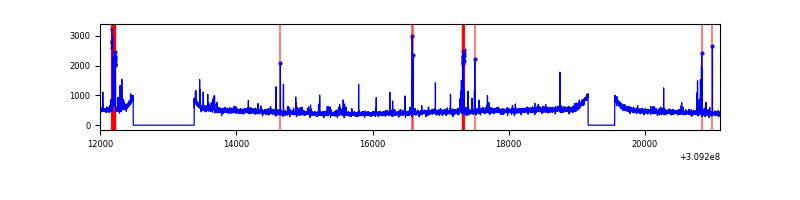 |
Top three noisy pixels from each quadrant. If the there are fewer than three noisy pixels in the level2.evt file, extra rows are filled as -1
| Pixel properties | Quadrant properties | ||||||
|---|---|---|---|---|---|---|---|
| Quadrant | DetID | PixID | Counts | Sigma | Mean | Median | Sigma |
| A | 13 | 254 | 13090 | 62.05 | 974 | 954 | 195.6 |
| A | 3 | 137 | 8577 | 38.97 | 974 | 954 | 195.6 |
| A | 0 | 226 | 8236 | 37.23 | 974 | 954 | 195.6 |
| B | 3 | 64 | 137308 | 737.46 | 965 | 939 | 184.9 |
| B | 0 | 230 | 30080 | 157.59 | 965 | 939 | 184.9 |
| B | 12 | 111 | 22489 | 116.54 | 965 | 939 | 184.9 |
| C | 14 | 238 | 148601 | 661.38 | 948 | 953 | 223.2 |
| C | 9 | 54 | 10315 | 41.94 | 948 | 953 | 223.2 |
| C | 13 | 61 | 6498 | 24.84 | 948 | 953 | 223.2 |
| D | 11 | 176 | 125805 | 536.25 | 955 | 927 | 232.9 |
| D | 13 | 104 | 77785 | 330.04 | 955 | 927 | 232.9 |
| D | 1 | 52 | 44776 | 188.3 | 955 | 927 | 232.9 |
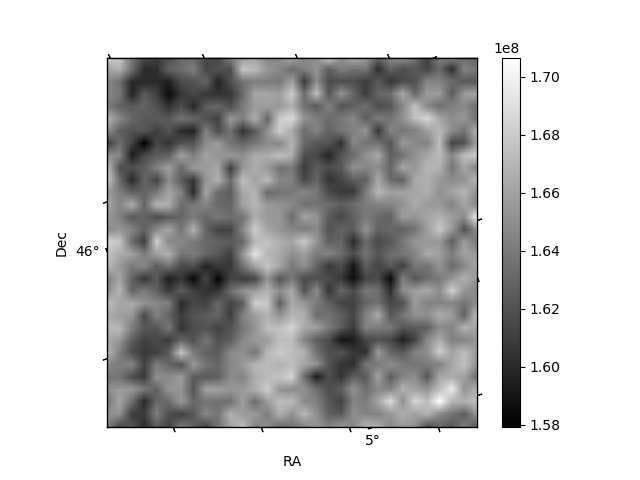
Histogram calculated using DETX and DETY for each event in the final _common_clean file
| Quadrant A | 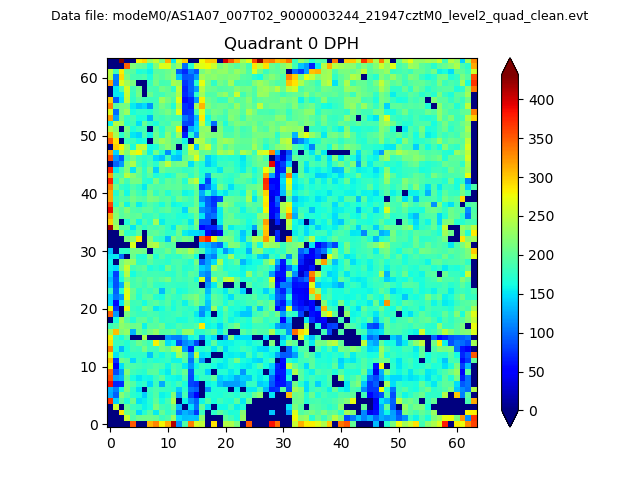 |
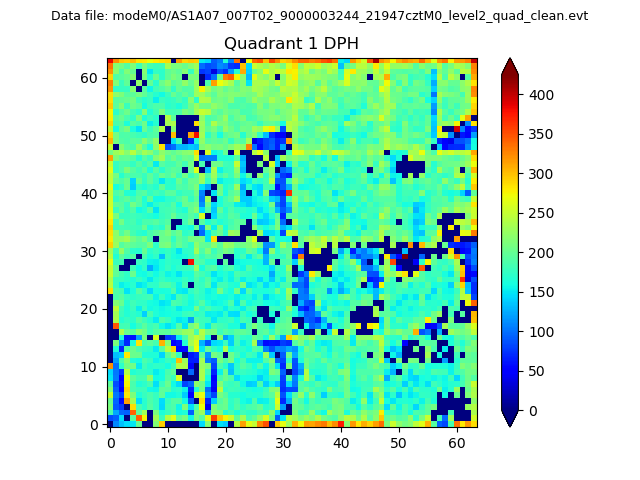 |
Quadrant B |
|---|---|---|---|
| Quadrant D | 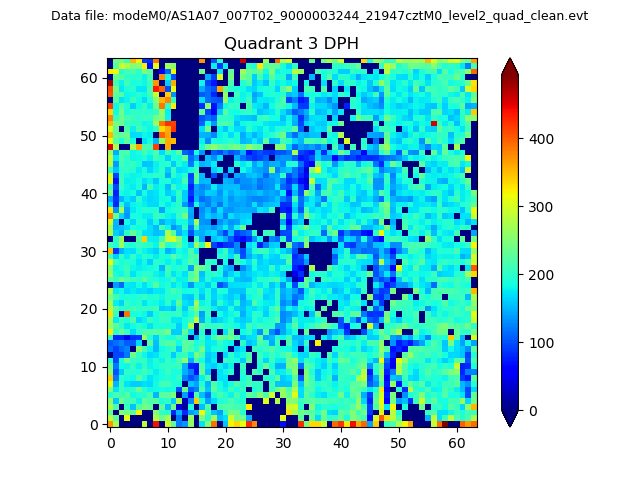 |
 |
Quadrant C |
| Plot type | Count rate plots | Images |
|---|---|---|
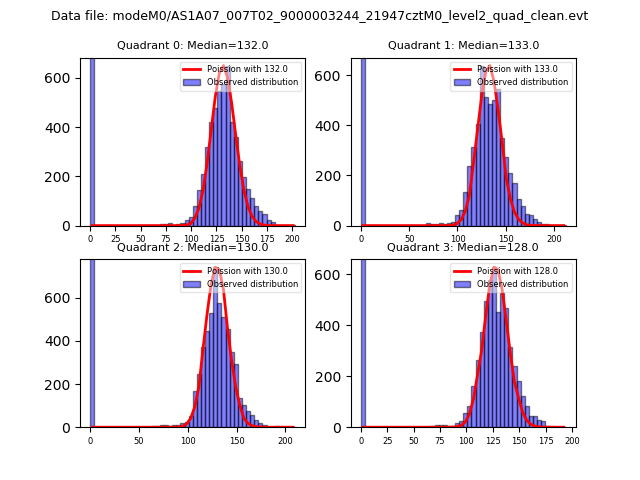
| Comparison with Poisson distribution Blue bars denote a histogram of data divided into 1 sec bins. Red curve is a Poisson curve with rate = median count rate of data. |
 |
 |
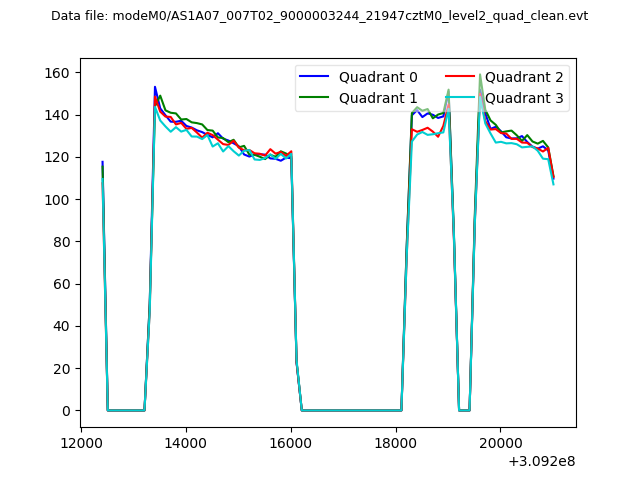
| Quadrant-wise count rates Data is divided into 100 sec bins |
 |
|
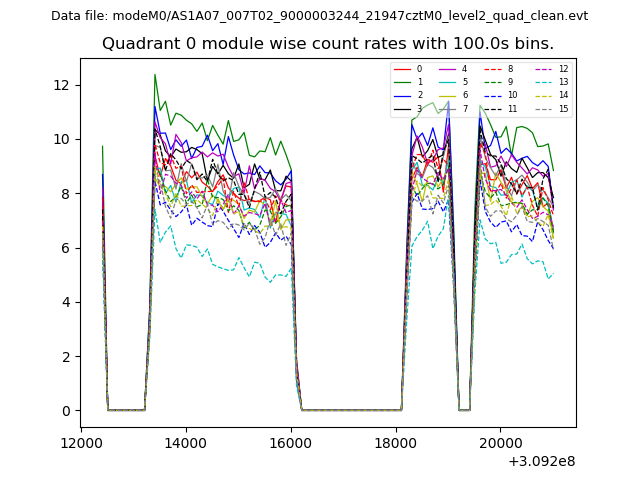
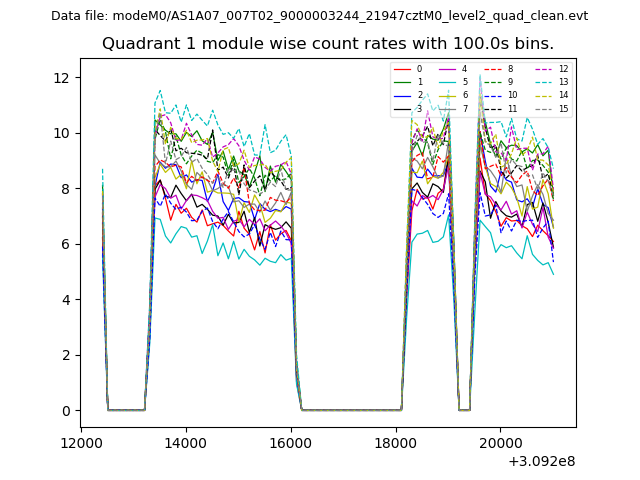
| Module-wise count rates for Quadrant A Data is divided into 100 sec bins |
 |
 |
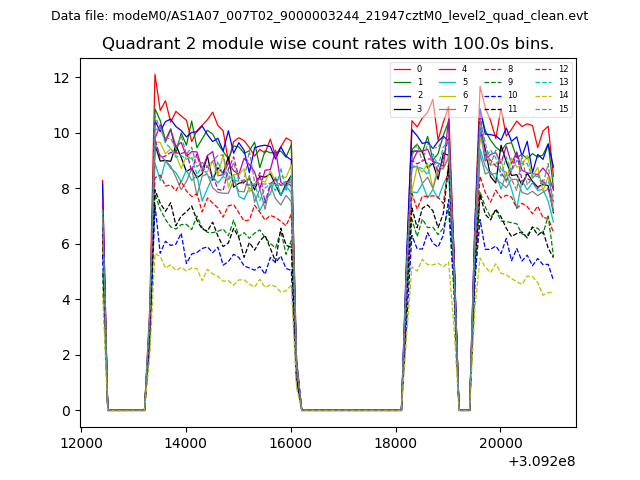
| Module-wise count rates for Quadrant B Data is divided into 100 sec bins |
 |
 |
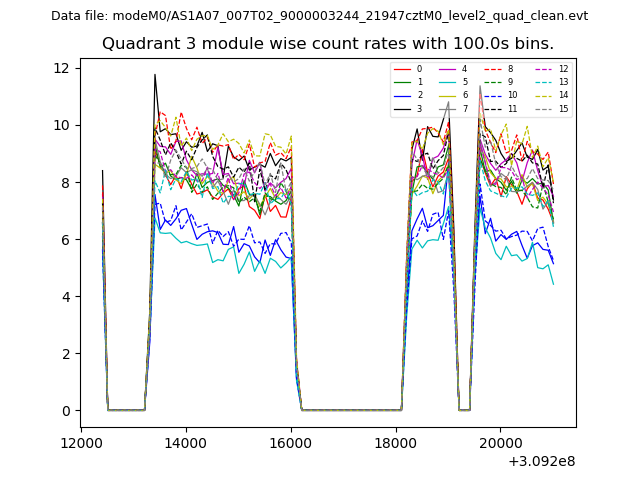
| Module-wise count rates for Quadrant C Data is divided into 100 sec bins |
 |
 |
| Module-wise count rates for Quadrant D Data is divided into 100 sec bins |
 |
 |
| Parameter | Plot |
|---|---|
| CZT HV Monitor | 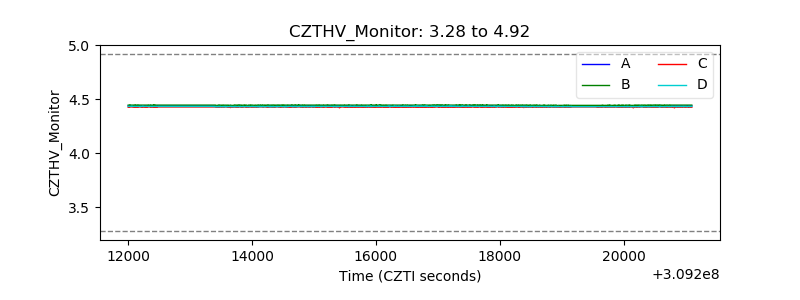 |
| D_VDD | 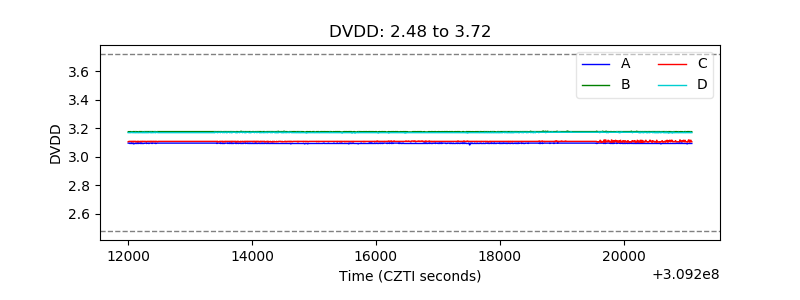 |
| Temperature 1 | 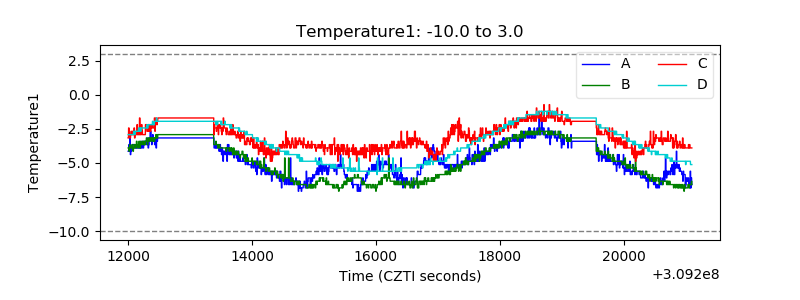 |
| Veto HV Monitor | 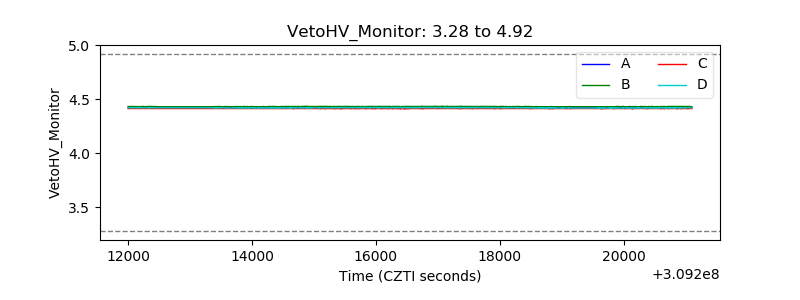 |
| Veto LLD | 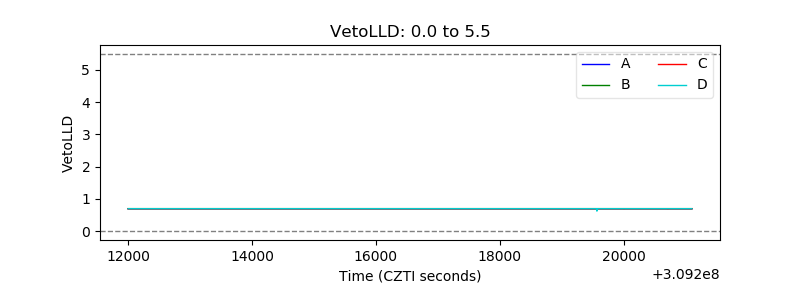 |
| Alpha Counter | 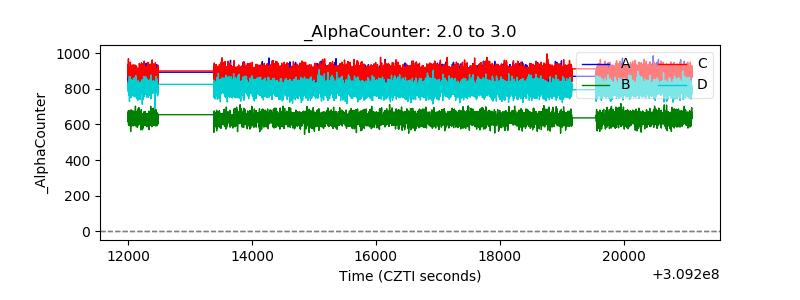 |
| _CPM_Rate | 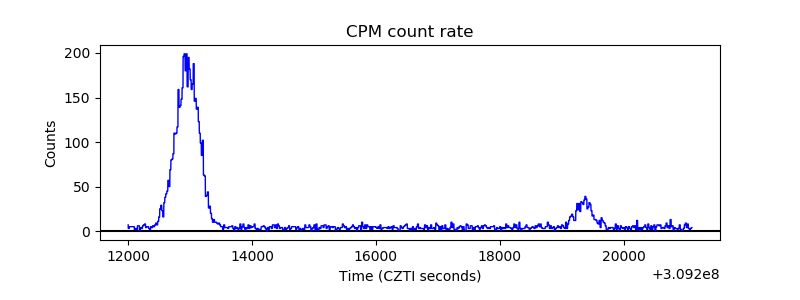 |
| CZT Counter |  |
| +2.5 Volts monitor |  |
| +5 Volts monitor | 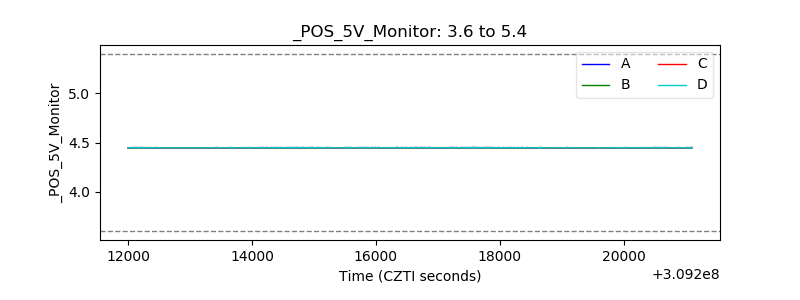 |
| _ROLL_ROT |  |
| _Roll_DEC | 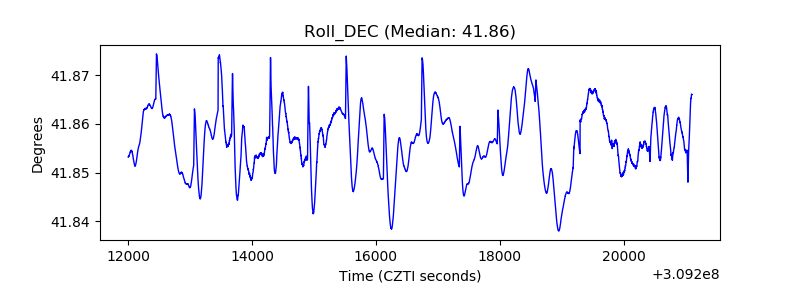 |
| _Roll_RA | 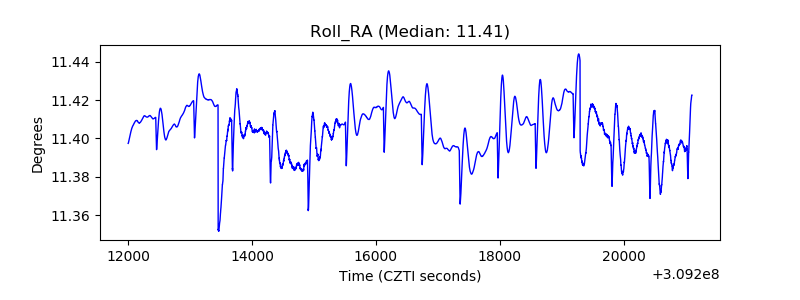 |
| Veto Counter | 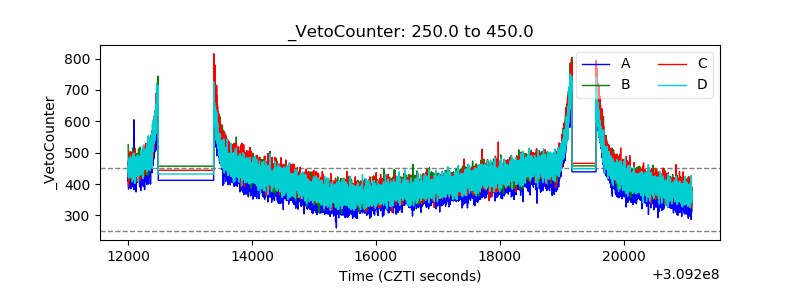 |