| Param | Original file | Final file |
|---|---|---|
| Filename | modeM0/AS1A07_007T02_9000003244_21949cztM0_level2.evt | modeM0/AS1A07_007T02_9000003244_21949cztM0_level2_quad_clean.evt |
| Size (bytes) | 582,955,200 | 125,853,120 |
| Size | 555.9 MB | 120.0 MB |
| Events in quadrant A | 3,984,391 | 813,404 |
| Events in quadrant B | 4,213,600 | 827,564 |
| Events in quadrant C | 4,097,187 | 806,177 |
| Events in quadrant D | 4,778,853 | 770,093 |
| Mode M0 | |||
|---|---|---|---|
| Quadrant | BADHDUFLAG | Total packets | Discarded packets |
| A | 0 | 17598 | 2 |
| B | 0 | 18158 | 2 |
| C | 0 | 17786 | 2 |
| D | 0 | 20111 | 2 |
| Mode M9 | |||
|---|---|---|---|
| Quadrant | BADHDUFLAG | Total packets | Discarded packets |
| A | 0 | 6 | 0 |
| B | 0 | 6 | 0 |
| C | 0 | 6 | 0 |
| D | 0 | 6 | 0 |
| Mode SS | |||
|---|---|---|---|
| Quadrant | BADHDUFLAG | Total packets | Discarded packets |
| A | 0 | 178 | 0 |
| B | 0 | 178 | 0 |
| C | 0 | 178 | 0 |
| D | 0 | 178 | 0 |
| Quadrant | Total seconds | Saturated seconds | Saturation percentage |
|---|---|---|---|
| A | 8557 | 31 | 0.362276% |
| B | 8558 | 68 | 0.794578% |
| C | 8557 | 99 | 1.156948% |
| D | 8557 | 261 | 3.050134% |
Noise dominated data is calculated using 1-second bins in cleaned event files. If a bin has >2000 counts, and if more than 50% of those come from <1% of pixels, then it is considered to be noise-dominated and hence unusable.
| Quadrant | # 1 sec bins | Bins with >0 counts | Bins with >2000 counts | High rate bins dominated by noise | Noise dominated (total time) | Noise dominated (detector-on time) | Marked lightcurve |
|---|---|---|---|---|---|---|---|
| A | 9112 | 8560 | 0 | 0 | 0.00% | 0.00% | 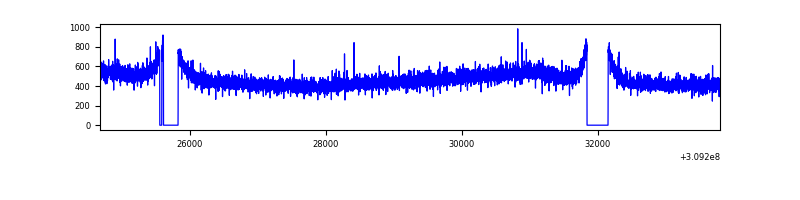 |
| B | 9113 | 8561 | 10 | 10 | 0.11% | 0.12% | 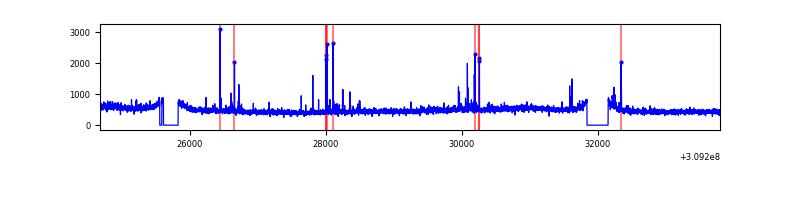 |
| C | 9112 | 8560 | 0 | 0 | 0.00% | 0.00% | 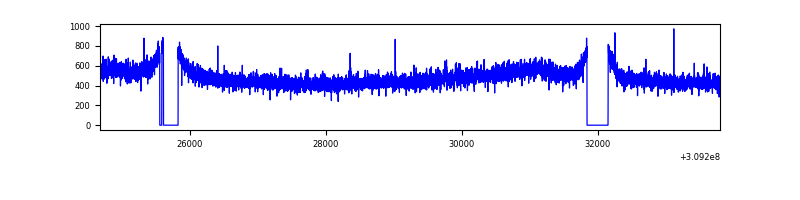 |
| D | 9112 | 8560 | 238 | 238 | 2.61% | 2.78% | 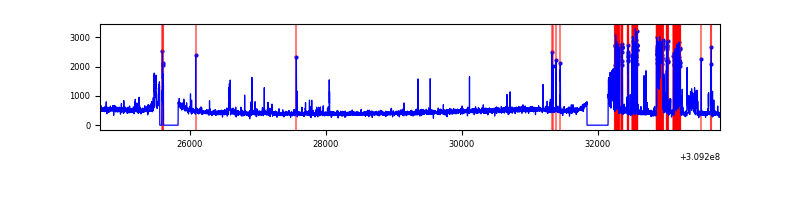 |
Top three noisy pixels from each quadrant. If the there are fewer than three noisy pixels in the level2.evt file, extra rows are filled as -1
| Pixel properties | Quadrant properties | ||||||
|---|---|---|---|---|---|---|---|
| Quadrant | DetID | PixID | Counts | Sigma | Mean | Median | Sigma |
| A | 13 | 254 | 14564 | 65.21 | 1032 | 1007 | 207.9 |
| A | 3 | 137 | 9212 | 39.46 | 1032 | 1007 | 207.9 |
| A | 0 | 226 | 8669 | 36.85 | 1032 | 1007 | 207.9 |
| B | 3 | 64 | 78151 | 389.36 | 1033 | 1003 | 198.1 |
| B | 0 | 230 | 45148 | 222.8 | 1033 | 1003 | 198.1 |
| B | 12 | 111 | 24591 | 119.05 | 1033 | 1003 | 198.1 |
| C | 14 | 238 | 157376 | 655.85 | 1008 | 1014 | 238.4 |
| C | 9 | 54 | 10235 | 38.68 | 1008 | 1014 | 238.4 |
| C | 13 | 61 | 6999 | 25.1 | 1008 | 1014 | 238.4 |
| D | 13 | 174 | 740187 | 3056.14 | 1001 | 972 | 241.9 |
| D | 1 | 52 | 159260 | 654.41 | 1001 | 972 | 241.9 |
| D | 2 | 136 | 47403 | 191.96 | 1001 | 972 | 241.9 |
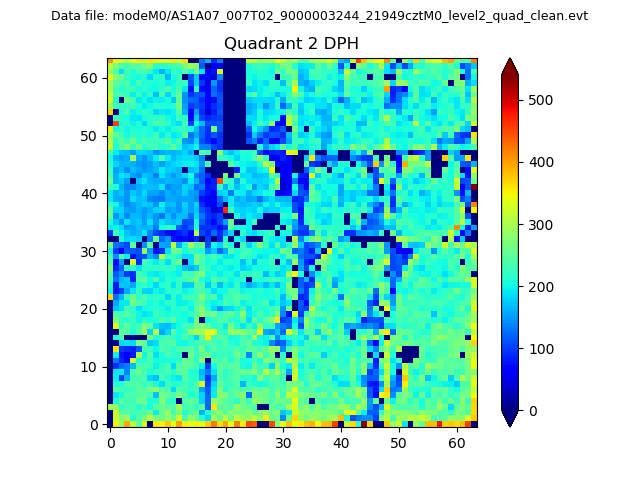
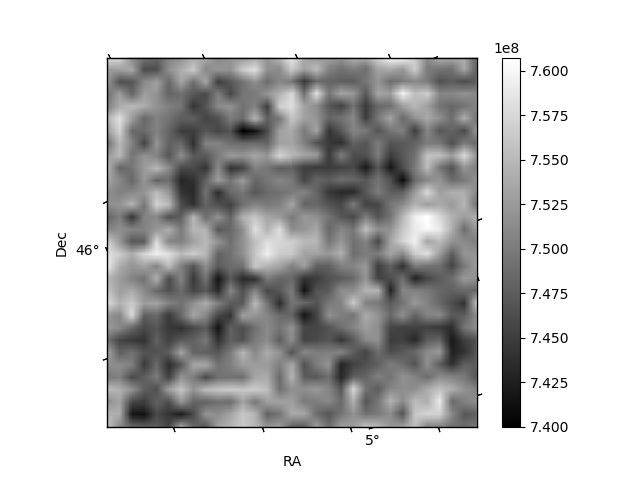
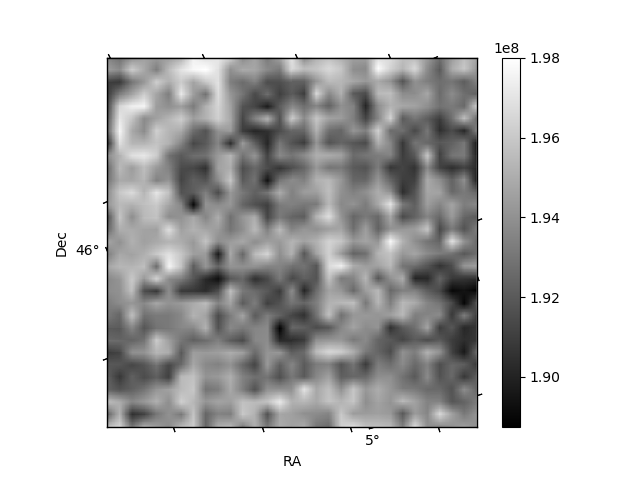
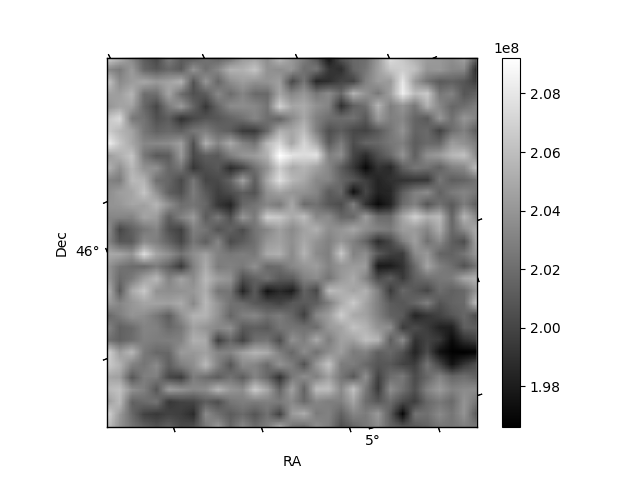
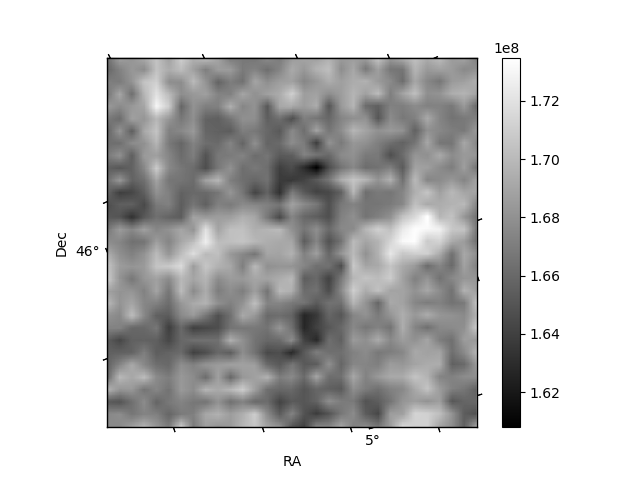
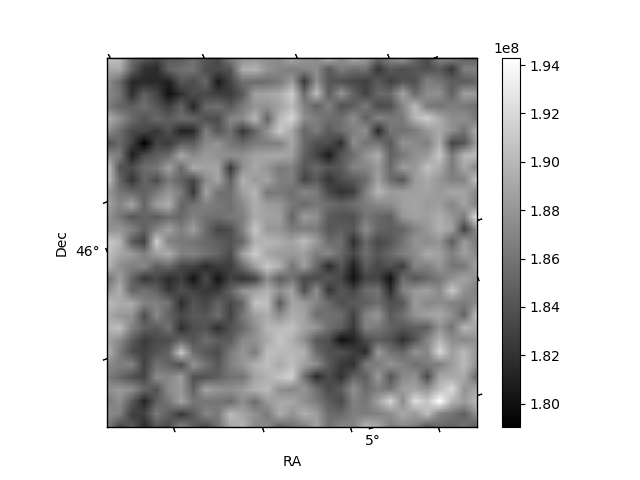
Histogram calculated using DETX and DETY for each event in the final _common_clean file
| Quadrant A | 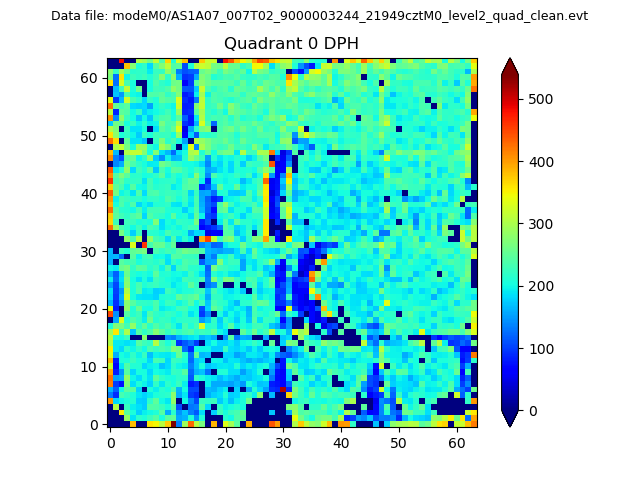 |
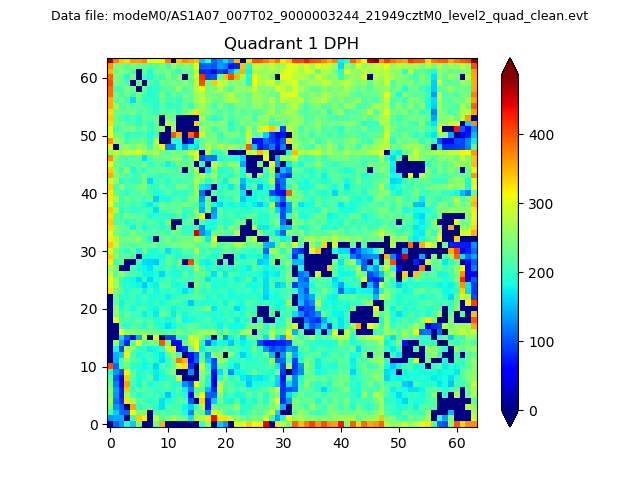 |
Quadrant B |
|---|---|---|---|
| Quadrant D | 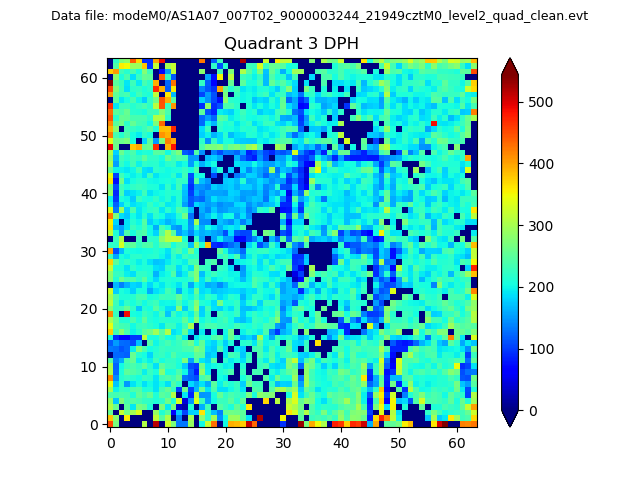 |
 |
Quadrant C |
| Plot type | Count rate plots | Images |
|---|---|---|
| Comparison with Poisson distribution Blue bars denote a histogram of data divided into 1 sec bins. Red curve is a Poisson curve with rate = median count rate of data. |
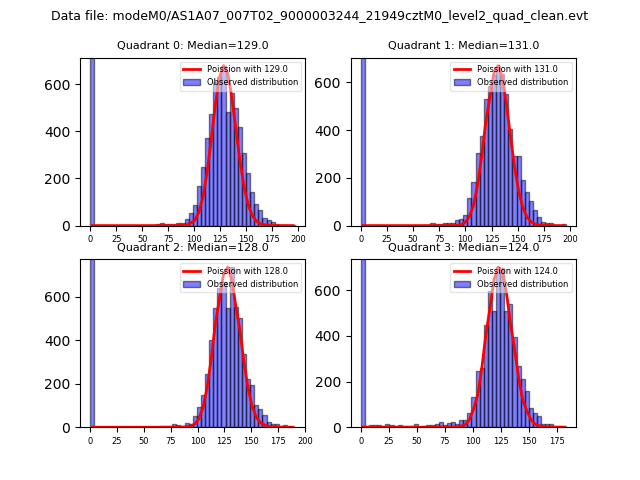 |
 |
| Quadrant-wise count rates Data is divided into 100 sec bins |
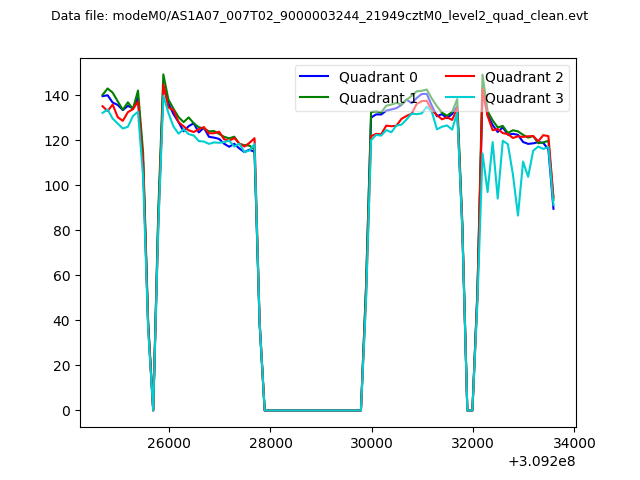 |
|
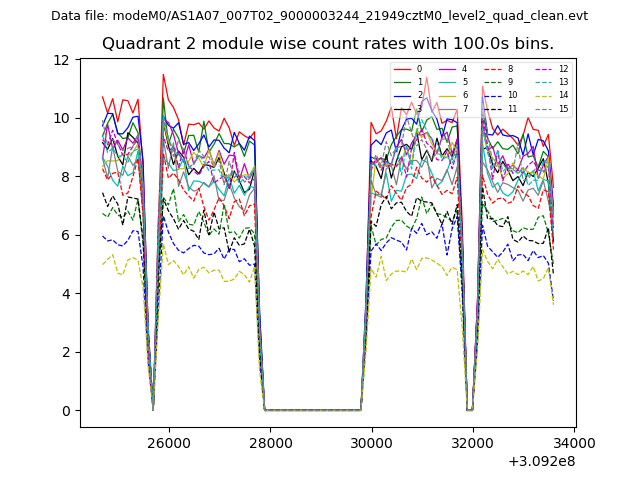
| Module-wise count rates for Quadrant A Data is divided into 100 sec bins |
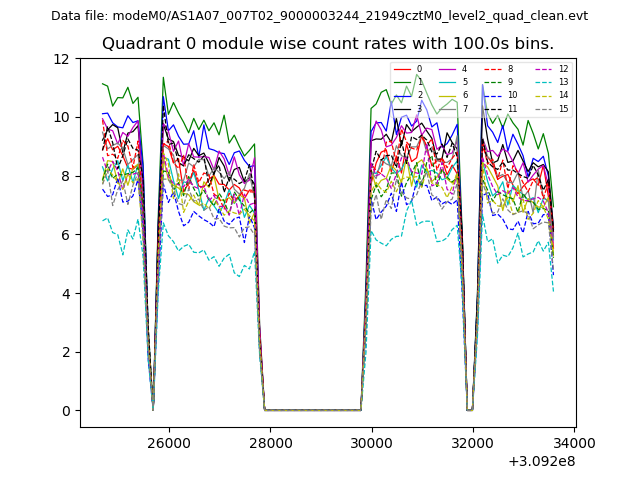 |
 |
| Module-wise count rates for Quadrant B Data is divided into 100 sec bins |
 |
 |
| Module-wise count rates for Quadrant C Data is divided into 100 sec bins |
 |
 |
| Module-wise count rates for Quadrant D Data is divided into 100 sec bins |
 |
 |
| Parameter | Plot |
|---|---|
| CZT HV Monitor |  |
| D_VDD | 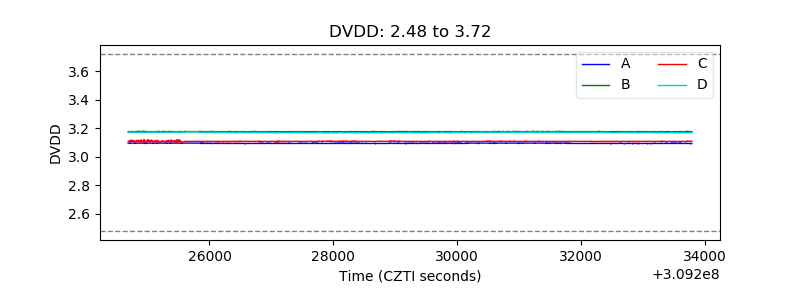 |
| Temperature 1 | 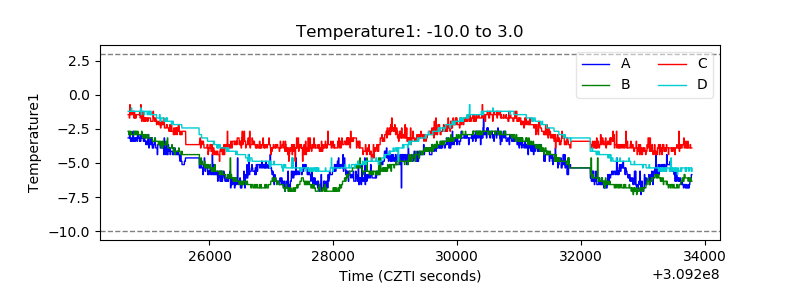 |
| Veto HV Monitor | 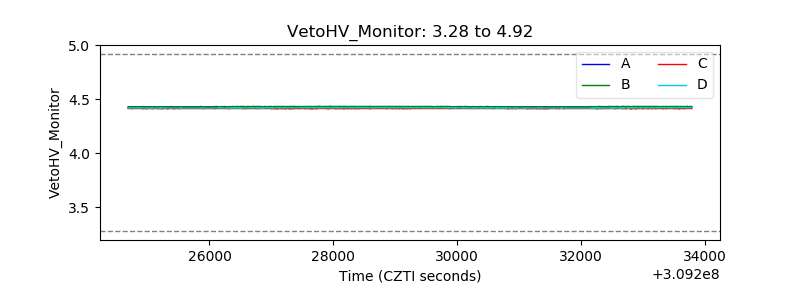 |
| Veto LLD | 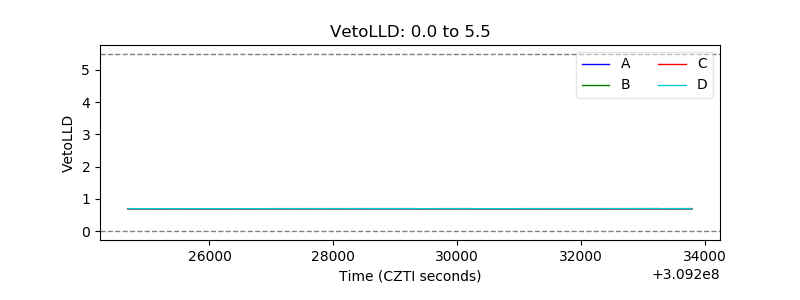 |
| Alpha Counter |  |
| _CPM_Rate | 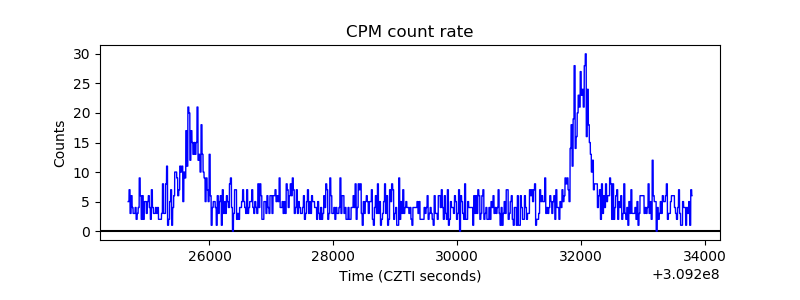 |
| CZT Counter | 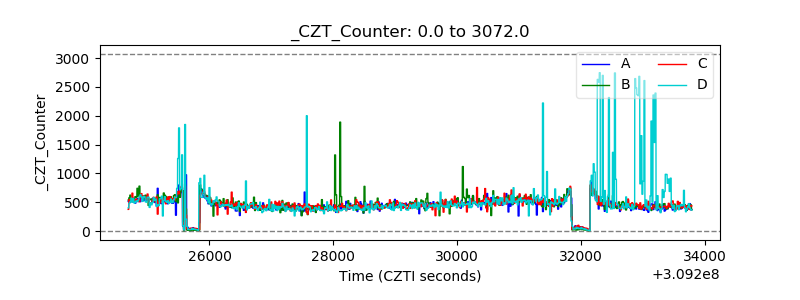 |
| +2.5 Volts monitor |  |
| +5 Volts monitor |  |
| _ROLL_ROT | 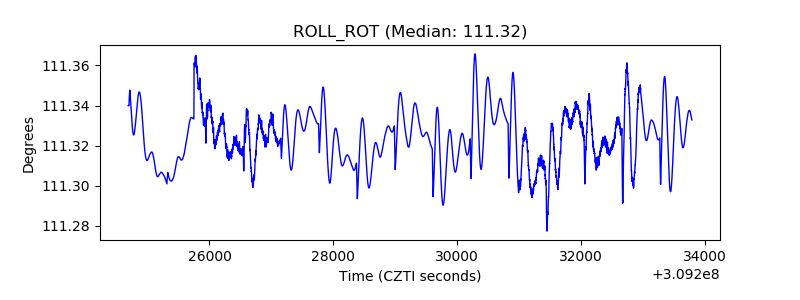 |
| _Roll_DEC | 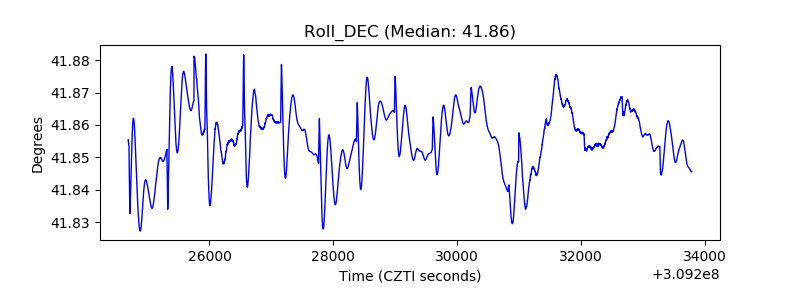 |
| _Roll_RA | 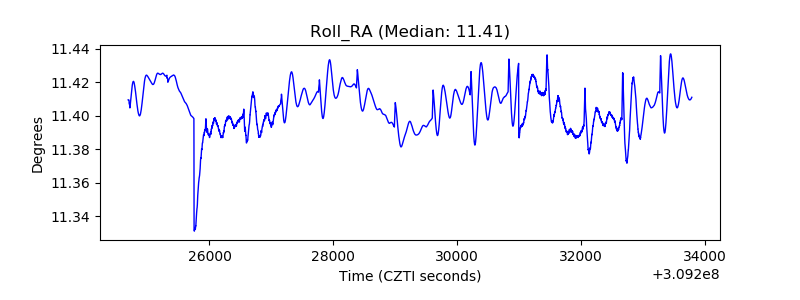 |
| Veto Counter | 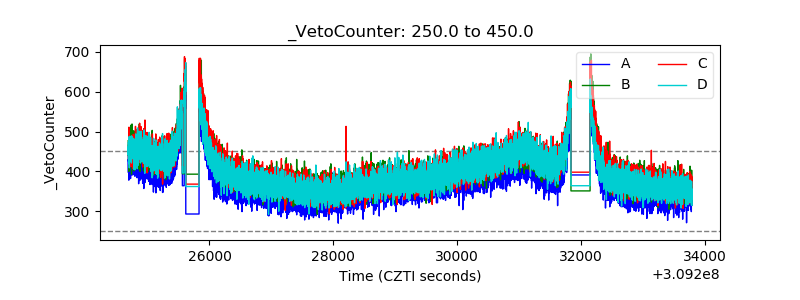 |