| Param | Original file | Final file |
|---|---|---|
| Filename | modeM0/AS1A07_007T02_9000003244_21951cztM0_level2.evt | modeM0/AS1A07_007T02_9000003244_21951cztM0_level2_quad_clean.evt |
| Size (bytes) | 855,714,240 | 158,964,480 |
| Size | 816.1 MB | 151.6 MB |
| Events in quadrant A | 5,905,040 | 991,455 |
| Events in quadrant B | 6,243,591 | 1,005,590 |
| Events in quadrant C | 6,020,309 | 982,533 |
| Events in quadrant D | 6,873,101 | 943,708 |
| Mode M0 | |||
|---|---|---|---|
| Quadrant | BADHDUFLAG | Total packets | Discarded packets |
| A | 0 | 26133 | 3 |
| B | 0 | 26859 | 3 |
| C | 0 | 26274 | 3 |
| D | 0 | 29450 | 3 |
| Mode M9 | |||
|---|---|---|---|
| Quadrant | BADHDUFLAG | Total packets | Discarded packets |
| A | 0 | 15 | 0 |
| B | 0 | 15 | 0 |
| C | 0 | 15 | 0 |
| D | 0 | 15 | 0 |
| Mode SS | |||
|---|---|---|---|
| Quadrant | BADHDUFLAG | Total packets | Discarded packets |
| A | 0 | 264 | 0 |
| B | 0 | 264 | 0 |
| C | 0 | 264 | 0 |
| D | 0 | 264 | 0 |
| Quadrant | Total seconds | Saturated seconds | Saturation percentage |
|---|---|---|---|
| A | 12890 | 78 | 0.605120% |
| B | 12890 | 154 | 1.194725% |
| C | 12889 | 124 | 0.962061% |
| D | 12890 | 342 | 2.653220% |
Noise dominated data is calculated using 1-second bins in cleaned event files. If a bin has >2000 counts, and if more than 50% of those come from <1% of pixels, then it is considered to be noise-dominated and hence unusable.
| Quadrant | # 1 sec bins | Bins with >0 counts | Bins with >2000 counts | High rate bins dominated by noise | Noise dominated (total time) | Noise dominated (detector-on time) | Marked lightcurve |
|---|---|---|---|---|---|---|---|
| A | 14100 | 12890 | 0 | 0 | 0.00% | 0.00% | 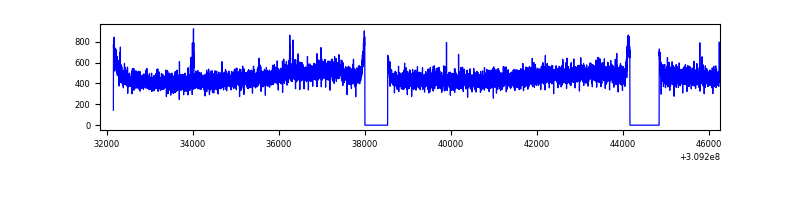 |
| B | 14100 | 12890 | 35 | 35 | 0.25% | 0.27% | 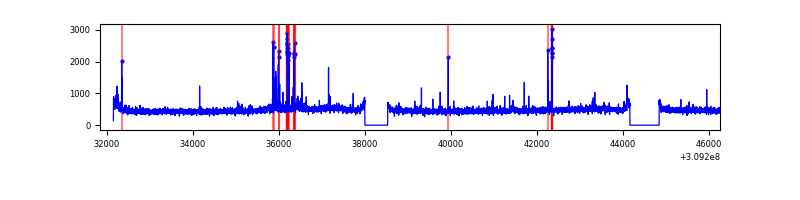 |
| C | 14099 | 12889 | 0 | 0 | 0.00% | 0.00% | 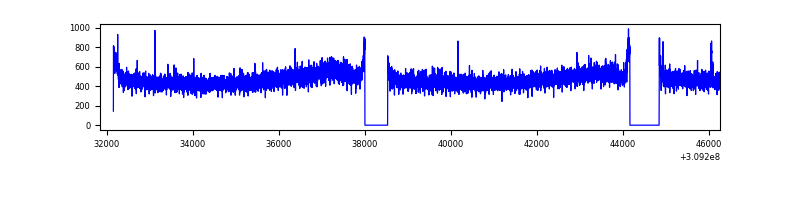 |
| D | 14410 | 12892 | 297 | 297 | 2.06% | 2.30% | 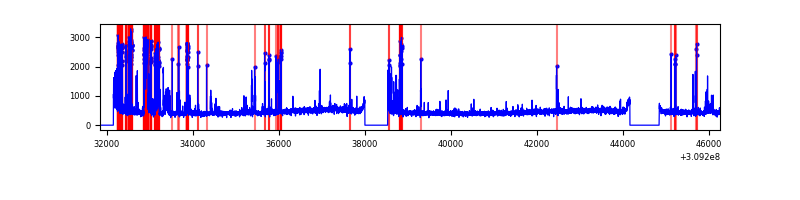 |
Top three noisy pixels from each quadrant. If the there are fewer than three noisy pixels in the level2.evt file, extra rows are filled as -1
| Pixel properties | Quadrant properties | ||||||
|---|---|---|---|---|---|---|---|
| Quadrant | DetID | PixID | Counts | Sigma | Mean | Median | Sigma |
| A | 13 | 254 | 20573 | 62.37 | 1528 | 1493 | 305.9 |
| A | 3 | 137 | 13404 | 38.94 | 1528 | 1493 | 305.9 |
| A | 0 | 226 | 12798 | 36.96 | 1528 | 1493 | 305.9 |
| B | 3 | 64 | 168492 | 577.69 | 1526 | 1484 | 289.1 |
| B | 12 | 111 | 36486 | 121.07 | 1526 | 1484 | 289.1 |
| B | 11 | 111 | 32588 | 107.59 | 1526 | 1484 | 289.1 |
| C | 14 | 238 | 232424 | 666.66 | 1483 | 1492 | 346.4 |
| C | 13 | 61 | 10365 | 25.61 | 1483 | 1492 | 346.4 |
| C | 9 | 54 | 8745 | 20.94 | 1483 | 1492 | 346.4 |
| D | 13 | 174 | 798323 | 2208.69 | 1481 | 1433 | 360.8 |
| D | 1 | 52 | 274157 | 755.89 | 1481 | 1433 | 360.8 |
| D | 2 | 136 | 92053 | 251.17 | 1481 | 1433 | 360.8 |
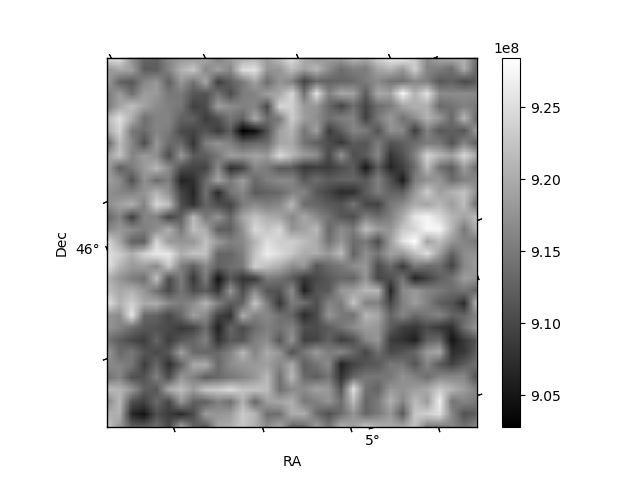
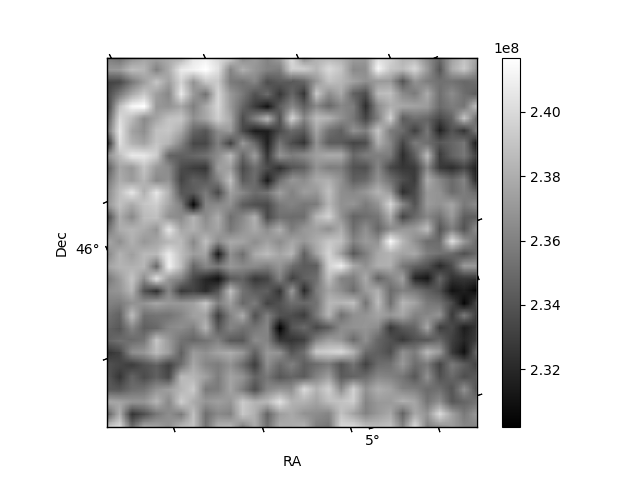
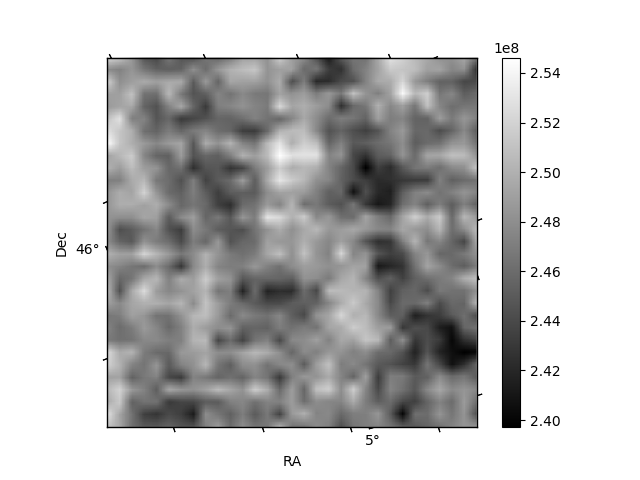
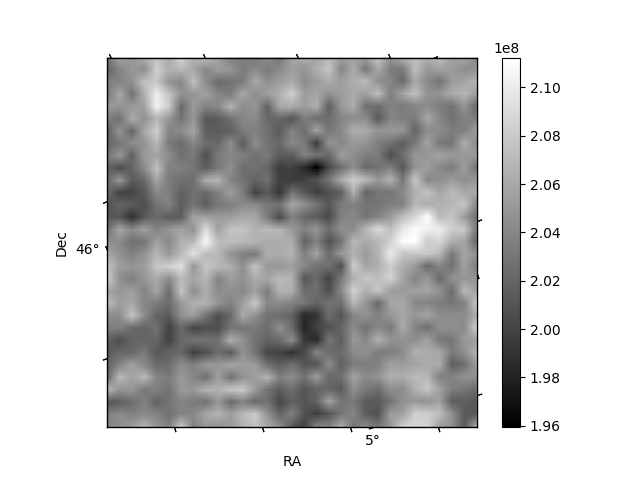
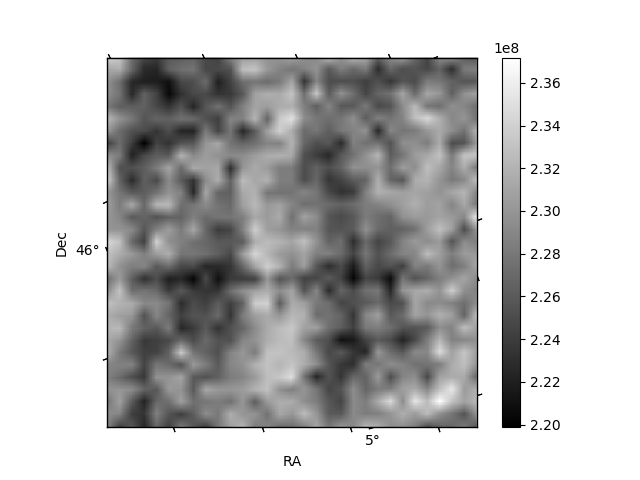
Histogram calculated using DETX and DETY for each event in the final _common_clean file
| Quadrant A | 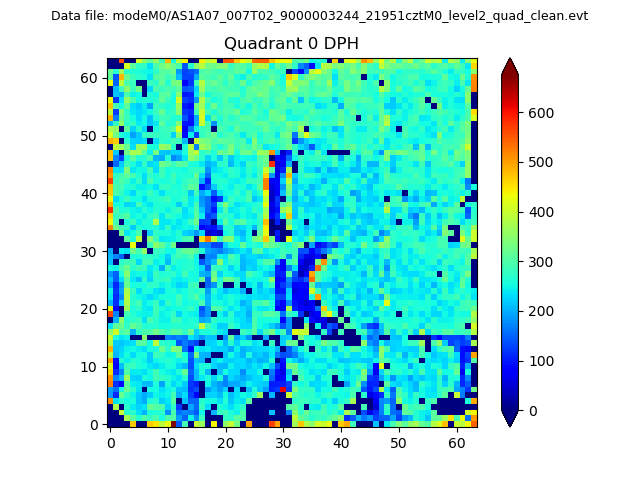 |
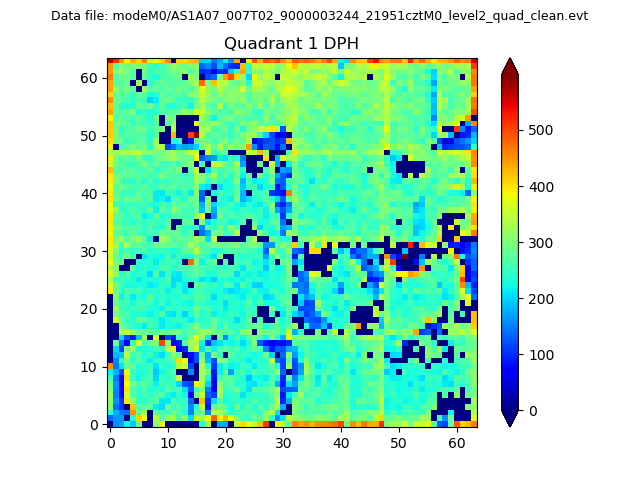 |
Quadrant B |
|---|---|---|---|
| Quadrant D |  |
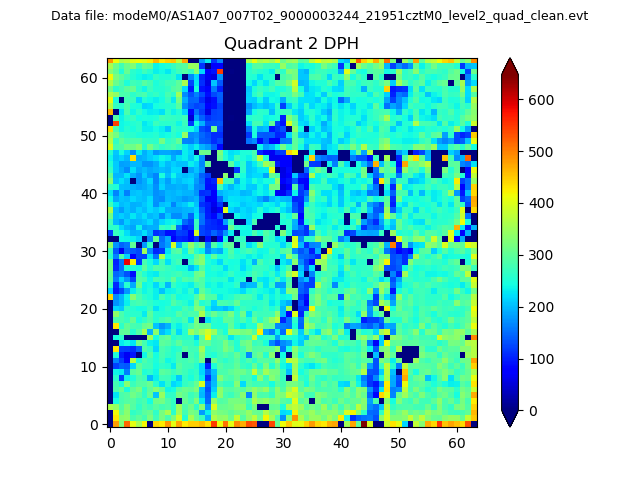 |
Quadrant C |
| Plot type | Count rate plots | Images |
|---|---|---|
| Comparison with Poisson distribution Blue bars denote a histogram of data divided into 1 sec bins. Red curve is a Poisson curve with rate = median count rate of data. |
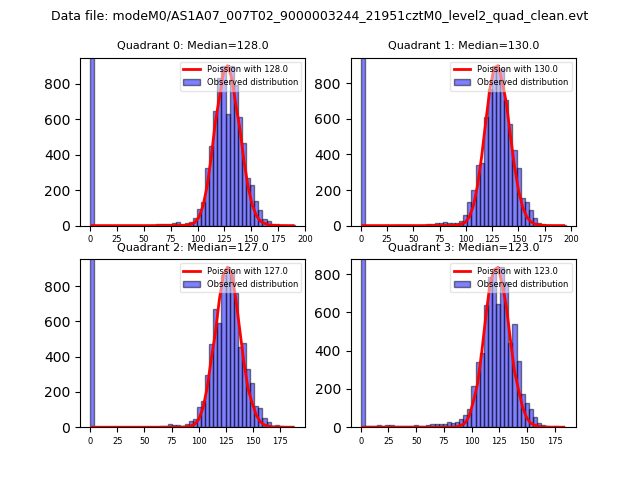 |
 |
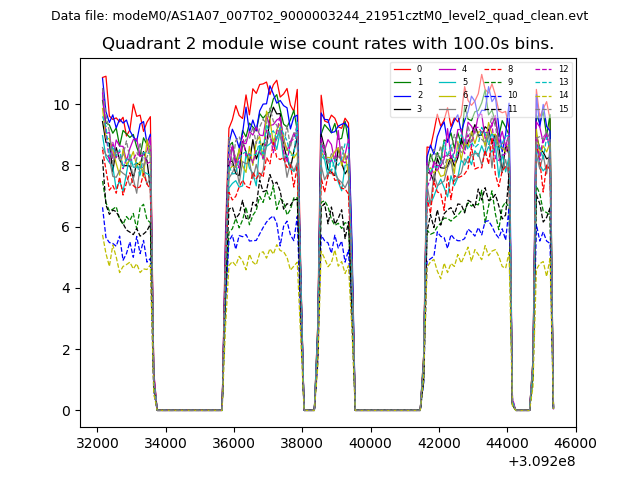
| Quadrant-wise count rates Data is divided into 100 sec bins |
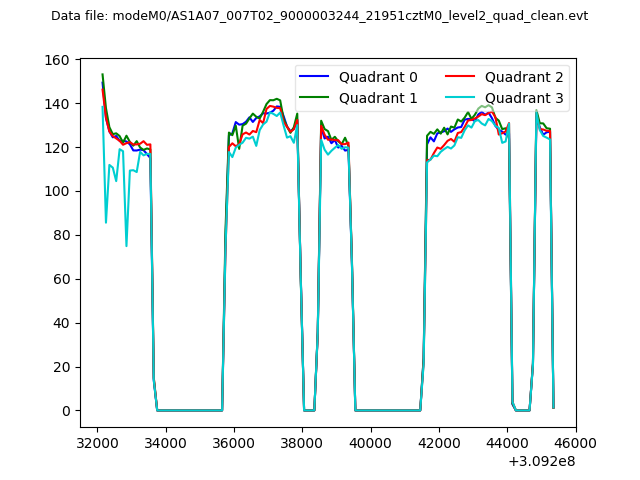 |
|
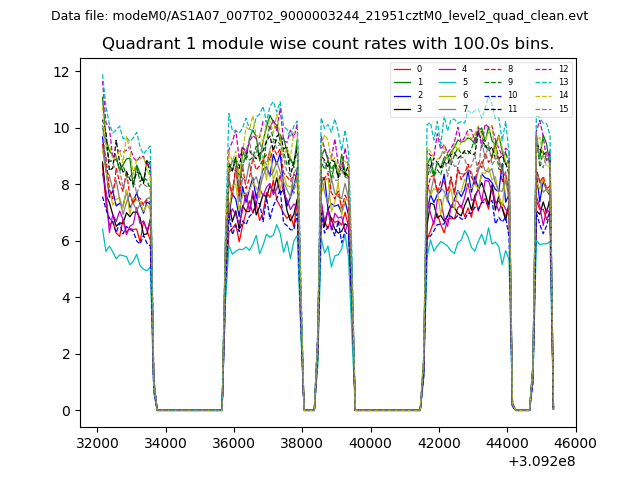
| Module-wise count rates for Quadrant A Data is divided into 100 sec bins |
 |
 |
| Module-wise count rates for Quadrant B Data is divided into 100 sec bins |
 |
 |
| Module-wise count rates for Quadrant C Data is divided into 100 sec bins |
 |
 |
| Module-wise count rates for Quadrant D Data is divided into 100 sec bins |
 |
 |
| Parameter | Plot |
|---|---|
| CZT HV Monitor | 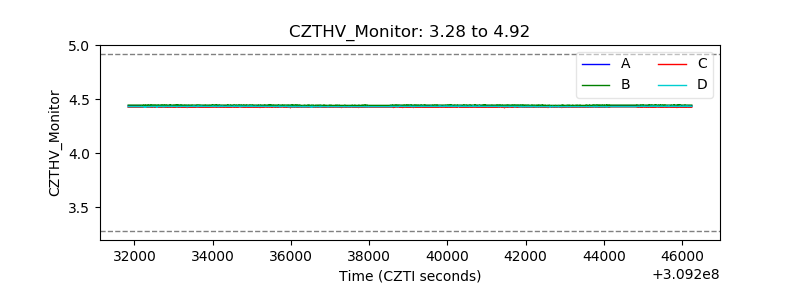 |
| D_VDD | 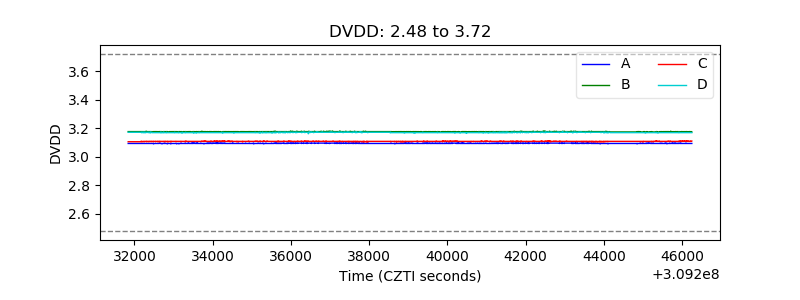 |
| Temperature 1 | 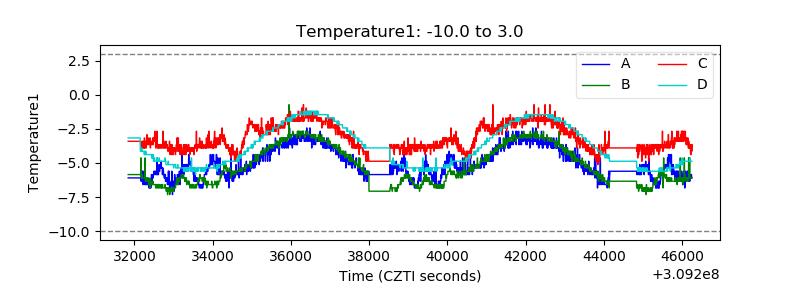 |
| Veto HV Monitor | 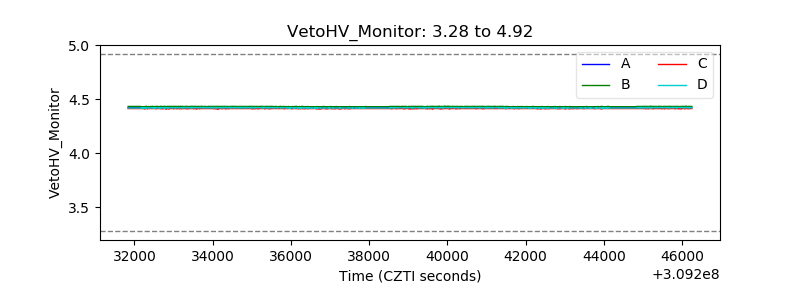 |
| Veto LLD | 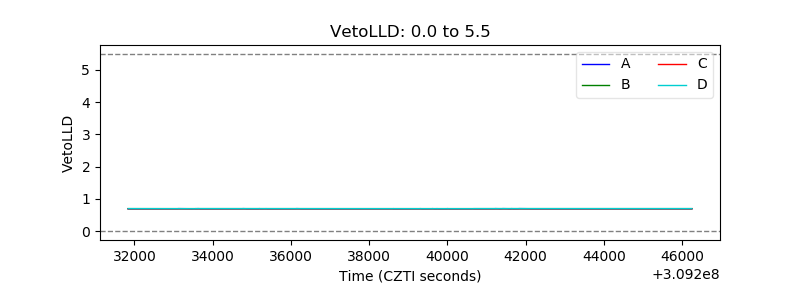 |
| Alpha Counter | 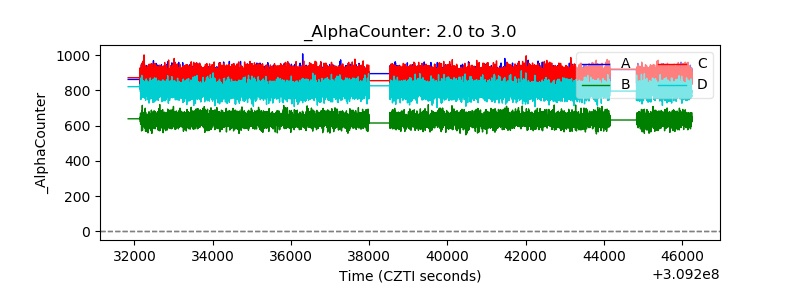 |
| _CPM_Rate |  |
| CZT Counter | 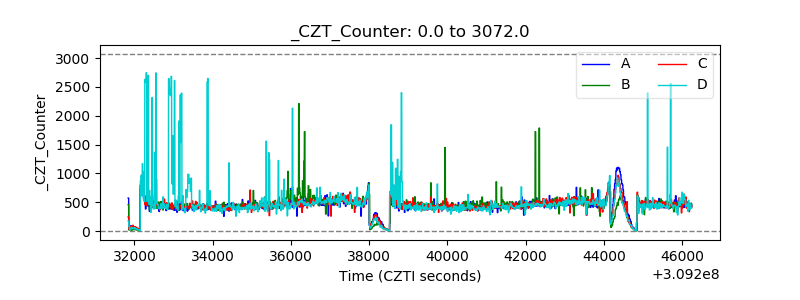 |
| +2.5 Volts monitor | 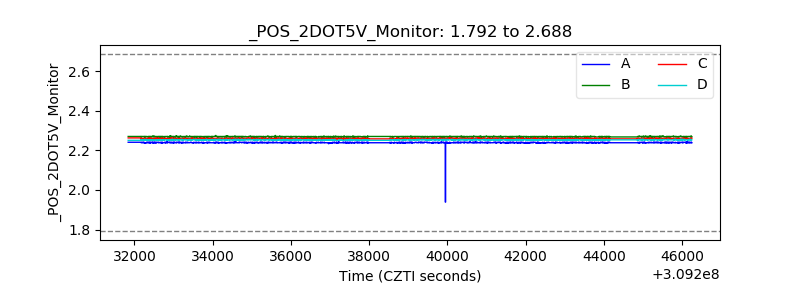 |
| +5 Volts monitor |  |
| _ROLL_ROT |  |
| _Roll_DEC | 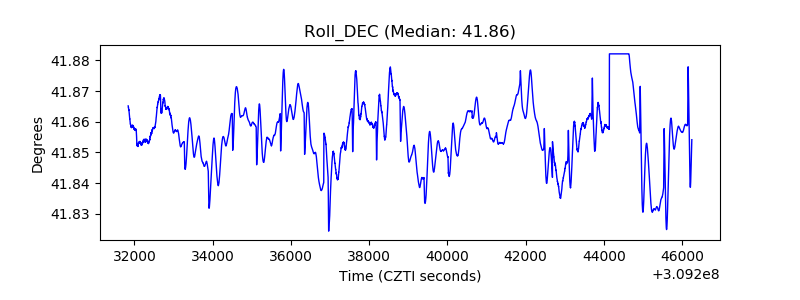 |
| _Roll_RA | 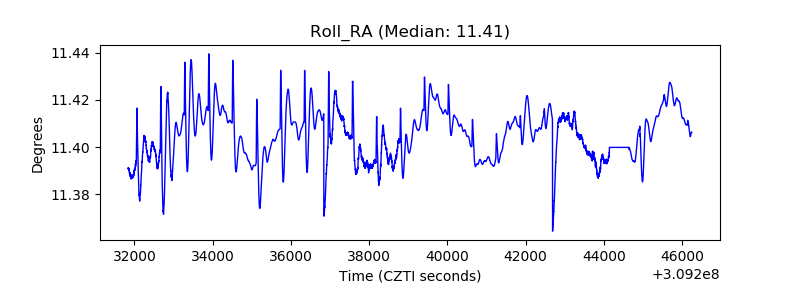 |
| Veto Counter |  |