| Param | Original file | Final file |
|---|---|---|
| Filename | modeM0/AS1A07_007T02_9000003244_21952cztM0_level2.evt | modeM0/AS1A07_007T02_9000003244_21952cztM0_level2_quad_clean.evt |
| Size (bytes) | 520,608,960 | 90,714,240 |
| Size | 496.5 MB | 86.5 MB |
| Events in quadrant A | 3,705,753 | 554,622 |
| Events in quadrant B | 3,872,948 | 564,015 |
| Events in quadrant C | 3,755,867 | 547,522 |
| Events in quadrant D | 3,900,624 | 536,676 |
| Mode M0 | |||
|---|---|---|---|
| Quadrant | BADHDUFLAG | Total packets | Discarded packets |
| A | 0 | 15920 | 2 |
| B | 0 | 16267 | 2 |
| C | 0 | 15974 | 3 |
| D | 0 | 16842 | 2 |
| Mode M9 | |||
|---|---|---|---|
| Quadrant | BADHDUFLAG | Total packets | Discarded packets |
| A | 0 | 16 | 0 |
| B | 0 | 16 | 0 |
| C | 0 | 16 | 0 |
| D | 0 | 16 | 0 |
| Mode SS | |||
|---|---|---|---|
| Quadrant | BADHDUFLAG | Total packets | Discarded packets |
| A | 0 | 160 | 0 |
| B | 0 | 160 | 0 |
| C | 0 | 160 | 0 |
| D | 0 | 160 | 0 |
| Quadrant | Total seconds | Saturated seconds | Saturation percentage |
|---|---|---|---|
| A | 7829 | 80 | 1.021842% |
| B | 7829 | 102 | 1.302848% |
| C | 7828 | 101 | 1.290240% |
| D | 7828 | 134 | 1.711804% |
Noise dominated data is calculated using 1-second bins in cleaned event files. If a bin has >2000 counts, and if more than 50% of those come from <1% of pixels, then it is considered to be noise-dominated and hence unusable.
| Quadrant | # 1 sec bins | Bins with >0 counts | Bins with >2000 counts | High rate bins dominated by noise | Noise dominated (total time) | Noise dominated (detector-on time) | Marked lightcurve |
|---|---|---|---|---|---|---|---|
| A | 9384 | 7829 | 0 | 0 | 0.00% | 0.00% | 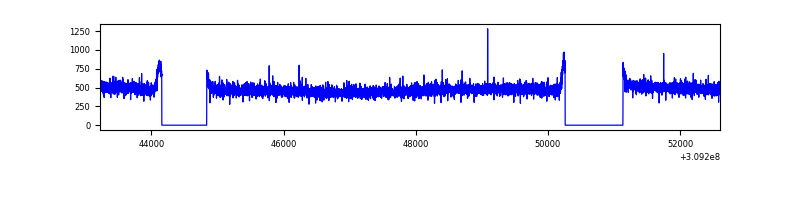 |
| B | 9384 | 7829 | 9 | 9 | 0.10% | 0.11% | 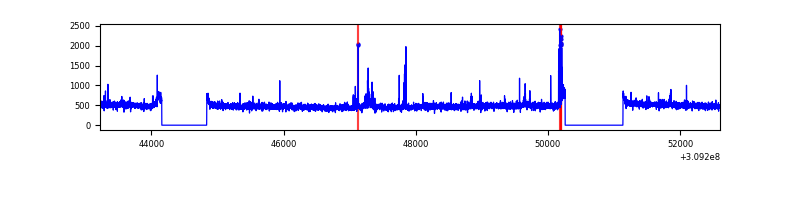 |
| C | 9383 | 7828 | 0 | 0 | 0.00% | 0.00% | 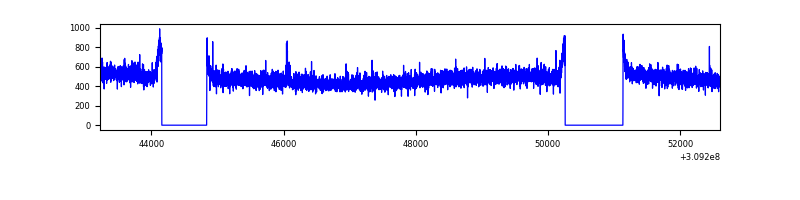 |
| D | 9383 | 7828 | 75 | 75 | 0.80% | 0.96% | 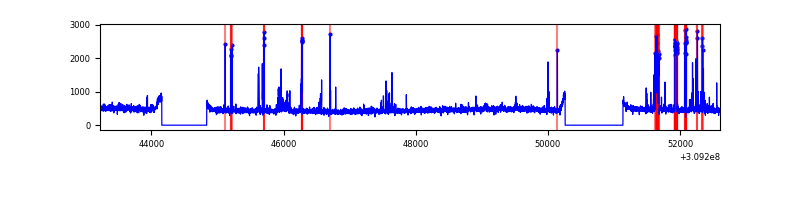 |
Top three noisy pixels from each quadrant. If the there are fewer than three noisy pixels in the level2.evt file, extra rows are filled as -1
| Pixel properties | Quadrant properties | ||||||
|---|---|---|---|---|---|---|---|
| Quadrant | DetID | PixID | Counts | Sigma | Mean | Median | Sigma |
| A | 13 | 254 | 12695 | 60.79 | 958 | 935 | 193.5 |
| A | 4 | 2 | 9178 | 42.61 | 958 | 935 | 193.5 |
| A | 3 | 137 | 8331 | 38.23 | 958 | 935 | 193.5 |
| B | 3 | 64 | 44725 | 238.73 | 956 | 929 | 183.4 |
| B | 0 | 230 | 34459 | 182.77 | 956 | 929 | 183.4 |
| B | 12 | 111 | 22956 | 120.07 | 956 | 929 | 183.4 |
| C | 14 | 238 | 145086 | 662.57 | 924 | 933 | 217.6 |
| C | 9 | 54 | 6770 | 26.83 | 924 | 933 | 217.6 |
| C | 13 | 61 | 6516 | 25.66 | 924 | 933 | 217.6 |
| D | 11 | 176 | 301884 | 1325.65 | 929 | 901 | 227.0 |
| D | 2 | 136 | 34262 | 146.93 | 929 | 901 | 227.0 |
| D | 2 | 234 | 29497 | 125.95 | 929 | 901 | 227.0 |
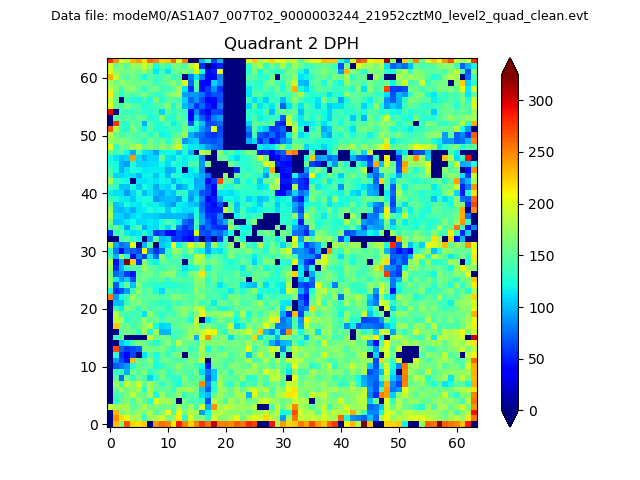
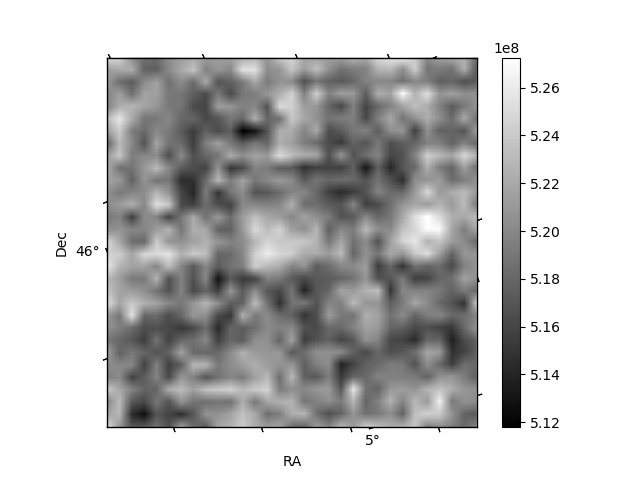
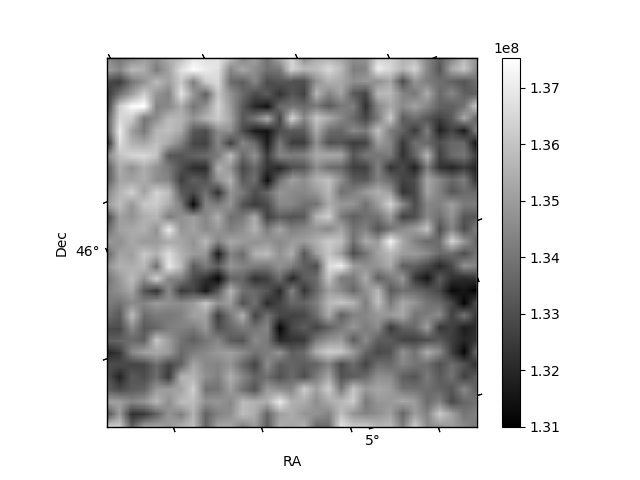
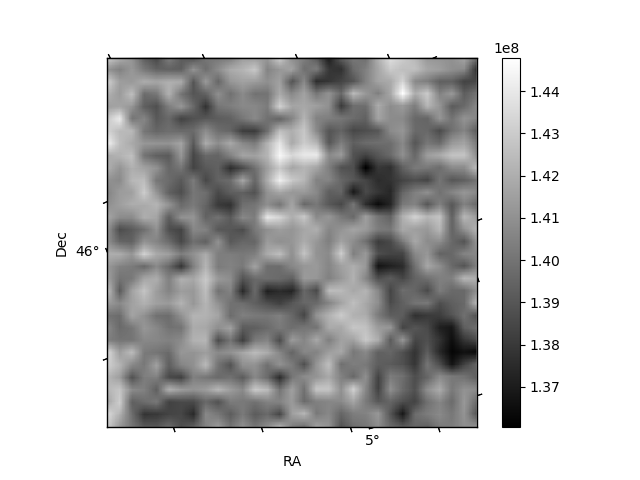
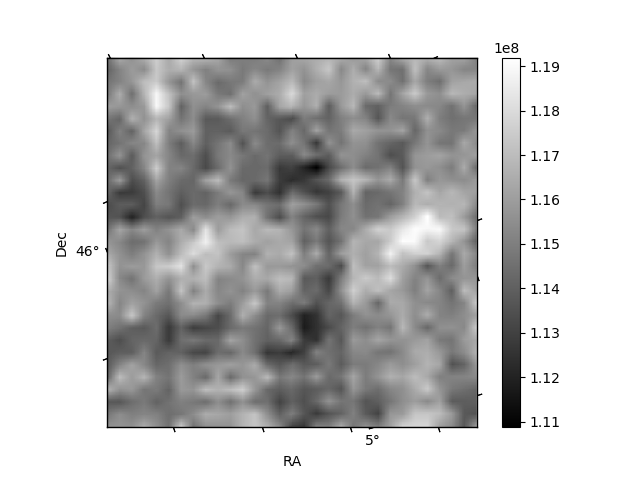
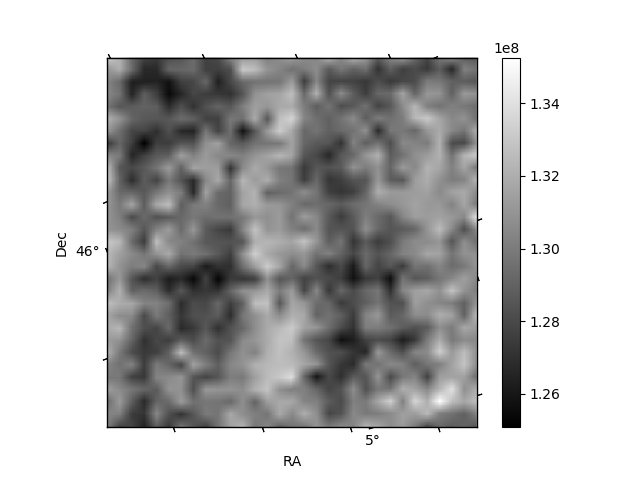
Histogram calculated using DETX and DETY for each event in the final _common_clean file
| Quadrant A | 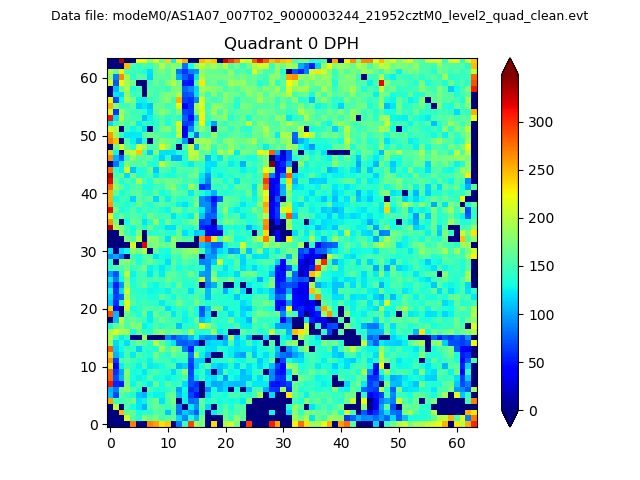 |
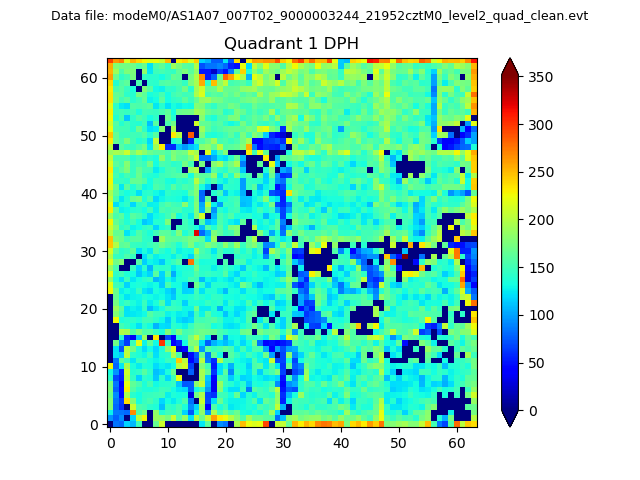 |
Quadrant B |
|---|---|---|---|
| Quadrant D | 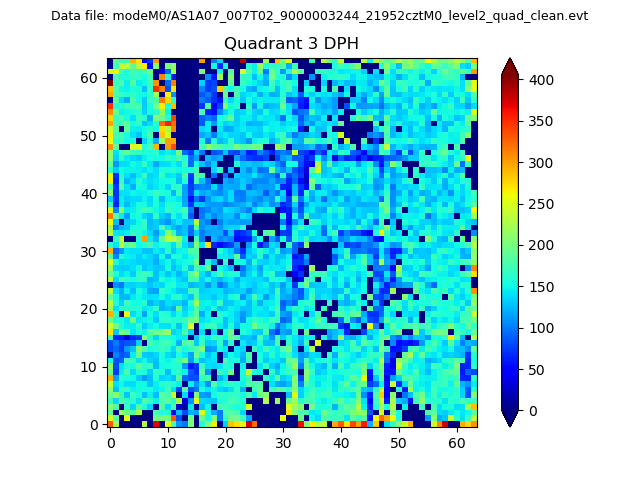 |
 |
Quadrant C |
| Plot type | Count rate plots | Images |
|---|---|---|
| Comparison with Poisson distribution Blue bars denote a histogram of data divided into 1 sec bins. Red curve is a Poisson curve with rate = median count rate of data. |
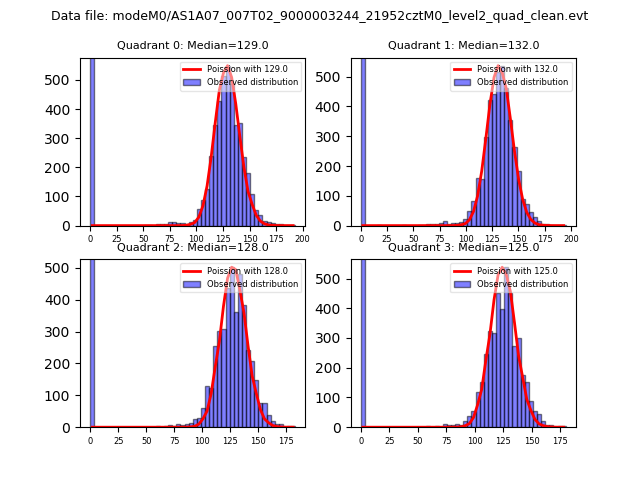 |
 |
| Quadrant-wise count rates Data is divided into 100 sec bins |
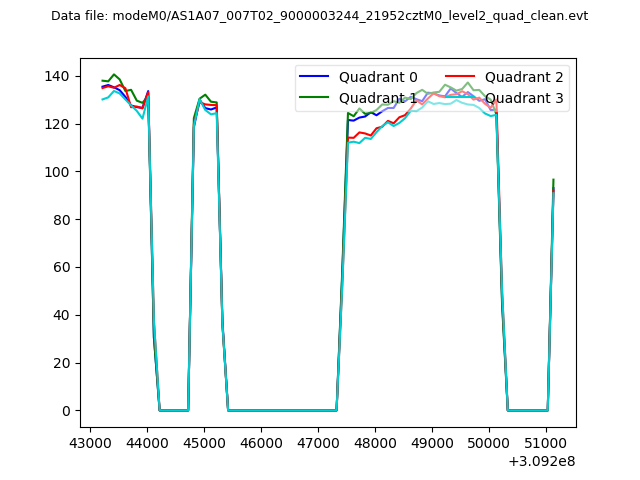 |
|
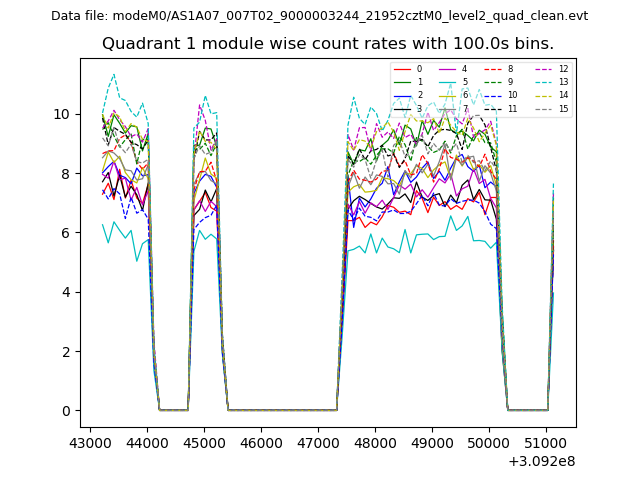
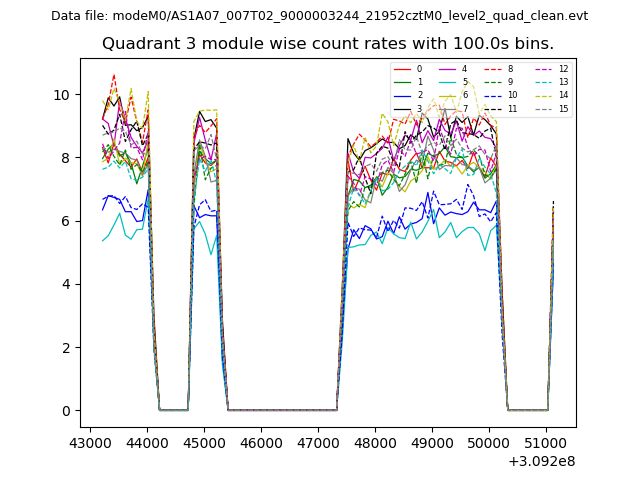
| Module-wise count rates for Quadrant A Data is divided into 100 sec bins |
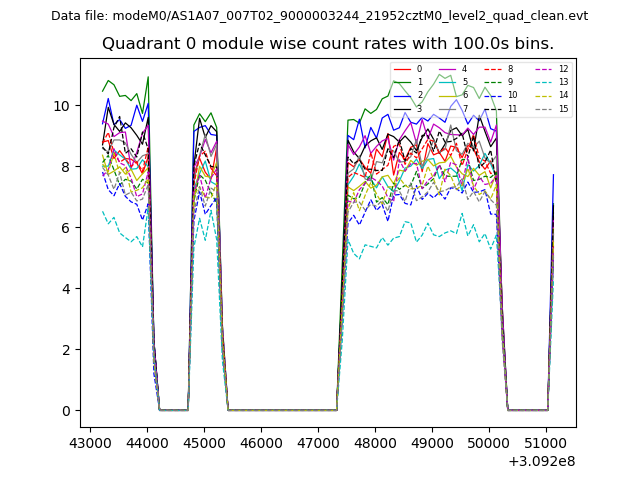 |
 |
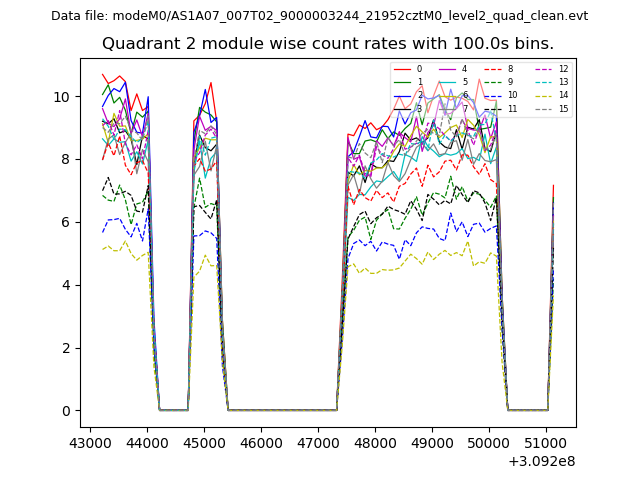
| Module-wise count rates for Quadrant B Data is divided into 100 sec bins |
 |
 |
| Module-wise count rates for Quadrant C Data is divided into 100 sec bins |
 |
 |
| Module-wise count rates for Quadrant D Data is divided into 100 sec bins |
 |
 |
| Parameter | Plot |
|---|---|
| CZT HV Monitor |  |
| D_VDD | 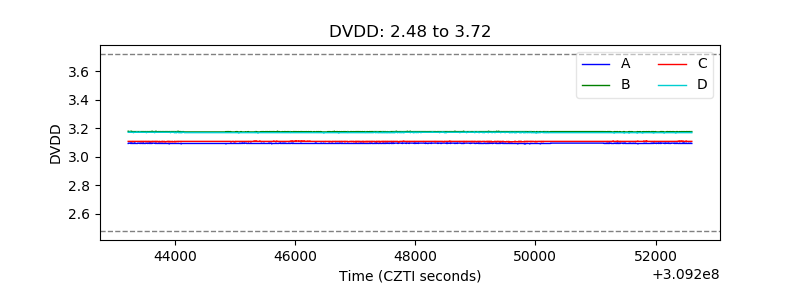 |
| Temperature 1 | 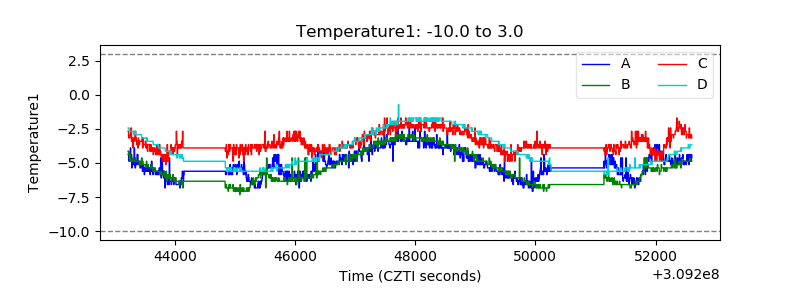 |
| Veto HV Monitor | 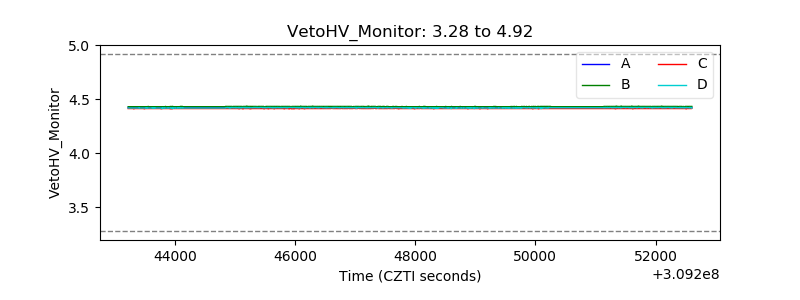 |
| Veto LLD | 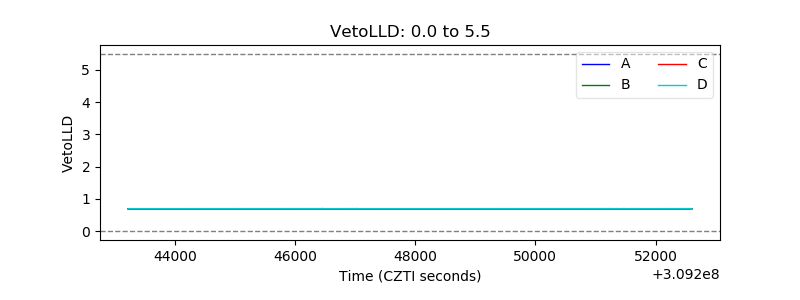 |
| Alpha Counter | 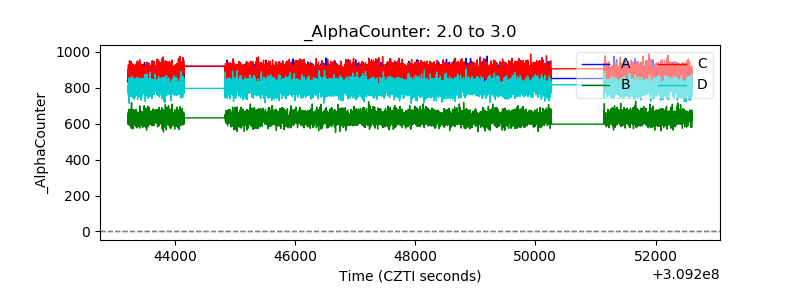 |
| _CPM_Rate | 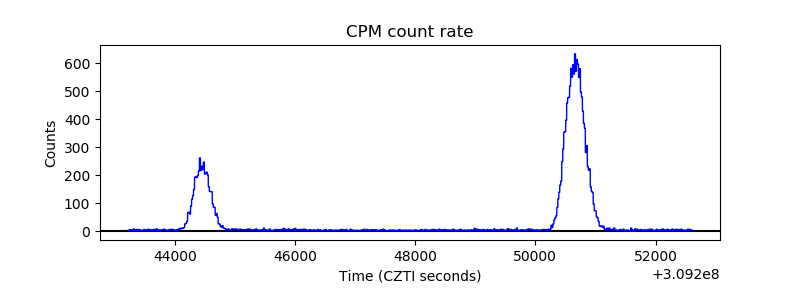 |
| CZT Counter | 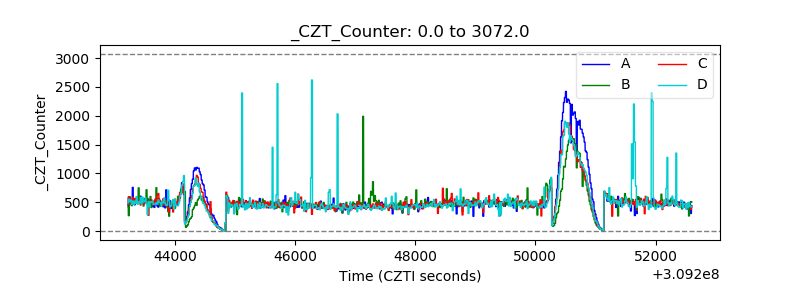 |
| +2.5 Volts monitor |  |
| +5 Volts monitor | 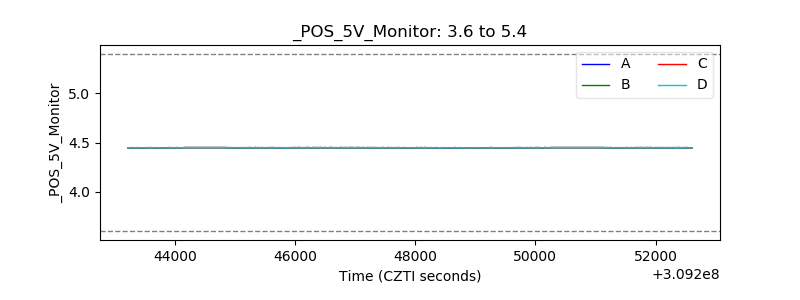 |
| _ROLL_ROT | 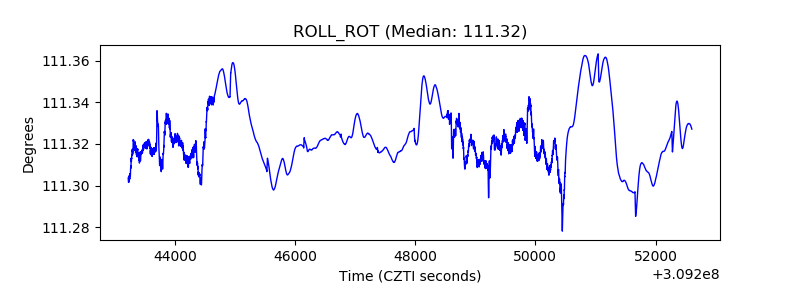 |
| _Roll_DEC | 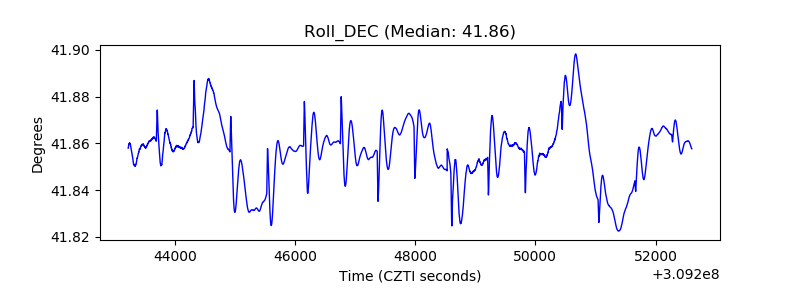 |
| _Roll_RA | 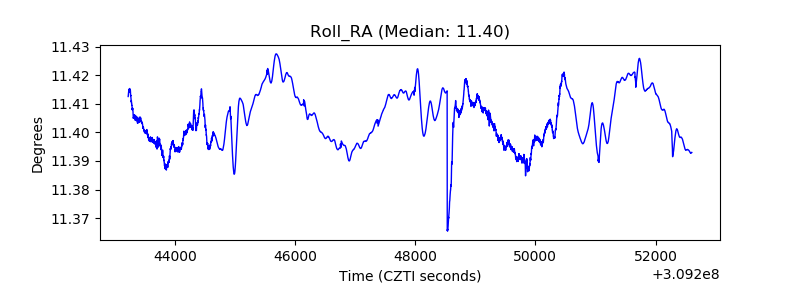 |
| Veto Counter | 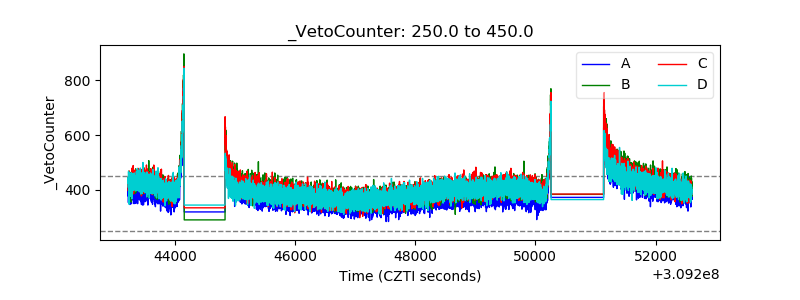 |