| Param | Original file | Final file |
|---|---|---|
| Filename | modeM0/AS1A07_007T02_9000003244_21953cztM0_level2.evt | modeM0/AS1A07_007T02_9000003244_21953cztM0_level2_quad_clean.evt |
| Size (bytes) | 464,725,440 | 68,014,080 |
| Size | 443.2 MB | 64.9 MB |
| Events in quadrant A | 3,333,441 | 405,832 |
| Events in quadrant B | 3,636,746 | 408,609 |
| Events in quadrant C | 3,212,609 | 396,689 |
| Events in quadrant D | 3,444,135 | 389,175 |
| Mode M0 | |||
|---|---|---|---|
| Quadrant | BADHDUFLAG | Total packets | Discarded packets |
| A | 0 | 14063 | 2 |
| B | 0 | 14783 | 2 |
| C | 0 | 13537 | 3 |
| D | 0 | 14594 | 2 |
| Mode M9 | |||
|---|---|---|---|
| Quadrant | BADHDUFLAG | Total packets | Discarded packets |
| A | 0 | 13 | 0 |
| B | 0 | 14 | 0 |
| C | 0 | 14 | 0 |
| D | 0 | 14 | 0 |
| Mode SS | |||
|---|---|---|---|
| Quadrant | BADHDUFLAG | Total packets | Discarded packets |
| A | 0 | 134 | 0 |
| B | 0 | 134 | 0 |
| C | 0 | 134 | 0 |
| D | 0 | 134 | 0 |
| Quadrant | Total seconds | Saturated seconds | Saturation percentage |
|---|---|---|---|
| A | 6580 | 65 | 0.987842% |
| B | 6580 | 145 | 2.203647% |
| C | 6579 | 73 | 1.109591% |
| D | 6579 | 137 | 2.082383% |
Noise dominated data is calculated using 1-second bins in cleaned event files. If a bin has >2000 counts, and if more than 50% of those come from <1% of pixels, then it is considered to be noise-dominated and hence unusable.
| Quadrant | # 1 sec bins | Bins with >0 counts | Bins with >2000 counts | High rate bins dominated by noise | Noise dominated (total time) | Noise dominated (detector-on time) | Marked lightcurve |
|---|---|---|---|---|---|---|---|
| A | 7585 | 6580 | 1 | 1 | 0.01% | 0.02% |  |
| B | 7585 | 6580 | 71 | 71 | 0.94% | 1.08% | 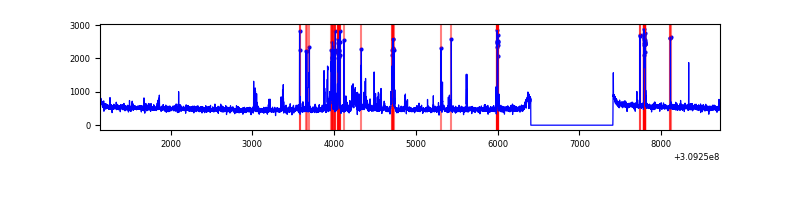 |
| C | 7584 | 6579 | 0 | 0 | 0.00% | 0.00% | 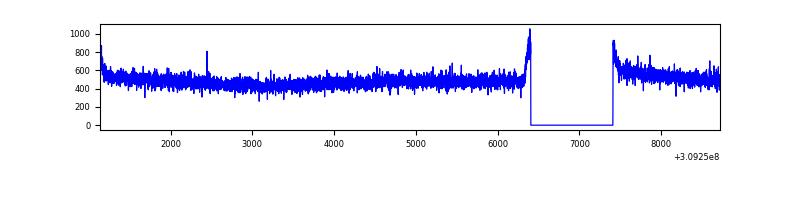 |
| D | 7584 | 6579 | 95 | 95 | 1.25% | 1.44% | 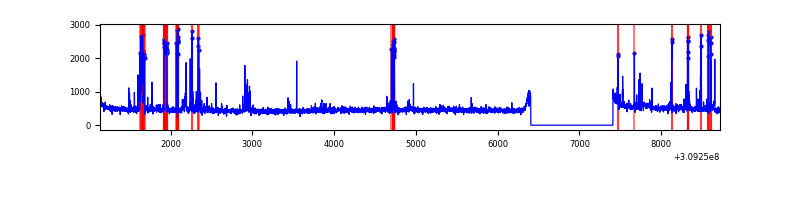 |
Top three noisy pixels from each quadrant. If the there are fewer than three noisy pixels in the level2.evt file, extra rows are filled as -1
| Pixel properties | Quadrant properties | ||||||
|---|---|---|---|---|---|---|---|
| Quadrant | DetID | PixID | Counts | Sigma | Mean | Median | Sigma |
| A | 2 | 79 | 80750 | 476.83 | 831 | 813 | 167.6 |
| A | 4 | 2 | 35184 | 205.03 | 831 | 813 | 167.6 |
| A | 6 | 16 | 14402 | 81.06 | 831 | 813 | 167.6 |
| B | 3 | 64 | 376644 | 2378.88 | 821 | 798 | 158.0 |
| B | 12 | 111 | 19527 | 118.54 | 821 | 798 | 158.0 |
| B | 11 | 111 | 17292 | 104.4 | 821 | 798 | 158.0 |
| C | 14 | 238 | 126704 | 680.31 | 791 | 797 | 185.1 |
| C | 13 | 61 | 5625 | 26.09 | 791 | 797 | 185.1 |
| C | 0 | 10 | 2532 | 9.37 | 791 | 797 | 185.1 |
| D | 11 | 176 | 349736 | 1807.93 | 797 | 775 | 193.0 |
| D | 1 | 52 | 53070 | 270.93 | 797 | 775 | 193.0 |
| D | 2 | 234 | 23719 | 118.87 | 797 | 775 | 193.0 |
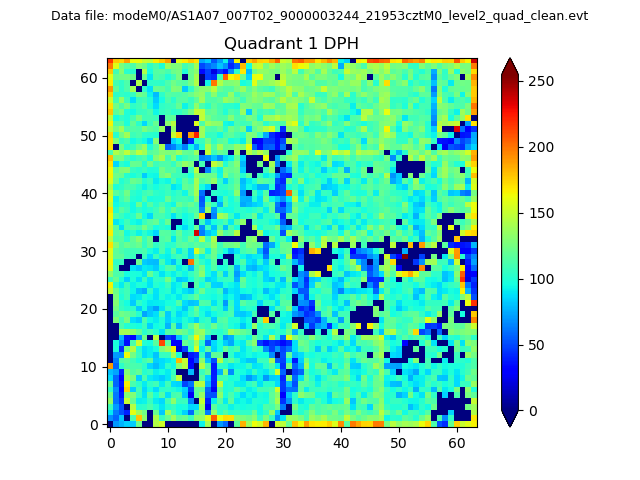
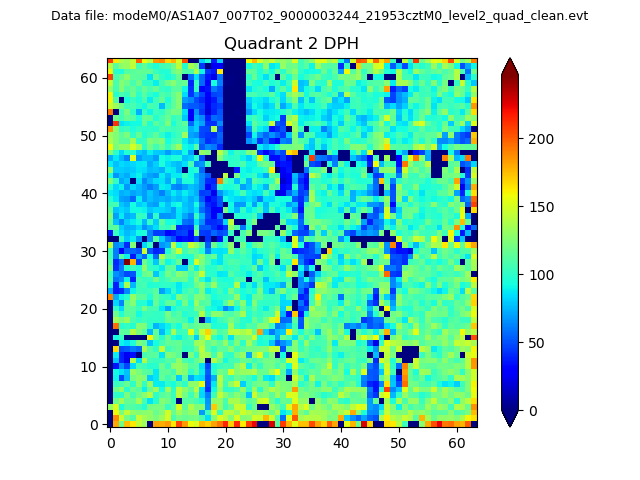
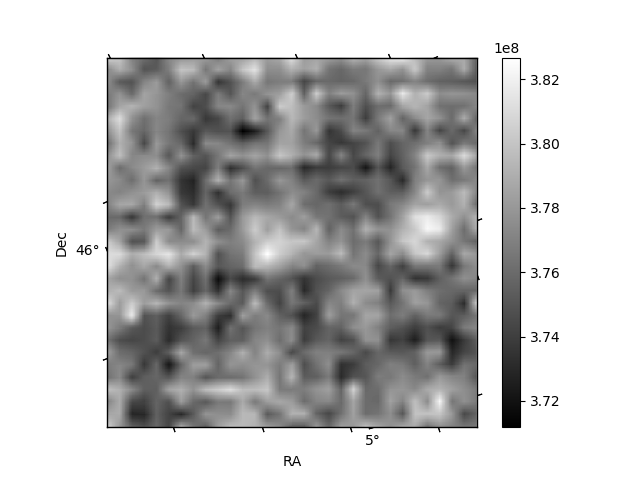
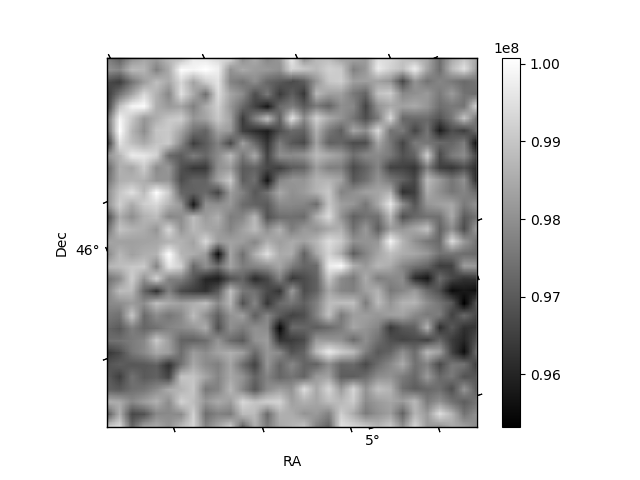
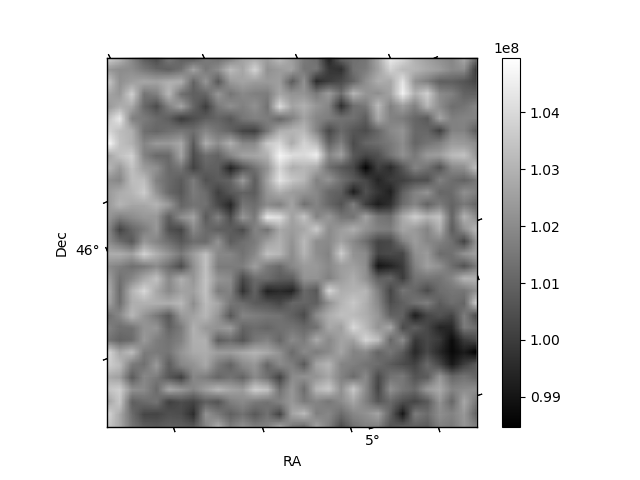
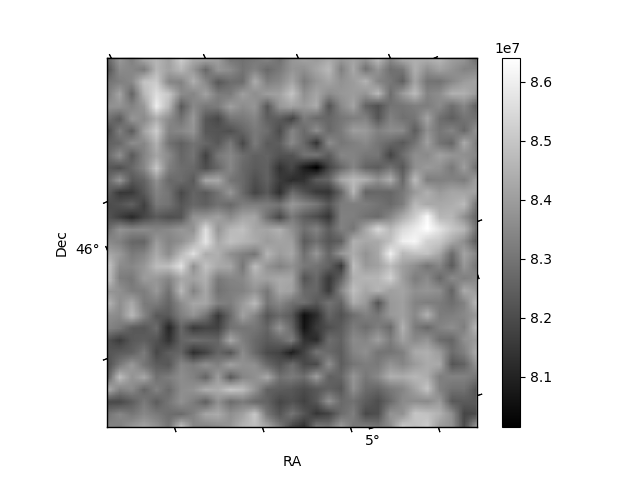
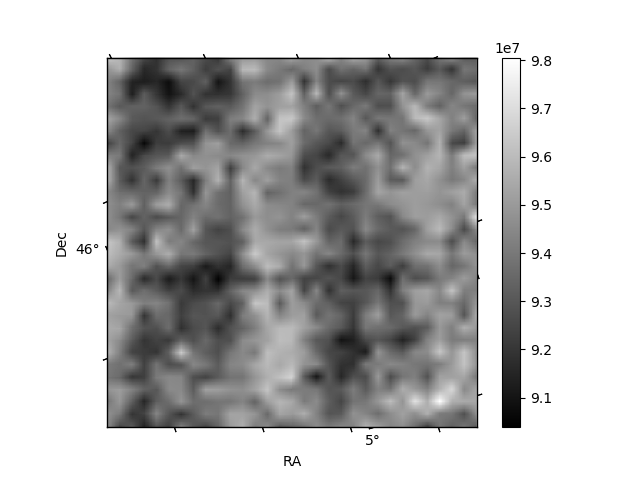
Histogram calculated using DETX and DETY for each event in the final _common_clean file
| Quadrant A | 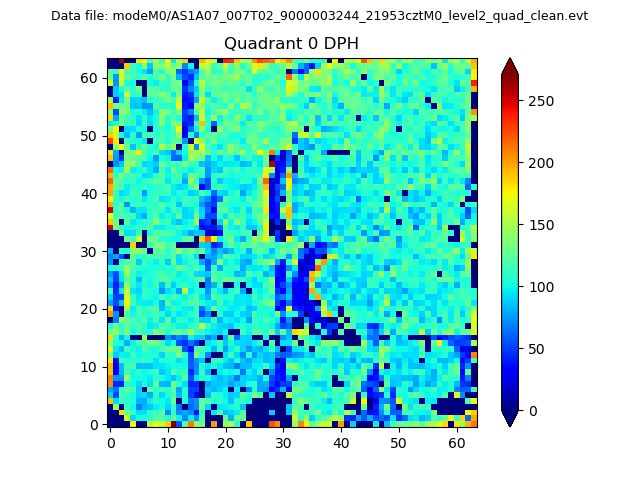 |
 |
Quadrant B |
|---|---|---|---|
| Quadrant D | 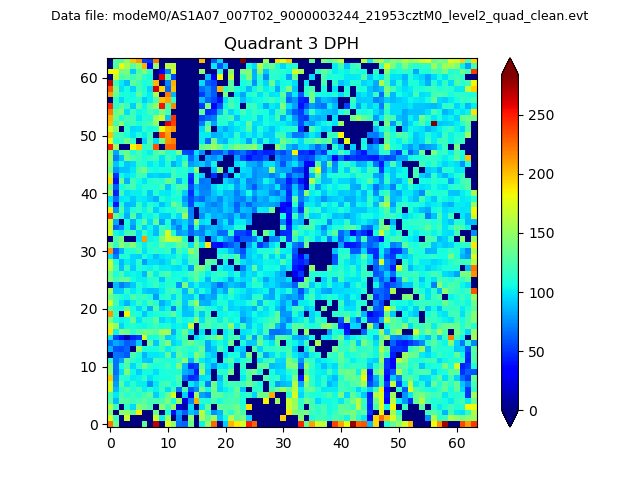 |
 |
Quadrant C |
| Plot type | Count rate plots | Images |
|---|---|---|
| Comparison with Poisson distribution Blue bars denote a histogram of data divided into 1 sec bins. Red curve is a Poisson curve with rate = median count rate of data. |
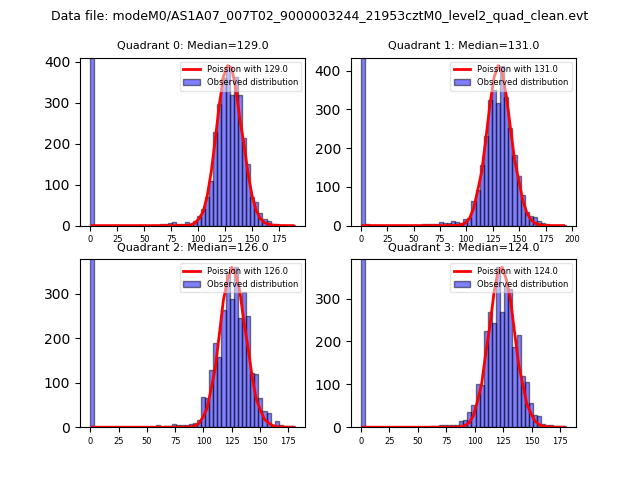 |
 |
| Quadrant-wise count rates Data is divided into 100 sec bins |
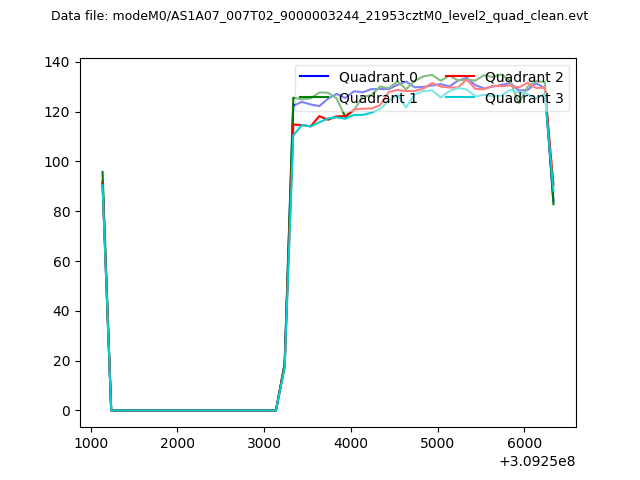 |
|
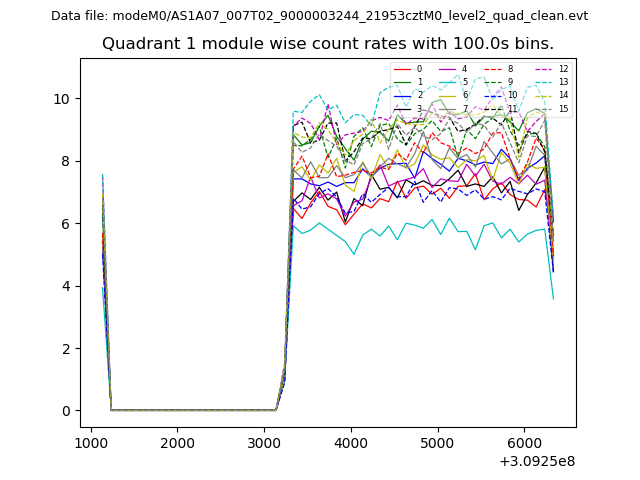
| Module-wise count rates for Quadrant A Data is divided into 100 sec bins |
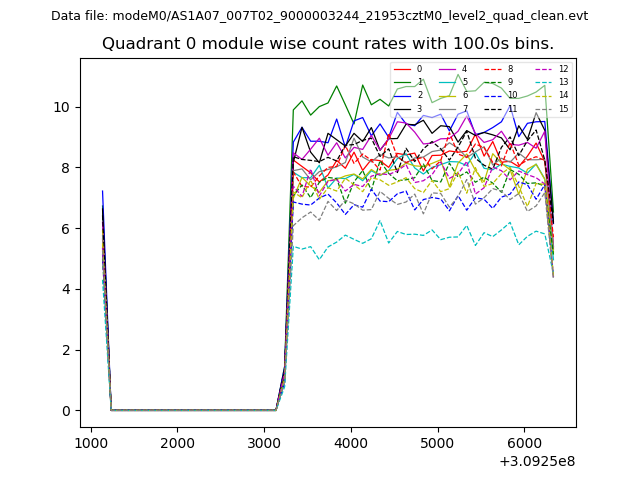 |
 |
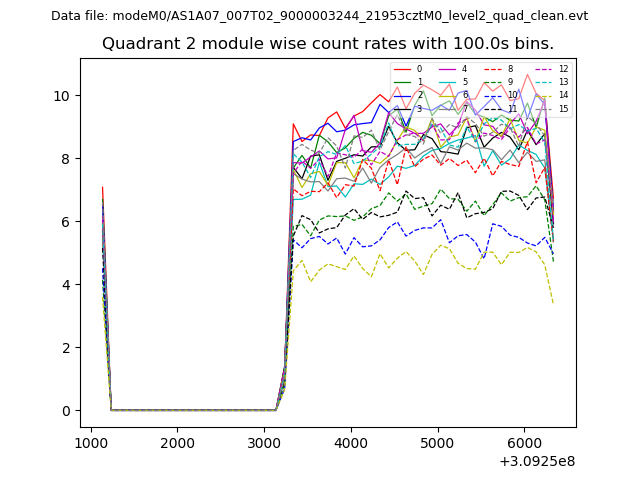
| Module-wise count rates for Quadrant B Data is divided into 100 sec bins |
 |
 |
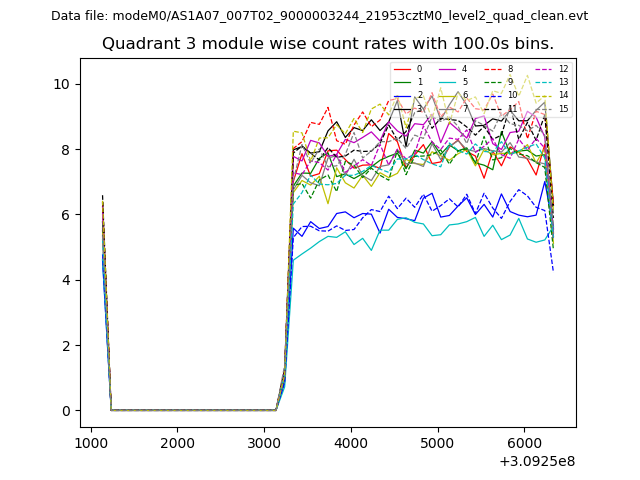
| Module-wise count rates for Quadrant C Data is divided into 100 sec bins |
 |
 |
| Module-wise count rates for Quadrant D Data is divided into 100 sec bins |
 |
 |
| Parameter | Plot |
|---|---|
| CZT HV Monitor | 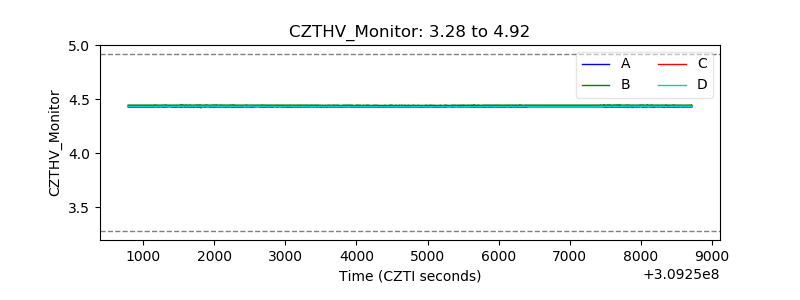 |
| D_VDD |  |
| Temperature 1 | 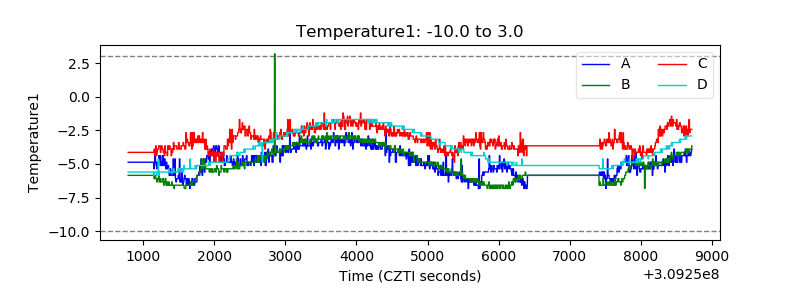 |
| Veto HV Monitor | 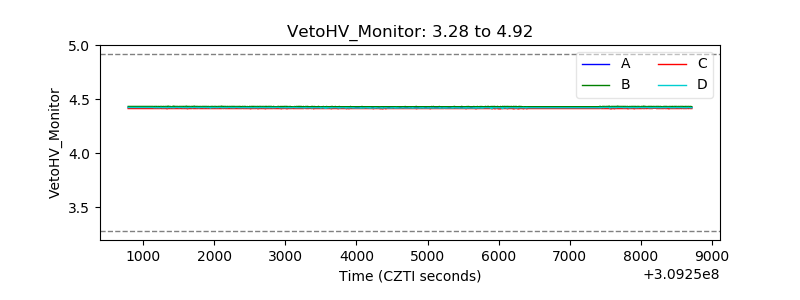 |
| Veto LLD | 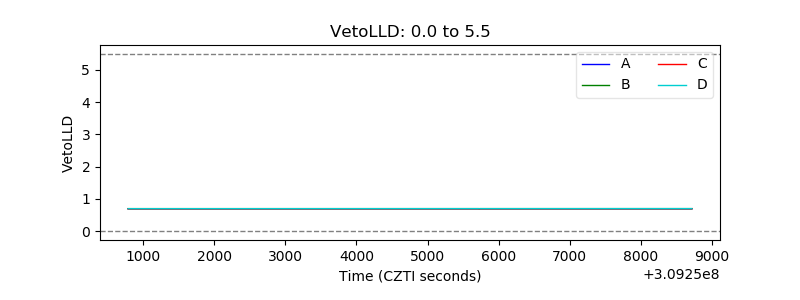 |
| Alpha Counter | 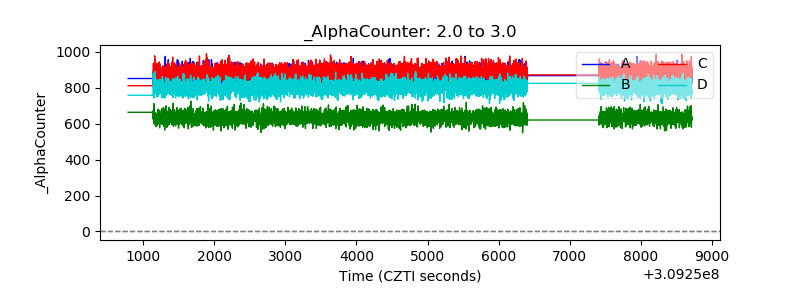 |
| _CPM_Rate | 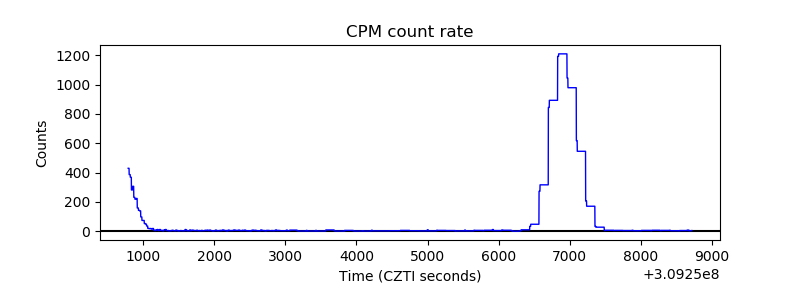 |
| CZT Counter | 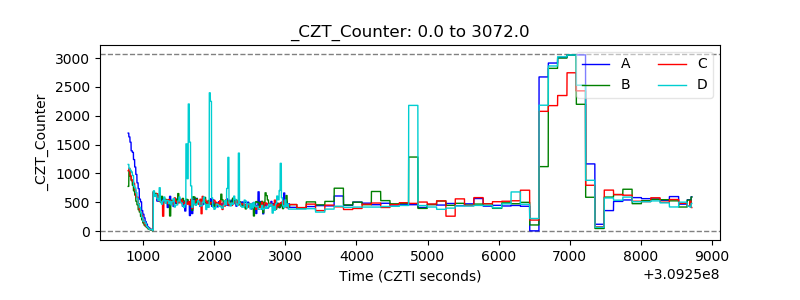 |
| +2.5 Volts monitor |  |
| +5 Volts monitor |  |
| _ROLL_ROT | 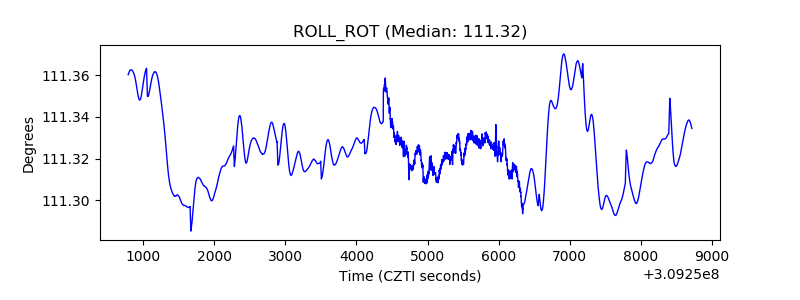 |
| _Roll_DEC | 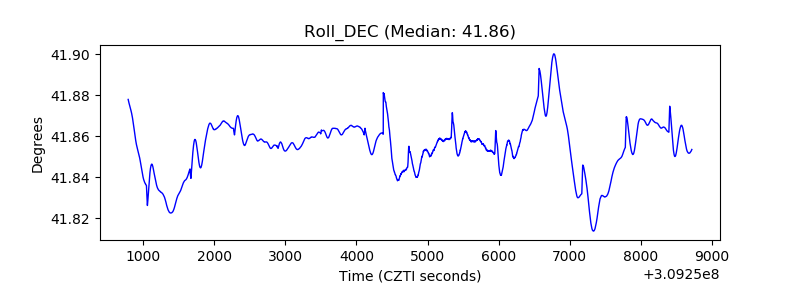 |
| _Roll_RA |  |
| Veto Counter | 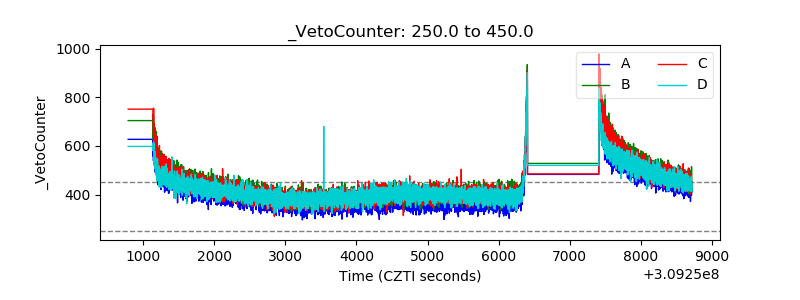 |