| Param | Original file | Final file |
|---|---|---|
| Filename | modeM0/AS1A07_007T02_9000003244_21955cztM0_level2.evt | modeM0/AS1A07_007T02_9000003244_21955cztM0_level2_quad_clean.evt |
| Size (bytes) | 488,108,160 | 77,604,480 |
| Size | 465.5 MB | 74.0 MB |
| Events in quadrant A | 3,707,617 | 477,204 |
| Events in quadrant B | 3,668,063 | 484,594 |
| Events in quadrant C | 3,462,341 | 465,280 |
| Events in quadrant D | 3,490,677 | 457,232 |
| Mode M0 | |||
|---|---|---|---|
| Quadrant | BADHDUFLAG | Total packets | Discarded packets |
| A | 0 | 15328 | 2 |
| B | 0 | 15107 | 2 |
| C | 0 | 14329 | 2 |
| D | 0 | 14640 | 2 |
| Mode M9 | |||
|---|---|---|---|
| Quadrant | BADHDUFLAG | Total packets | Discarded packets |
| A | 0 | 21 | 0 |
| B | 0 | 21 | 0 |
| C | 0 | 21 | 0 |
| D | 0 | 21 | 0 |
| Mode SS | |||
|---|---|---|---|
| Quadrant | BADHDUFLAG | Total packets | Discarded packets |
| A | 0 | 138 | 0 |
| B | 0 | 138 | 0 |
| C | 0 | 138 | 0 |
| D | 0 | 138 | 0 |
| Quadrant | Total seconds | Saturated seconds | Saturation percentage |
|---|---|---|---|
| A | 6676 | 132 | 1.977232% |
| B | 6677 | 198 | 2.965404% |
| C | 6677 | 146 | 2.186611% |
| D | 6677 | 121 | 1.812191% |
Noise dominated data is calculated using 1-second bins in cleaned event files. If a bin has >2000 counts, and if more than 50% of those come from <1% of pixels, then it is considered to be noise-dominated and hence unusable.
| Quadrant | # 1 sec bins | Bins with >0 counts | Bins with >2000 counts | High rate bins dominated by noise | Noise dominated (total time) | Noise dominated (detector-on time) | Marked lightcurve |
|---|---|---|---|---|---|---|---|
| A | 8806 | 6676 | 8 | 8 | 0.09% | 0.12% | 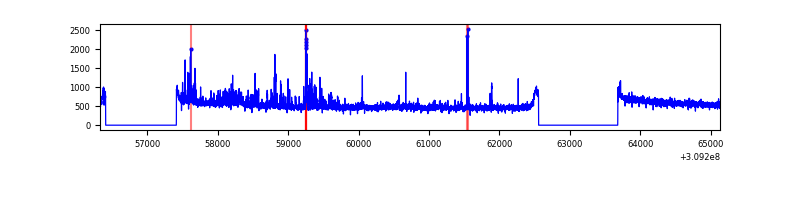 |
| B | 8807 | 6677 | 55 | 55 | 0.62% | 0.82% | 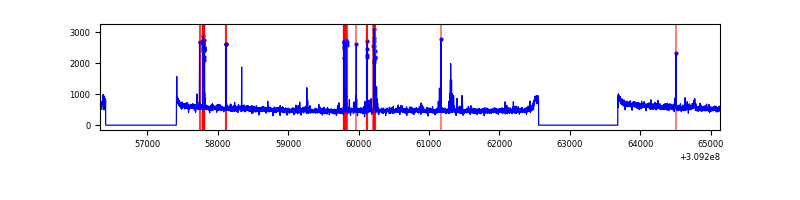 |
| C | 8807 | 6677 | 1 | 1 | 0.01% | 0.01% | 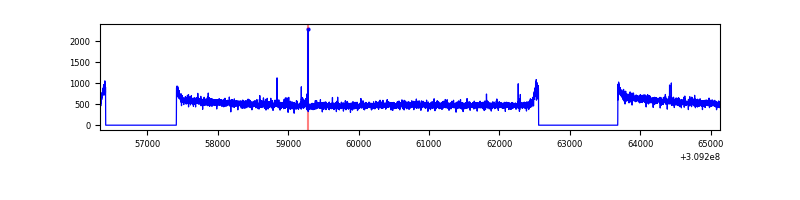 |
| D | 8807 | 6677 | 28 | 28 | 0.32% | 0.42% | 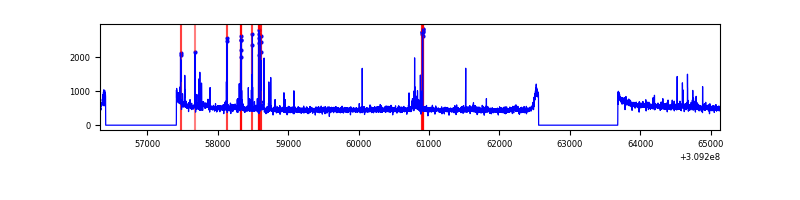 |
Top three noisy pixels from each quadrant. If the there are fewer than three noisy pixels in the level2.evt file, extra rows are filled as -1
| Pixel properties | Quadrant properties | ||||||
|---|---|---|---|---|---|---|---|
| Quadrant | DetID | PixID | Counts | Sigma | Mean | Median | Sigma |
| A | 2 | 79 | 166518 | 926.09 | 896 | 877 | 178.9 |
| A | 4 | 2 | 90275 | 499.82 | 896 | 877 | 178.9 |
| A | 13 | 254 | 11147 | 57.42 | 896 | 877 | 178.9 |
| B | 3 | 64 | 195953 | 1167.62 | 882 | 859 | 167.1 |
| B | 12 | 111 | 20202 | 115.76 | 882 | 859 | 167.1 |
| B | 11 | 111 | 18004 | 102.61 | 882 | 859 | 167.1 |
| C | 14 | 238 | 135338 | 681.38 | 848 | 854 | 197.4 |
| C | 9 | 54 | 19063 | 92.26 | 848 | 854 | 197.4 |
| C | 13 | 61 | 5804 | 25.08 | 848 | 854 | 197.4 |
| D | 11 | 176 | 122102 | 583.8 | 864 | 840 | 207.7 |
| D | 13 | 174 | 47607 | 225.15 | 864 | 840 | 207.7 |
| D | 2 | 136 | 25066 | 116.63 | 864 | 840 | 207.7 |
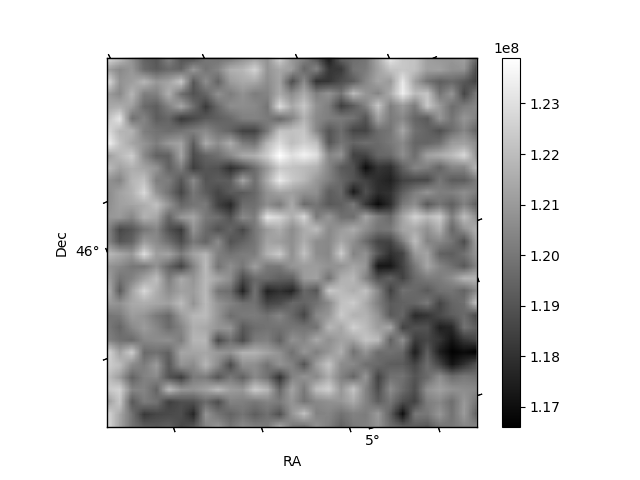
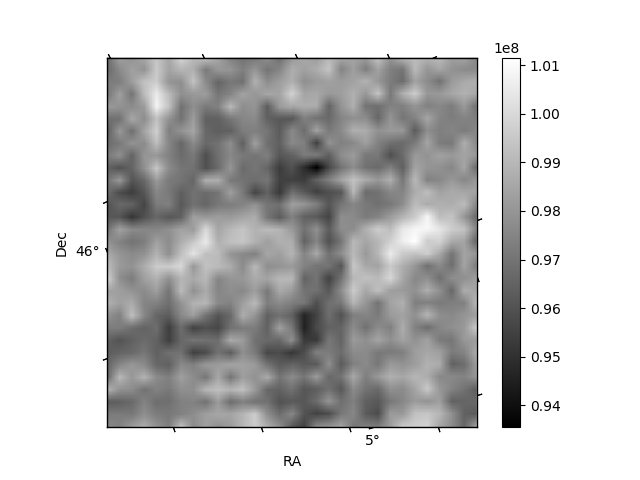
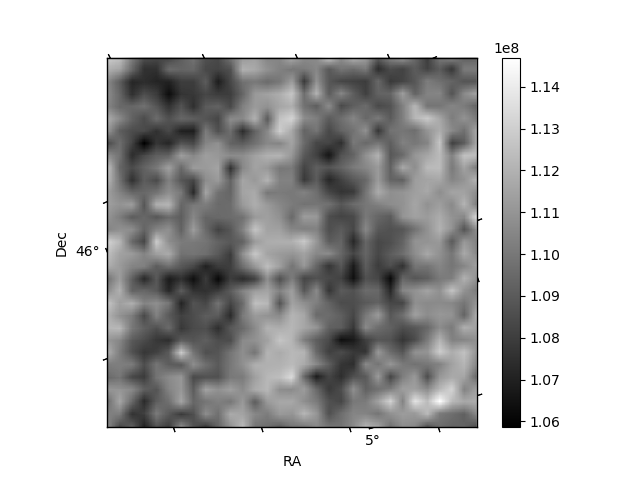
Histogram calculated using DETX and DETY for each event in the final _common_clean file
| Quadrant A | 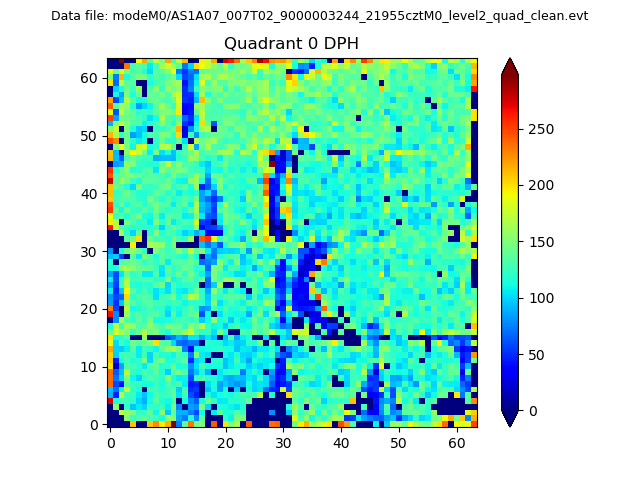 |
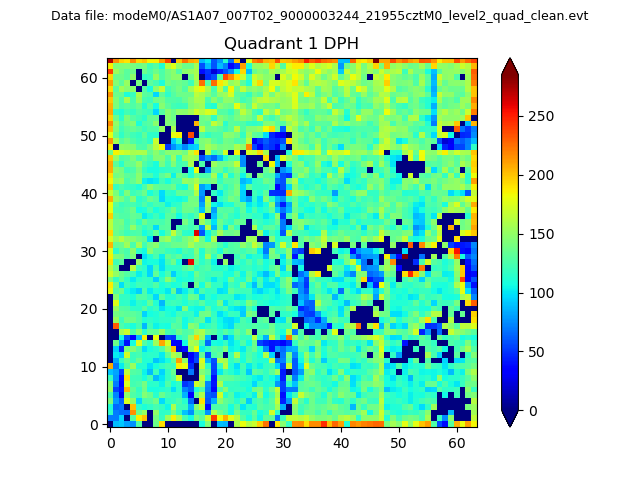 |
Quadrant B |
|---|---|---|---|
| Quadrant D |  |
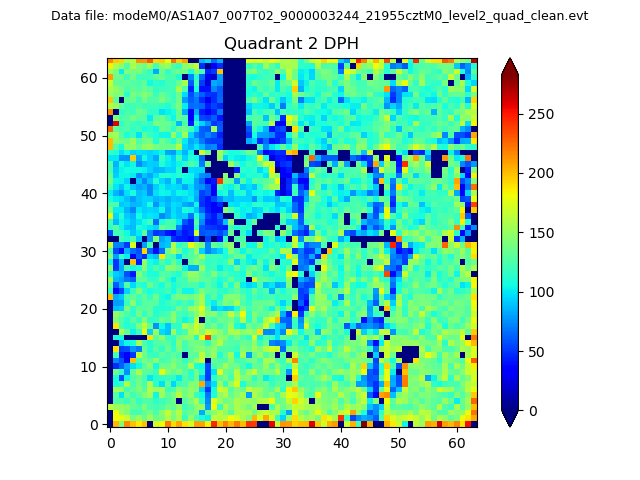 |
Quadrant C |
| Plot type | Count rate plots | Images |
|---|---|---|
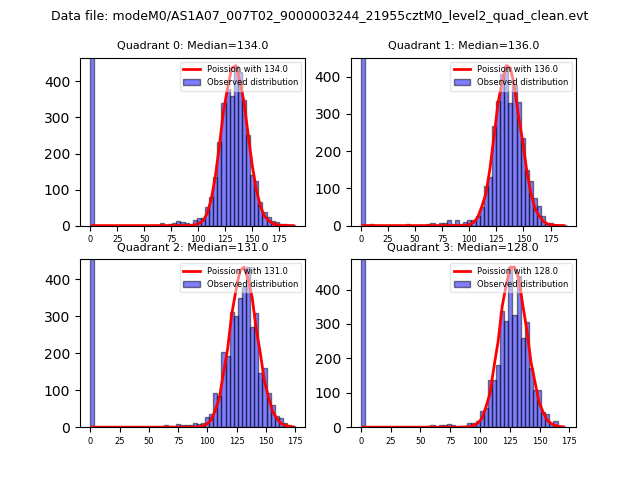
| Comparison with Poisson distribution Blue bars denote a histogram of data divided into 1 sec bins. Red curve is a Poisson curve with rate = median count rate of data. |
 |
 |
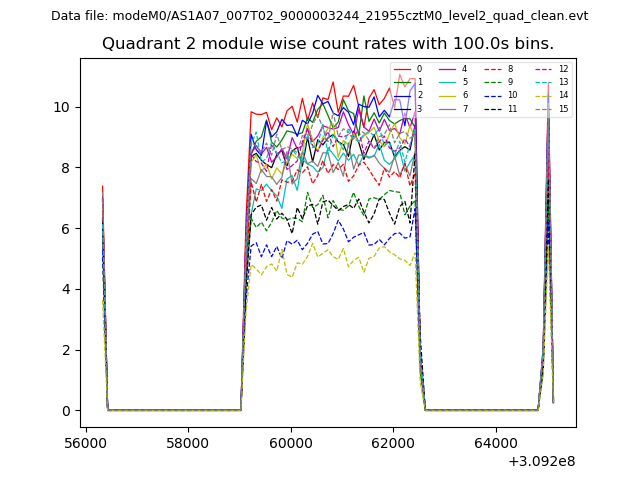
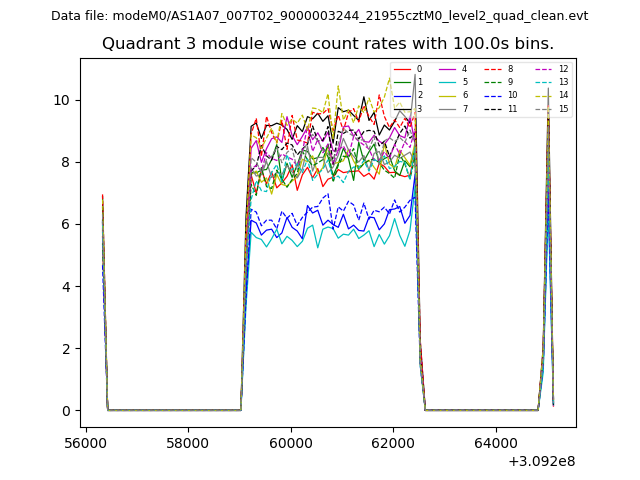
| Quadrant-wise count rates Data is divided into 100 sec bins |
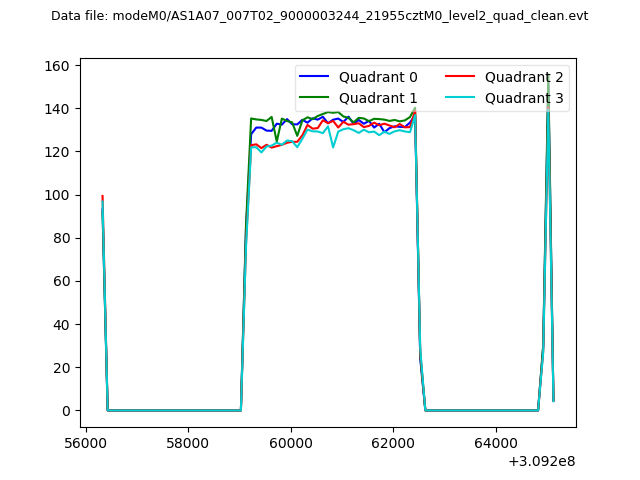 |
|
| Module-wise count rates for Quadrant A Data is divided into 100 sec bins |
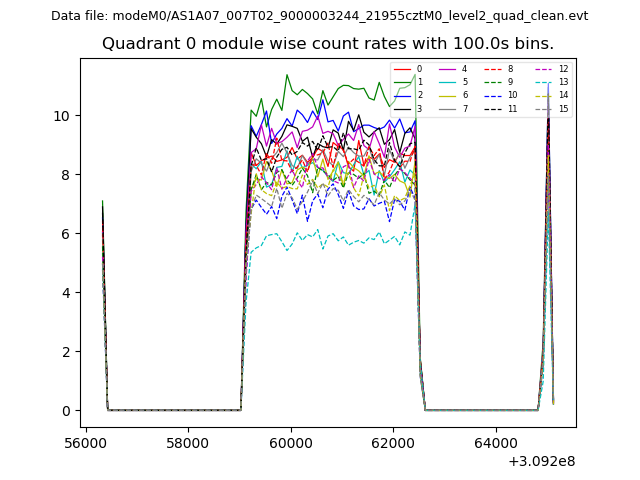 |
 |
| Module-wise count rates for Quadrant B Data is divided into 100 sec bins |
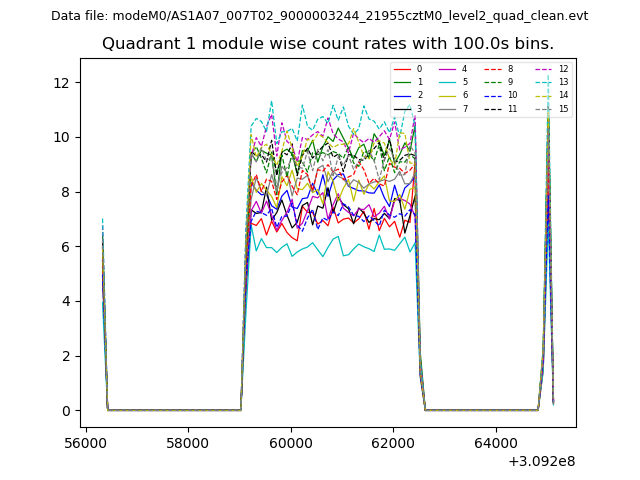 |
 |
| Module-wise count rates for Quadrant C Data is divided into 100 sec bins |
 |
 |
| Module-wise count rates for Quadrant D Data is divided into 100 sec bins |
 |
 |
| Parameter | Plot |
|---|---|
| CZT HV Monitor | 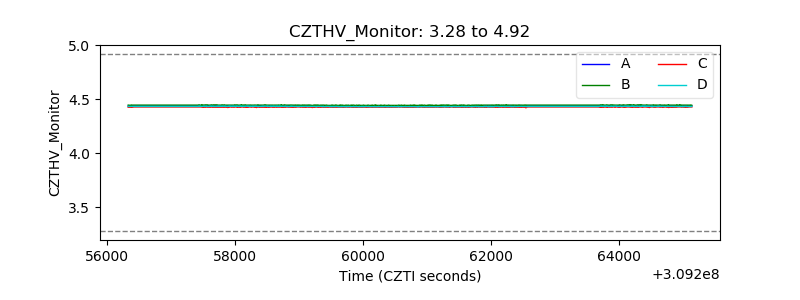 |
| D_VDD |  |
| Temperature 1 | 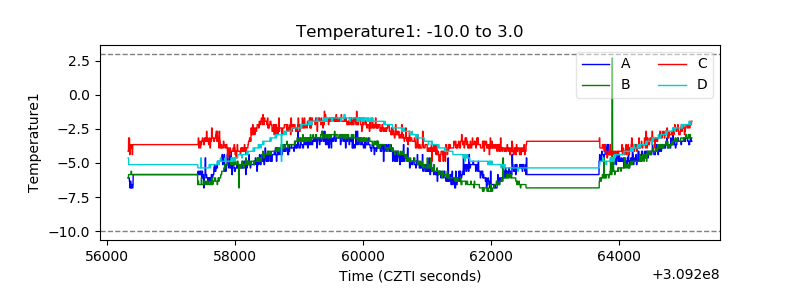 |
| Veto HV Monitor |  |
| Veto LLD | 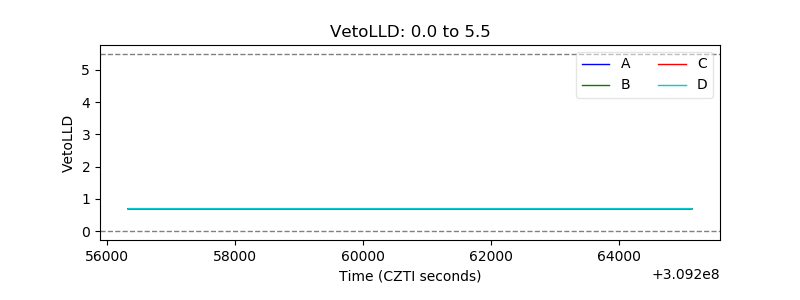 |
| Alpha Counter | 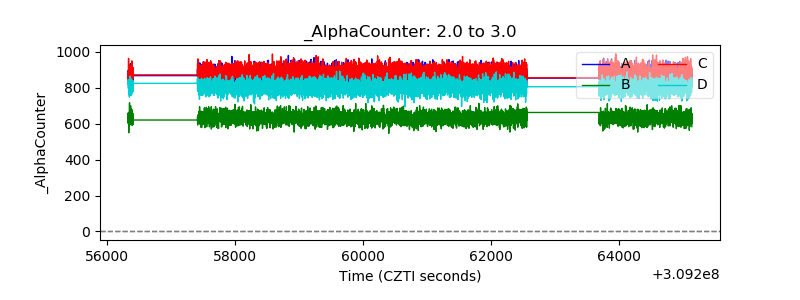 |
| _CPM_Rate | 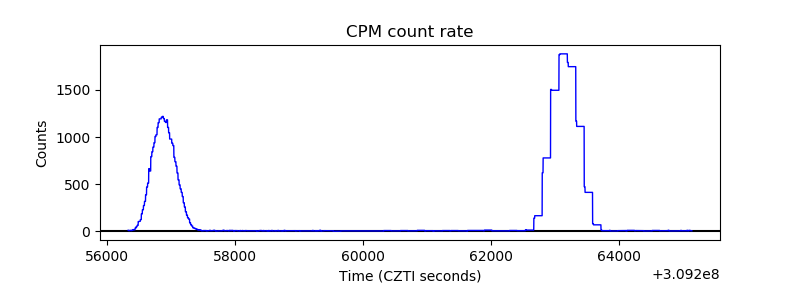 |
| CZT Counter | 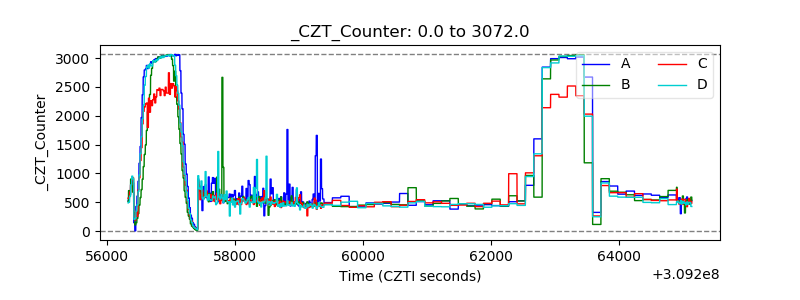 |
| +2.5 Volts monitor |  |
| +5 Volts monitor | 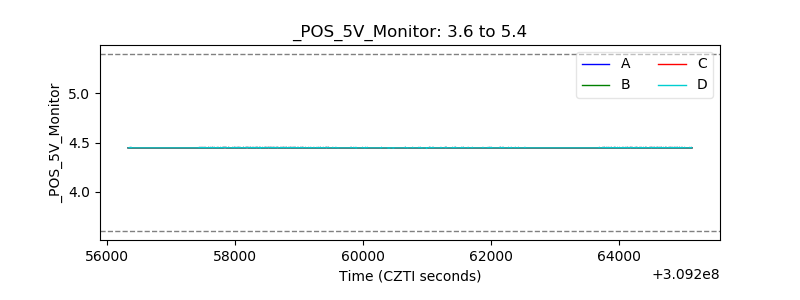 |
| _ROLL_ROT | 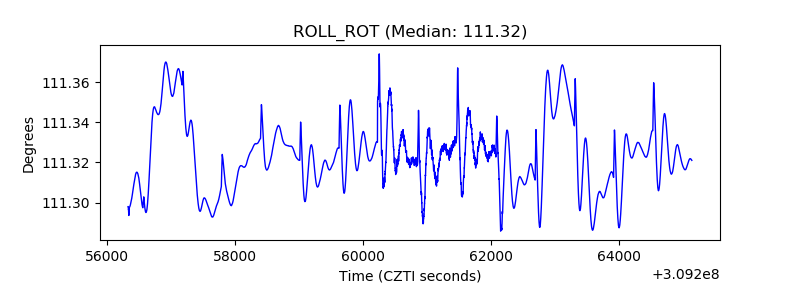 |
| _Roll_DEC | 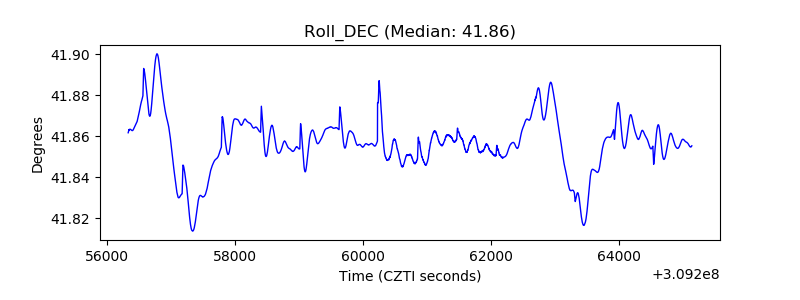 |
| _Roll_RA |  |
| Veto Counter | 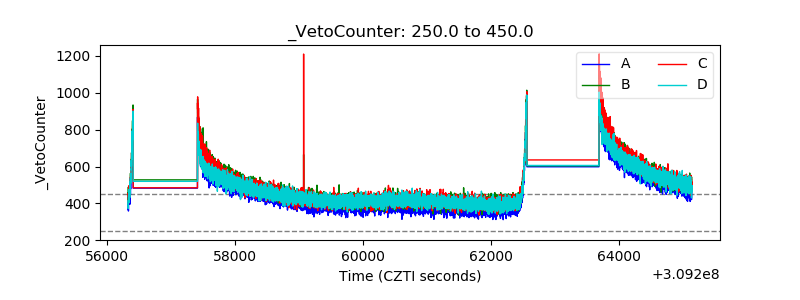 |