| Param | Original file | Final file |
|---|---|---|
| Filename | modeM0/AS1A07_007T02_9000003244_21956cztM0_level2.evt | modeM0/AS1A07_007T02_9000003244_21956cztM0_level2_quad_clean.evt |
| Size (bytes) | 531,722,880 | 105,168,960 |
| Size | 507.1 MB | 100.3 MB |
| Events in quadrant A | 4,186,385 | 684,567 |
| Events in quadrant B | 3,883,036 | 696,258 |
| Events in quadrant C | 3,804,073 | 661,562 |
| Events in quadrant D | 3,753,107 | 653,362 |
| Mode M0 | |||
|---|---|---|---|
| Quadrant | BADHDUFLAG | Total packets | Discarded packets |
| A | 0 | 17043 | 2 |
| B | 0 | 16066 | 2 |
| C | 0 | 15675 | 2 |
| D | 0 | 15509 | 2 |
| Mode M9 | |||
|---|---|---|---|
| Quadrant | BADHDUFLAG | Total packets | Discarded packets |
| A | 0 | 23 | 0 |
| B | 0 | 23 | 0 |
| C | 0 | 23 | 0 |
| D | 0 | 23 | 0 |
| Mode SS | |||
|---|---|---|---|
| Quadrant | BADHDUFLAG | Total packets | Discarded packets |
| A | 0 | 146 | 0 |
| B | 0 | 146 | 0 |
| C | 0 | 146 | 0 |
| D | 0 | 146 | 0 |
| Quadrant | Total seconds | Saturated seconds | Saturation percentage |
|---|---|---|---|
| A | 7021 | 157 | 2.236149% |
| B | 7022 | 162 | 2.307035% |
| C | 7022 | 175 | 2.492167% |
| D | 7022 | 100 | 1.424096% |
Noise dominated data is calculated using 1-second bins in cleaned event files. If a bin has >2000 counts, and if more than 50% of those come from <1% of pixels, then it is considered to be noise-dominated and hence unusable.
| Quadrant | # 1 sec bins | Bins with >0 counts | Bins with >2000 counts | High rate bins dominated by noise | Noise dominated (total time) | Noise dominated (detector-on time) | Marked lightcurve |
|---|---|---|---|---|---|---|---|
| A | 9386 | 7021 | 0 | 0 | 0.00% | 0.00% | 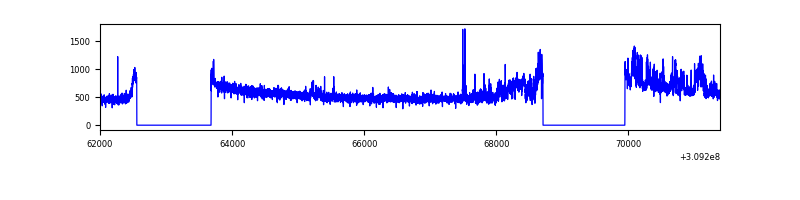 |
| B | 9387 | 7022 | 4 | 4 | 0.04% | 0.06% | 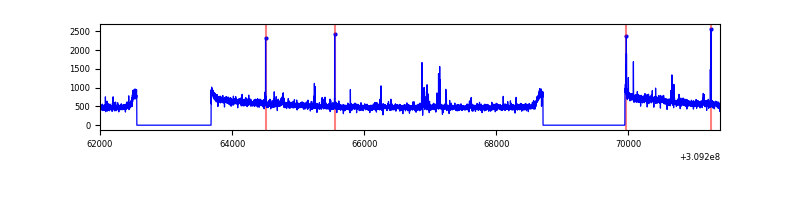 |
| C | 9387 | 7022 | 6 | 6 | 0.06% | 0.09% | 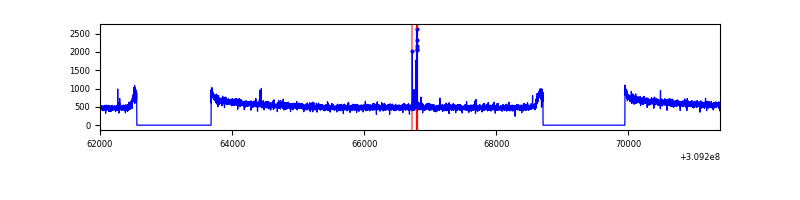 |
| D | 9387 | 7022 | 2 | 2 | 0.02% | 0.03% | 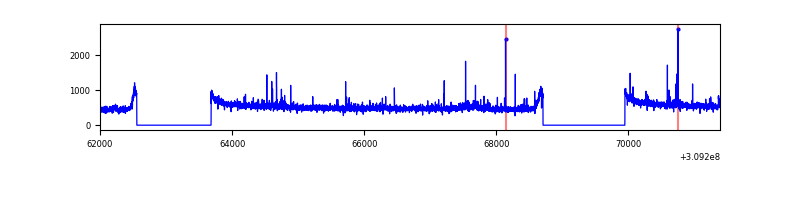 |
Top three noisy pixels from each quadrant. If the there are fewer than three noisy pixels in the level2.evt file, extra rows are filled as -1
| Pixel properties | Quadrant properties | ||||||
|---|---|---|---|---|---|---|---|
| Quadrant | DetID | PixID | Counts | Sigma | Mean | Median | Sigma |
| A | 2 | 79 | 376771 | 1935.55 | 982 | 967 | 194.2 |
| A | 4 | 2 | 27330 | 135.78 | 982 | 967 | 194.2 |
| A | 13 | 254 | 12149 | 57.59 | 982 | 967 | 194.2 |
| B | 3 | 64 | 48172 | 260.72 | 968 | 947 | 181.1 |
| B | 0 | 197 | 23662 | 125.4 | 968 | 947 | 181.1 |
| B | 12 | 111 | 21462 | 113.26 | 968 | 947 | 181.1 |
| C | 14 | 238 | 148718 | 687.35 | 931 | 938 | 215.0 |
| C | 10 | 22 | 24586 | 109.99 | 931 | 938 | 215.0 |
| C | 13 | 61 | 6535 | 26.03 | 931 | 938 | 215.0 |
| D | 2 | 136 | 47449 | 206.34 | 951 | 928 | 225.5 |
| D | 1 | 52 | 36109 | 156.04 | 951 | 928 | 225.5 |
| D | 13 | 254 | 29129 | 125.08 | 951 | 928 | 225.5 |
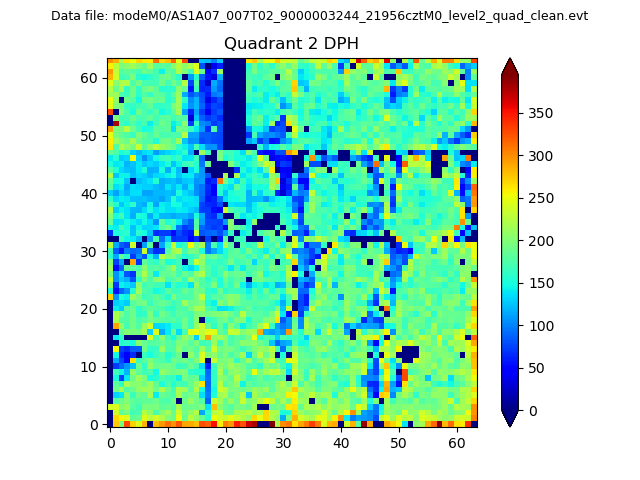
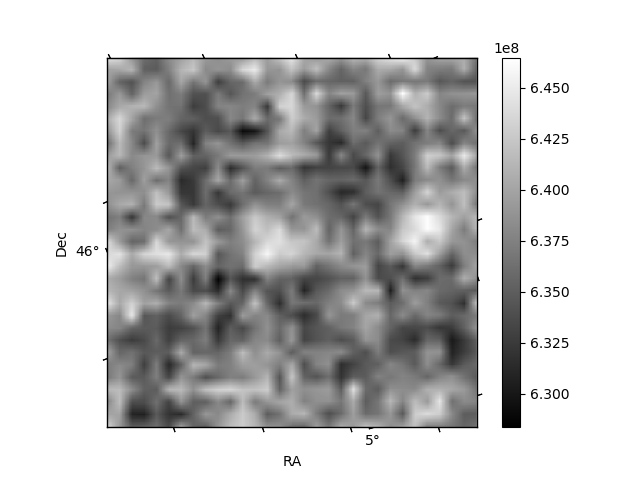
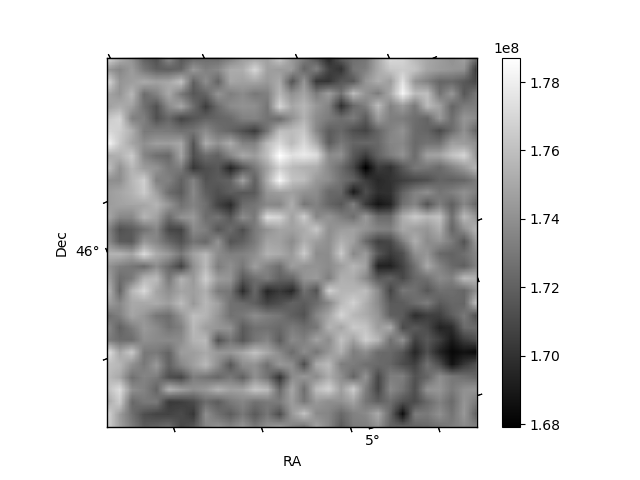
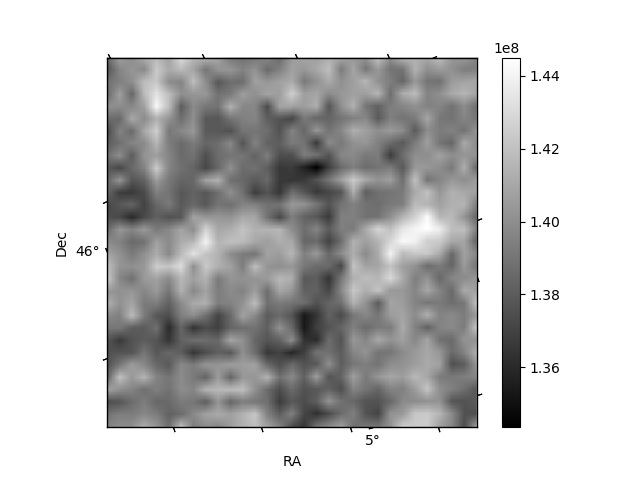
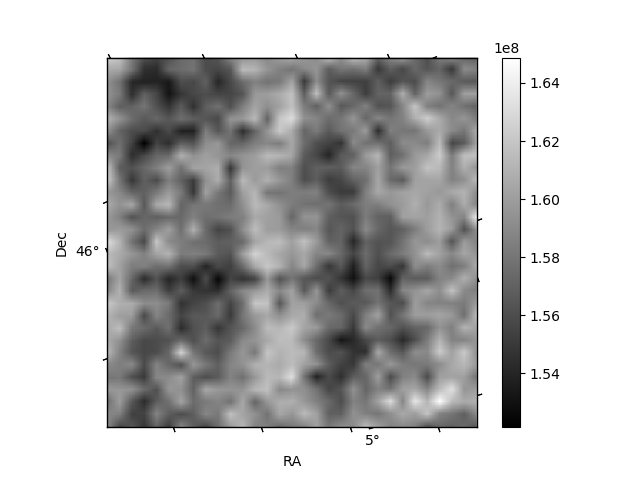
Histogram calculated using DETX and DETY for each event in the final _common_clean file
| Quadrant A | 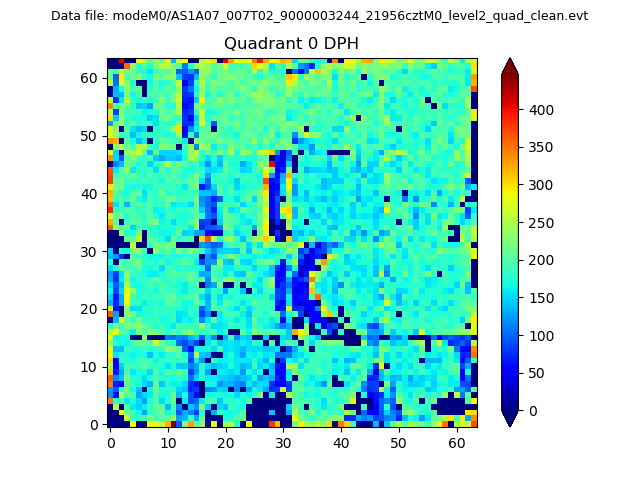 |
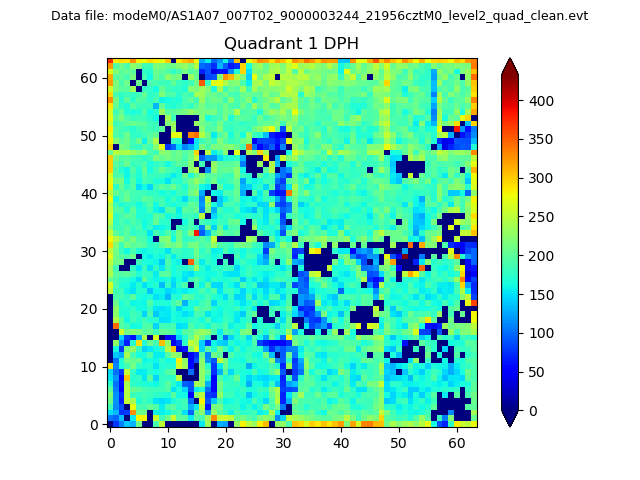 |
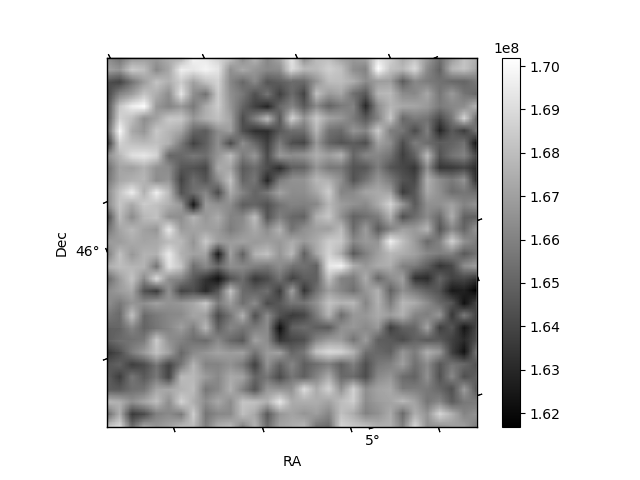
Quadrant B |
|---|---|---|---|
| Quadrant D | 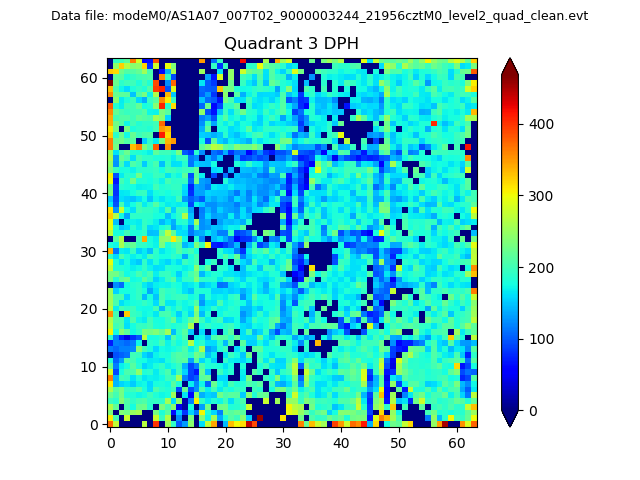 |
 |
Quadrant C |
| Plot type | Count rate plots | Images |
|---|---|---|
| Comparison with Poisson distribution Blue bars denote a histogram of data divided into 1 sec bins. Red curve is a Poisson curve with rate = median count rate of data. |
 |
 |
| Quadrant-wise count rates Data is divided into 100 sec bins |
 |
|
| Module-wise count rates for Quadrant A Data is divided into 100 sec bins |
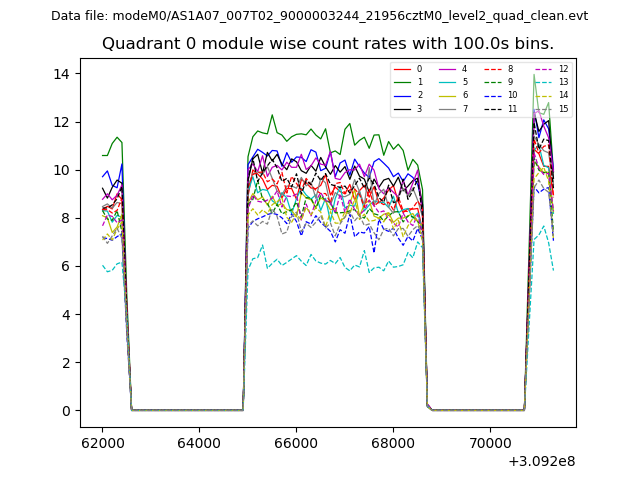 |
 |
| Module-wise count rates for Quadrant B Data is divided into 100 sec bins |
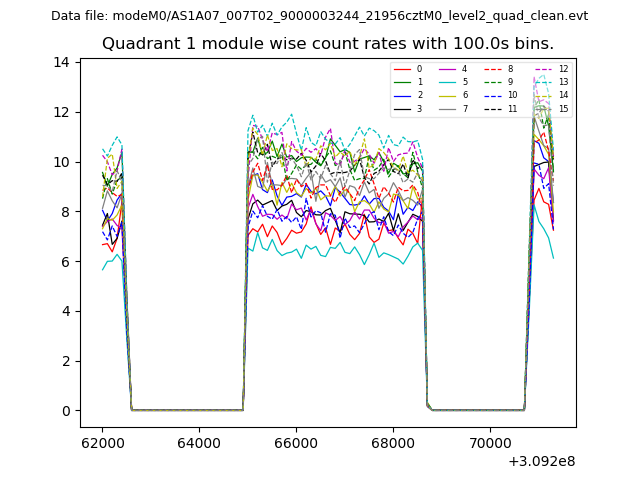 |
 |
| Module-wise count rates for Quadrant C Data is divided into 100 sec bins |
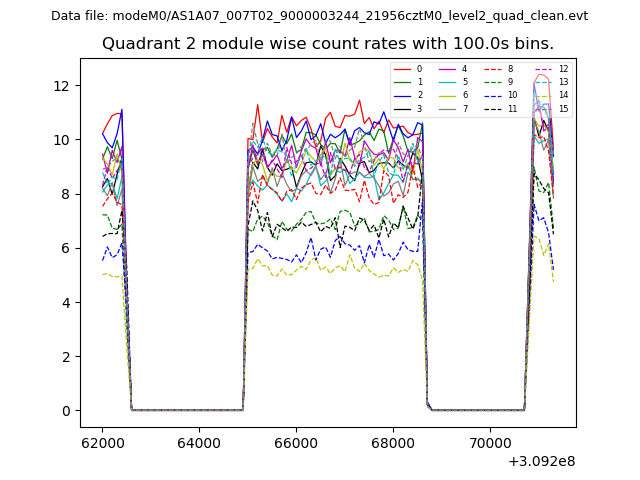 |
 |
| Module-wise count rates for Quadrant D Data is divided into 100 sec bins |
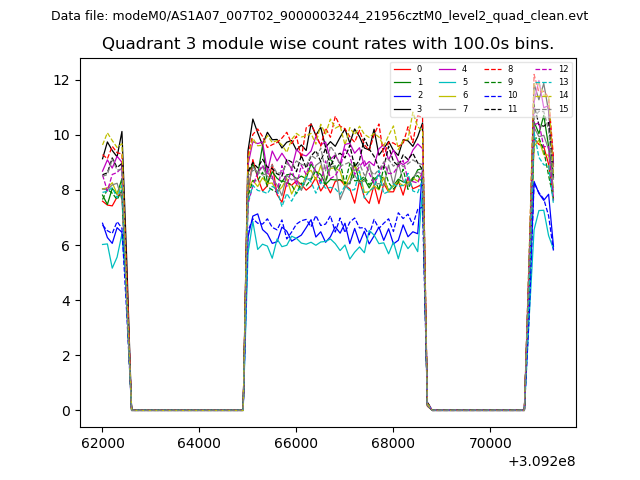 |
 |
| Parameter | Plot |
|---|---|
| CZT HV Monitor | 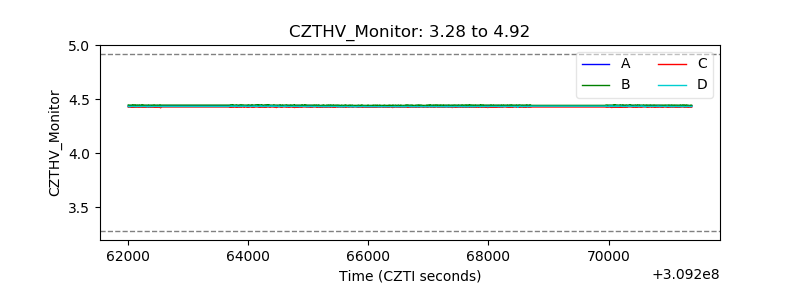 |
| D_VDD | 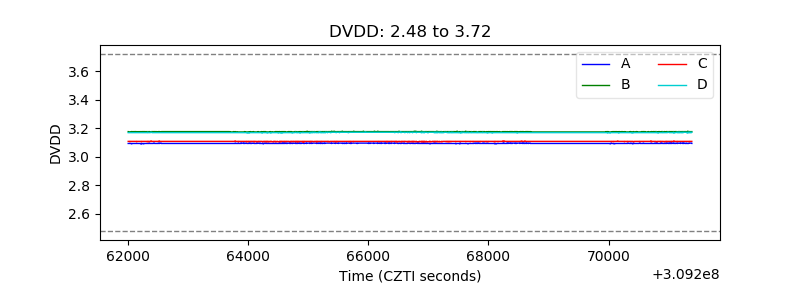 |
| Temperature 1 | 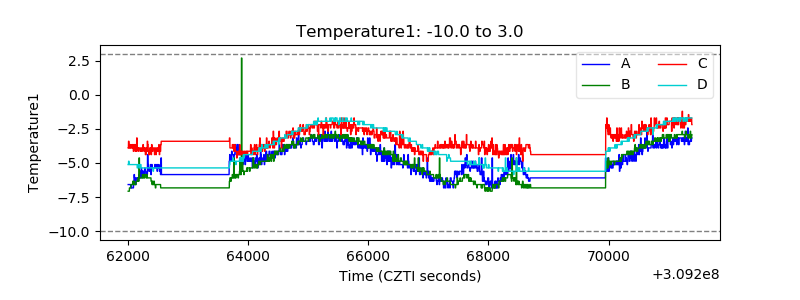 |
| Veto HV Monitor | 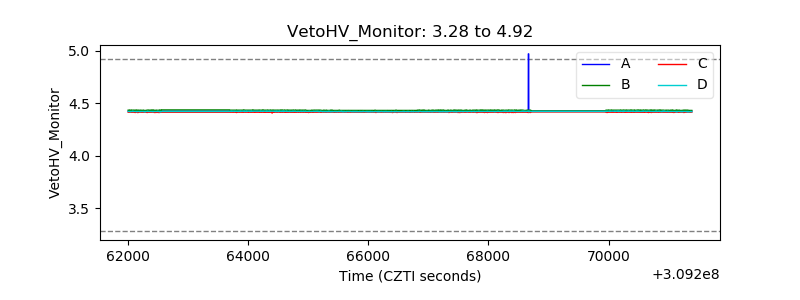 |
| Veto LLD | 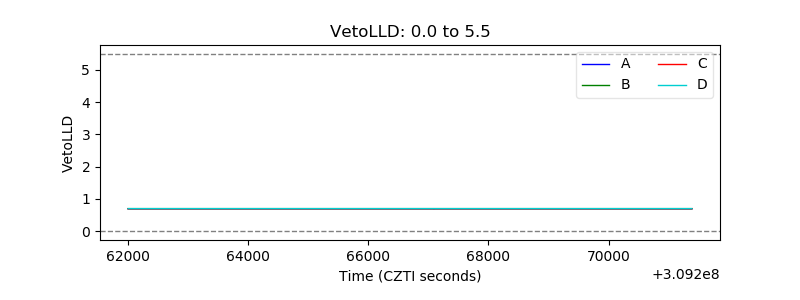 |
| Alpha Counter |  |
| _CPM_Rate |  |
| CZT Counter | 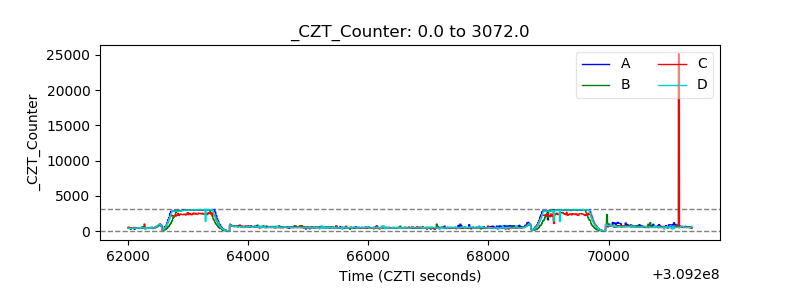 |
| +2.5 Volts monitor |  |
| +5 Volts monitor |  |
| _ROLL_ROT | 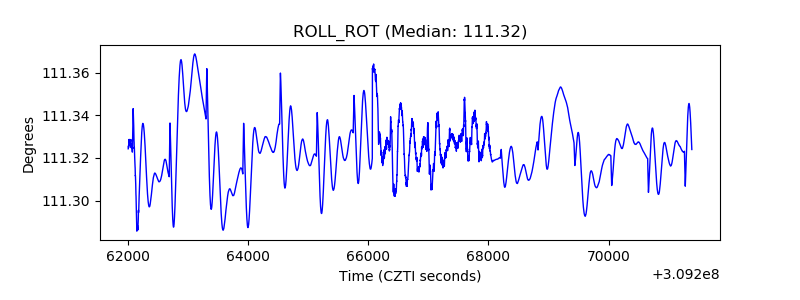 |
| _Roll_DEC | 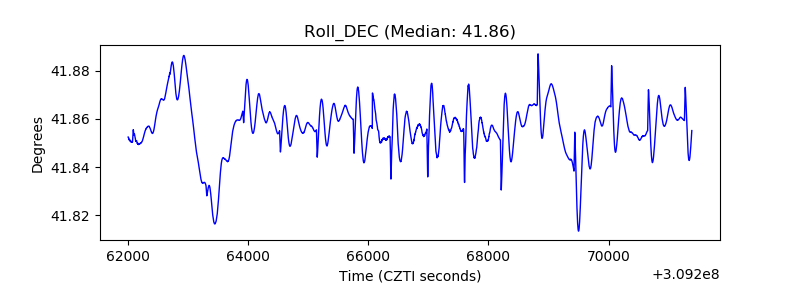 |
| _Roll_RA |  |
| Veto Counter | 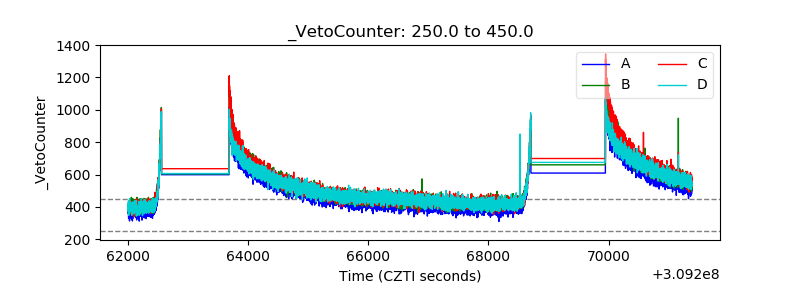 |