| Param | Original file | Final file |
|---|---|---|
| Filename | modeM0/AS1A07_007T02_9000003244_21960cztM0_level2.evt | modeM0/AS1A07_007T02_9000003244_21960cztM0_level2_quad_clean.evt |
| Size (bytes) | 154,454,400 | 43,413,120 |
| Size | 147.3 MB | 41.4 MB |
| Events in quadrant A | 1,020,715 | 296,074 |
| Events in quadrant B | 1,103,439 | 301,662 |
| Events in quadrant C | 1,046,177 | 292,226 |
| Events in quadrant D | 1,370,896 | 280,937 |
| Mode M0 | |||
|---|---|---|---|
| Quadrant | BADHDUFLAG | Total packets | Discarded packets |
| A | 0 | 4214 | 0 |
| B | 0 | 4502 | 0 |
| C | 0 | 4233 | 0 |
| D | 0 | 5491 | 0 |
| Mode SS | |||
|---|---|---|---|
| Quadrant | BADHDUFLAG | Total packets | Discarded packets |
| A | 0 | 40 | 0 |
| B | 0 | 40 | 0 |
| C | 0 | 40 | 0 |
| D | 0 | 40 | 0 |
| Quadrant | Total seconds | Saturated seconds | Saturation percentage |
|---|---|---|---|
| A | 1969 | 4 | 0.203149% |
| B | 1970 | 11 | 0.558376% |
| C | 1970 | 10 | 0.507614% |
| D | 1970 | 31 | 1.573604% |
Noise dominated data is calculated using 1-second bins in cleaned event files. If a bin has >2000 counts, and if more than 50% of those come from <1% of pixels, then it is considered to be noise-dominated and hence unusable.
| Quadrant | # 1 sec bins | Bins with >0 counts | Bins with >2000 counts | High rate bins dominated by noise | Noise dominated (total time) | Noise dominated (detector-on time) | Marked lightcurve |
|---|---|---|---|---|---|---|---|
| A | 1969 | 1969 | 0 | 0 | 0.00% | 0.00% | 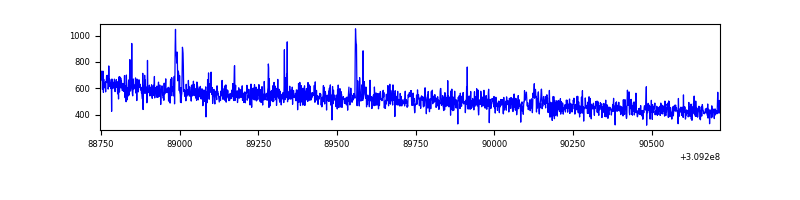 |
| B | 1970 | 1970 | 6 | 6 | 0.30% | 0.30% | 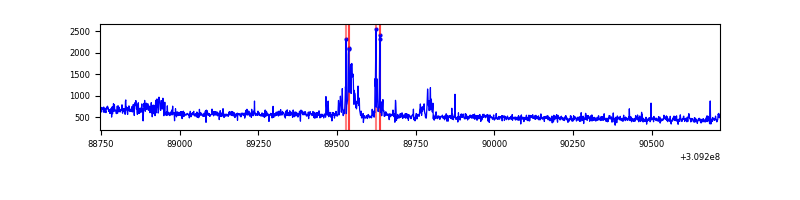 |
| C | 1970 | 1970 | 0 | 0 | 0.00% | 0.00% | 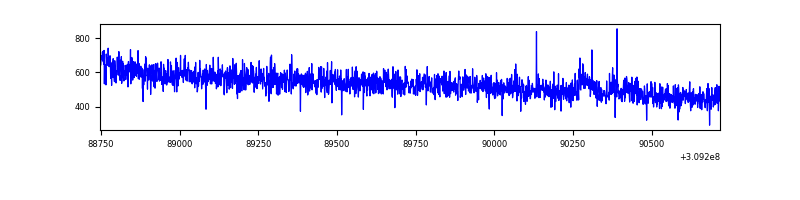 |
| D | 1970 | 1970 | 35 | 35 | 1.78% | 1.78% | 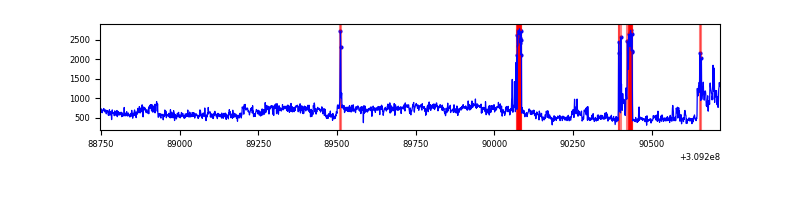 |
Top three noisy pixels from each quadrant. If the there are fewer than three noisy pixels in the level2.evt file, extra rows are filled as -1
| Pixel properties | Quadrant properties | ||||||
|---|---|---|---|---|---|---|---|
| Quadrant | DetID | PixID | Counts | Sigma | Mean | Median | Sigma |
| A | 2 | 79 | 16645 | 303.91 | 260 | 255 | 53.9 |
| A | 13 | 254 | 3401 | 58.33 | 260 | 255 | 53.9 |
| A | 0 | 226 | 2186 | 35.8 | 260 | 255 | 53.9 |
| B | 3 | 64 | 68838 | 1373.56 | 257 | 251 | 49.9 |
| B | 0 | 197 | 21837 | 432.29 | 257 | 251 | 49.9 |
| B | 0 | 230 | 7114 | 137.44 | 257 | 251 | 49.9 |
| C | 14 | 238 | 40787 | 666.47 | 256 | 258 | 60.8 |
| C | 9 | 54 | 4912 | 76.53 | 256 | 258 | 60.8 |
| C | 10 | 22 | 2248 | 32.72 | 256 | 258 | 60.8 |
| D | 1 | 52 | 235543 | 3716.31 | 259 | 252 | 63.3 |
| D | 13 | 174 | 150615 | 2374.92 | 259 | 252 | 63.3 |
| D | 2 | 234 | 7985 | 122.14 | 259 | 252 | 63.3 |
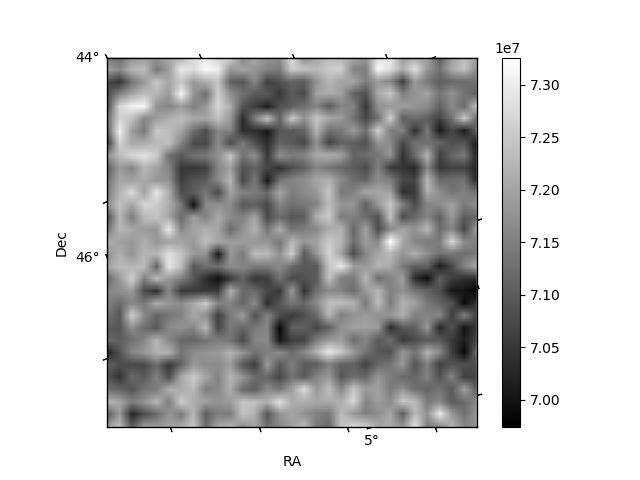
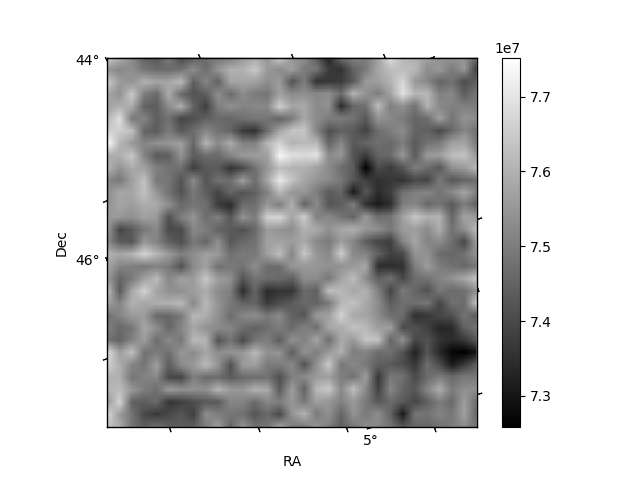
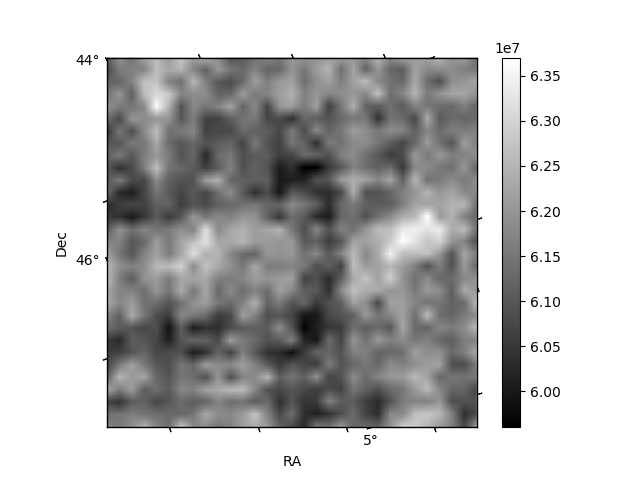
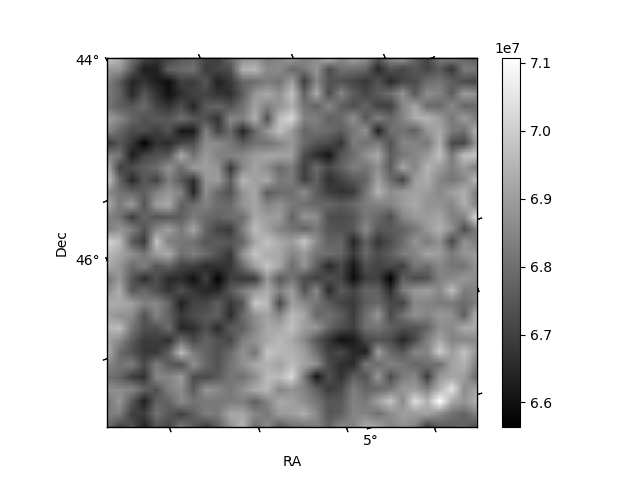
Histogram calculated using DETX and DETY for each event in the final _common_clean file
| Quadrant A |  |
 |
Quadrant B |
|---|---|---|---|
| Quadrant D |  |
 |
Quadrant C |
| Plot type | Count rate plots | Images |
|---|---|---|
| Comparison with Poisson distribution Blue bars denote a histogram of data divided into 1 sec bins. Red curve is a Poisson curve with rate = median count rate of data. |
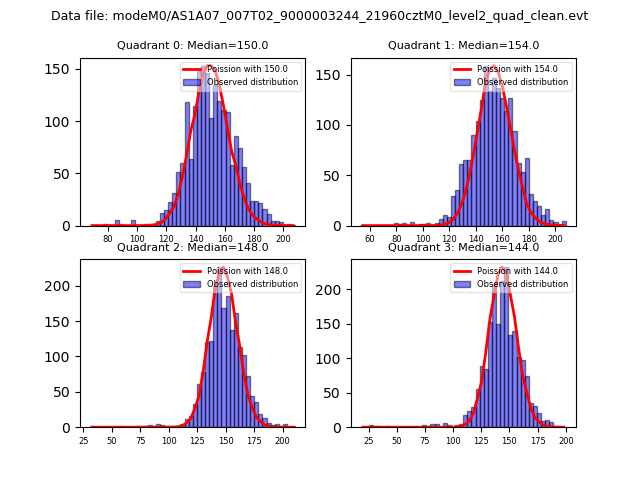 |
 |
| Quadrant-wise count rates Data is divided into 100 sec bins |
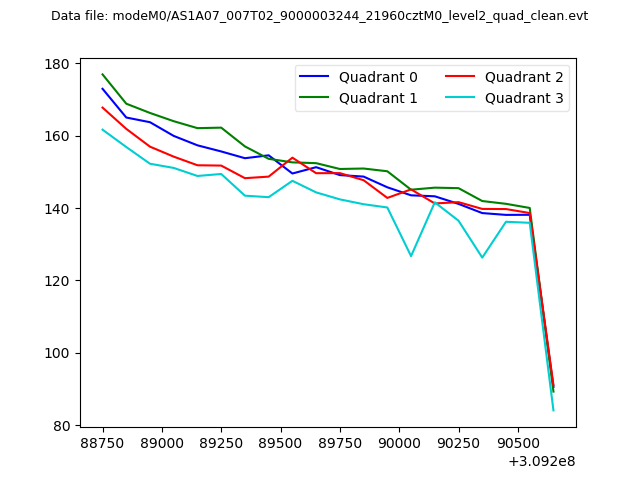 |
|
| Module-wise count rates for Quadrant A Data is divided into 100 sec bins |
 |
 |
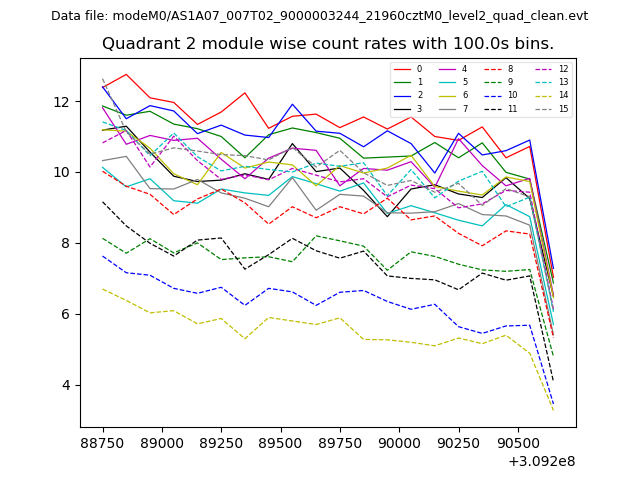
| Module-wise count rates for Quadrant B Data is divided into 100 sec bins |
 |
 |
| Module-wise count rates for Quadrant C Data is divided into 100 sec bins |
 |
 |
| Module-wise count rates for Quadrant D Data is divided into 100 sec bins |
 |
 |
| Parameter | Plot |
|---|---|
| CZT HV Monitor |  |
| D_VDD |  |
| Temperature 1 |  |
| Veto HV Monitor |  |
| Veto LLD |  |
| Alpha Counter | 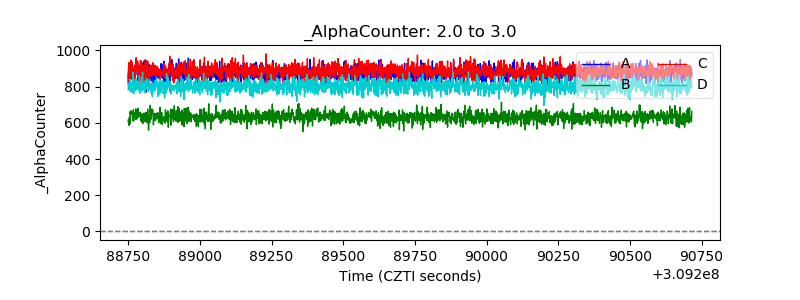 |
| _CPM_Rate | 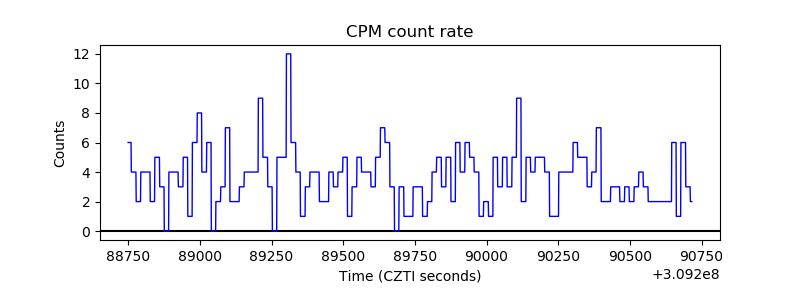 |
| CZT Counter |  |
| +2.5 Volts monitor |  |
| +5 Volts monitor |  |
| _ROLL_ROT |  |
| _Roll_DEC |  |
| _Roll_RA |  |
| Veto Counter |  |