| Param | Original file | Final file |
|---|---|---|
| Filename | modeM0/AS1A07_130T01_9000003246cztM0_level2.fits | modeM0/AS1A07_130T01_9000003246cztM0_level2_quad_clean.evt |
| Size (bytes) | 603,192,960 | 531,895,680 |
| Size | 575.2 MB | 507.3 MB |
| Events in quadrant A | 3,739,644 | 3,110,933 |
| Events in quadrant B | 3,564,038 | 3,134,777 |
| Events in quadrant C | 3,637,668 | 3,001,893 |
| Events in quadrant D | 3,169,910 | 2,703,601 |
| Mode M0 | |||
|---|---|---|---|
| Quadrant | BADHDUFLAG | Total packets | Discarded packets |
| A | 0 | 126701 | 0 |
| B | 0 | 132623 | 0 |
| C | 0 | 126283 | 0 |
| D | 0 | 148777 | 0 |
| Mode SS | |||
|---|---|---|---|
| Quadrant | BADHDUFLAG | Total packets | Discarded packets |
| A | 0 | 1234 | 0 |
| B | 0 | 1234 | 0 |
| C | 0 | 1234 | 0 |
| D | 0 | 1234 | 0 |
| Mode M9 | |||
|---|---|---|---|
| Quadrant | BADHDUFLAG | Total packets | Discarded packets |
| A | 0 | 85 | 0 |
| B | 0 | 85 | 0 |
| C | 0 | 85 | 0 |
| D | 0 | 85 | 0 |
| Quadrant | Total seconds | Saturated seconds | Saturation percentage |
|---|---|---|---|
| A | 60594 | 520 | 0.858171% |
| B | 60594 | 1177 | 1.942437% |
| C | 60594 | 810 | 1.336766% |
| D | 60594 | 2195 | 3.622471% |
Noise dominated data is calculated using 1-second bins in cleaned event files. If a bin has >2000 counts, and if more than 50% of those come from <1% of pixels, then it is considered to be noise-dominated and hence unusable.
| Quadrant | # 1 sec bins | Bins with >0 counts | Bins with >2000 counts | High rate bins dominated by noise | Noise dominated (total time) | Noise dominated (detector-on time) | Marked lightcurve |
|---|---|---|---|---|---|---|---|
| A | 69119 | 60586 | 0 | 0 | 0.00% | 0.00% | 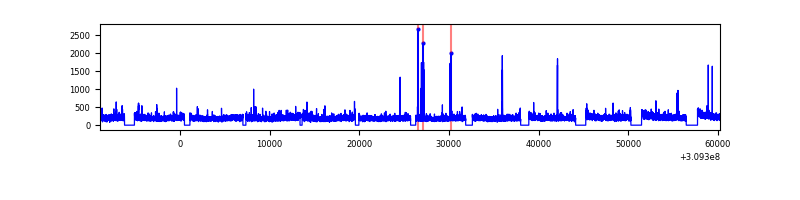 |
| B | 69119 | 60563 | 0 | 0 | 0.00% | 0.00% |  |
| C | 69119 | 60585 | 0 | 0 | 0.00% | 0.00% | 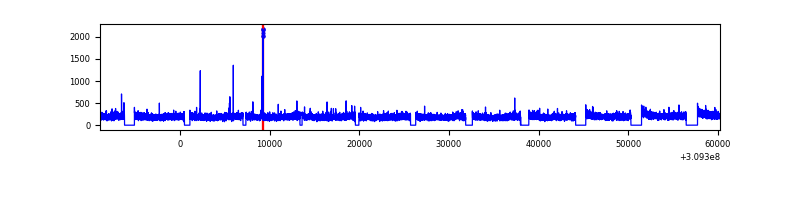 |
| D | 69119 | 60569 | 0 | 0 | 0.00% | 0.00% |  |
Top three noisy pixels from each quadrant. If the there are fewer than three noisy pixels in the level2.evt file, extra rows are filled as -1
| Pixel properties | Quadrant properties | ||||||
|---|---|---|---|---|---|---|---|
| Quadrant | DetID | PixID | Counts | Sigma | Mean | Median | Sigma |
| A | 0 | 29 | 3511 | 10.89 | 973 | 913 | 238.6 |
| A | 7 | 110 | 2973 | 8.64 | 973 | 913 | 238.6 |
| A | 0 | 30 | 2739 | 7.65 | 973 | 913 | 238.6 |
| B | 2 | 9 | 2774 | 10.17 | 939 | 897 | 184.6 |
| B | 2 | 8 | 2404 | 8.17 | 939 | 897 | 184.6 |
| B | 5 | 128 | 2330 | 7.76 | 939 | 897 | 184.6 |
| C | 12 | 241 | 2535 | 6.65 | 960 | 897 | 246.1 |
| C | 3 | 234 | 2523 | 6.61 | 960 | 897 | 246.1 |
| C | 3 | 126 | 2453 | 6.32 | 960 | 897 | 246.1 |
| D | 3 | 14 | 2298 | 6.16 | 904 | 823 | 239.4 |
| D | 6 | 231 | 2246 | 5.94 | 904 | 823 | 239.4 |
| D | 10 | 189 | 2199 | 5.75 | 904 | 823 | 239.4 |
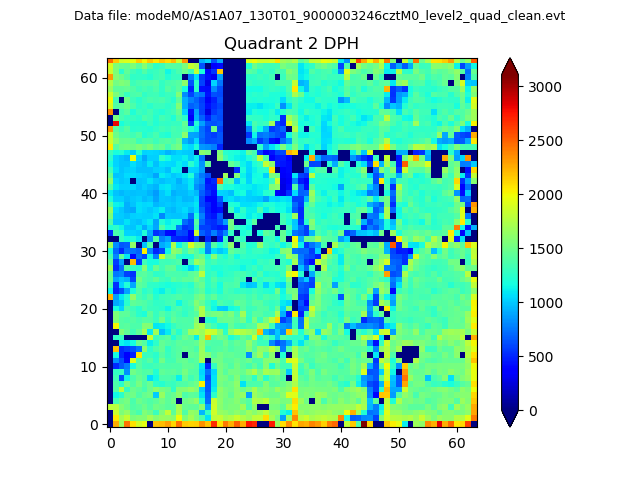
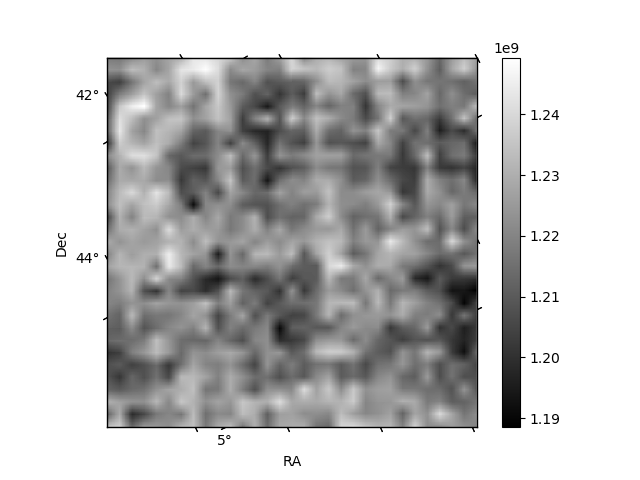
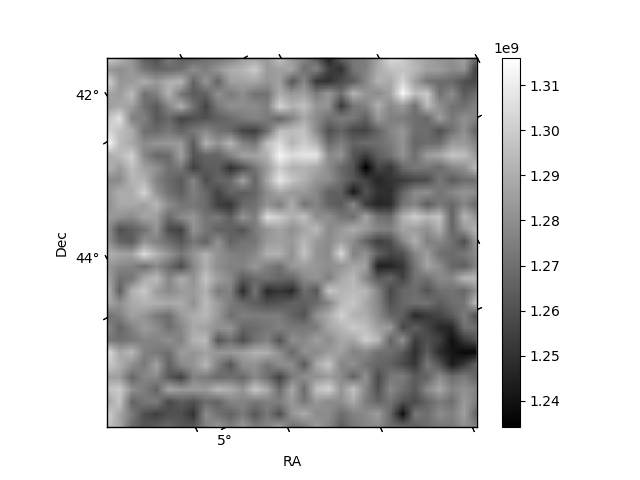
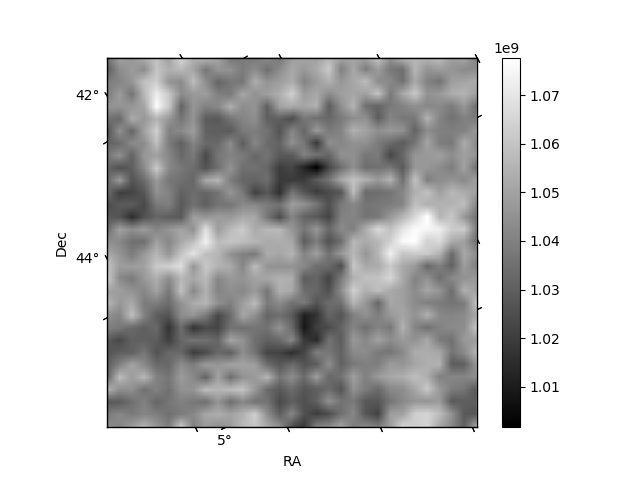
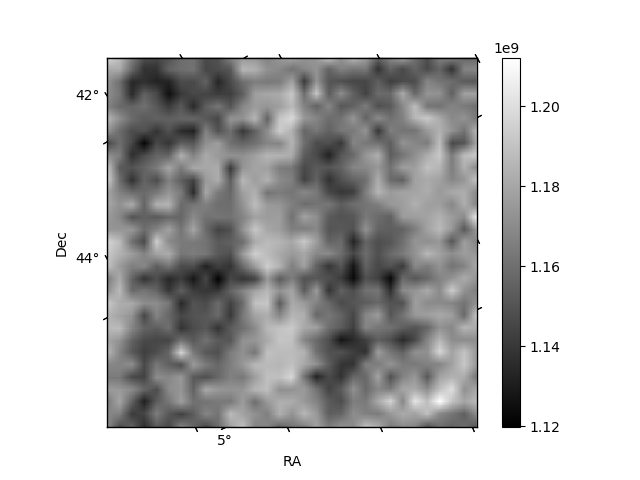
Histogram calculated using DETX and DETY for each event in the final _common_clean file
| Quadrant A | 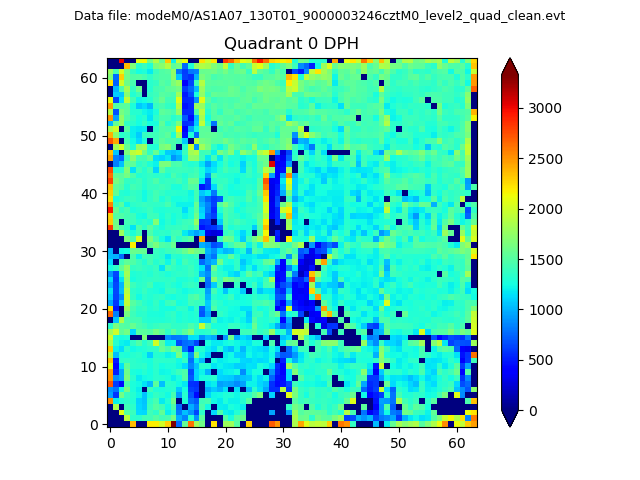 |
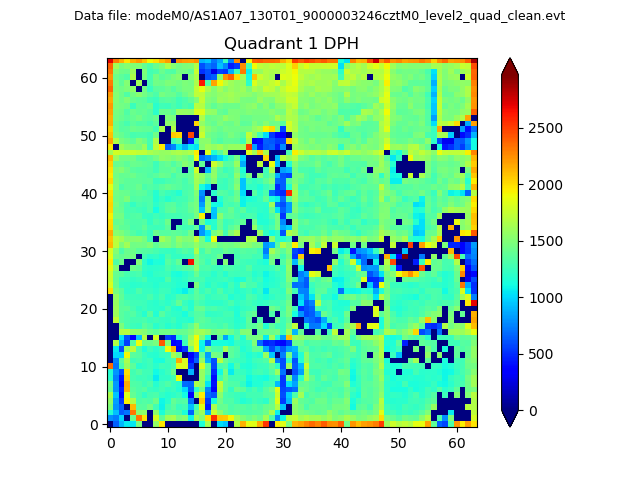 |
Quadrant B |
|---|---|---|---|
| Quadrant D | 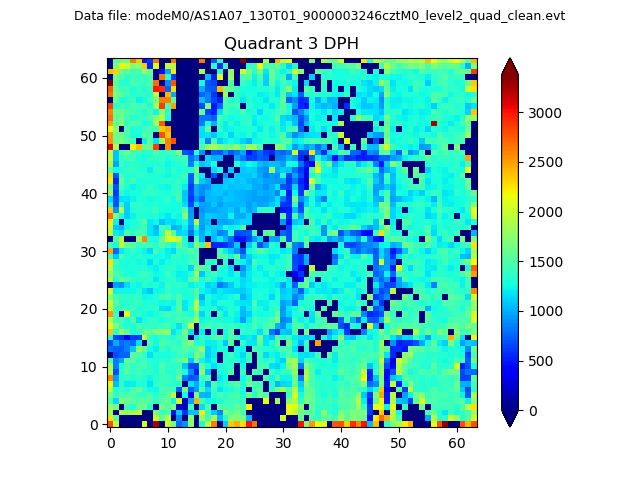 |
 |
Quadrant C |
| Plot type | Count rate plots | Images |
|---|---|---|
| Comparison with Poisson distribution Blue bars denote a histogram of data divided into 1 sec bins. Red curve is a Poisson curve with rate = median count rate of data. |
 |
 |
| Quadrant-wise count rates Data is divided into 100 sec bins |
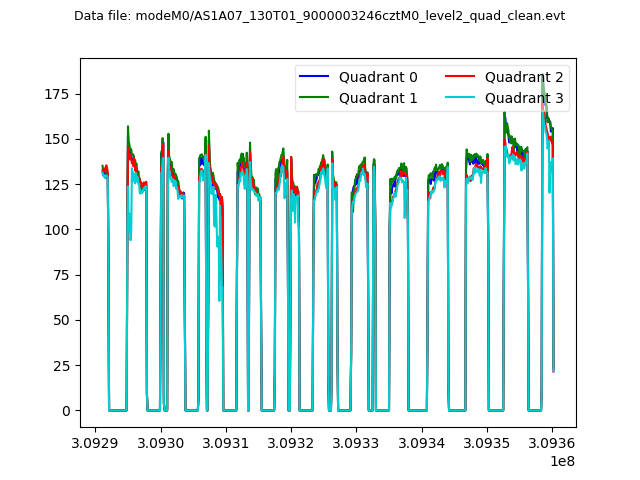 |
|
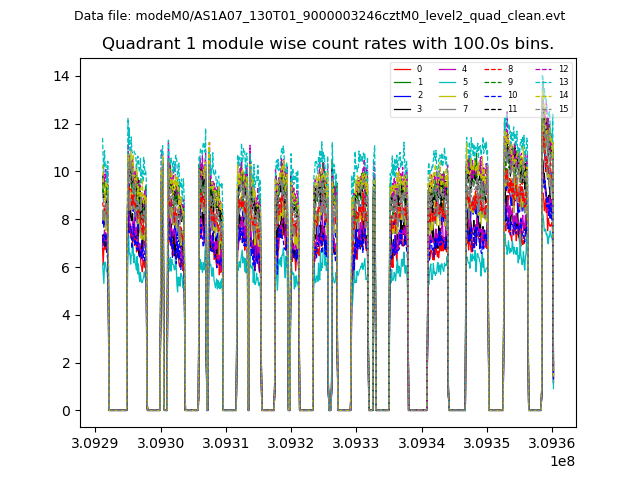
| Module-wise count rates for Quadrant A Data is divided into 100 sec bins |
 |
 |
| Module-wise count rates for Quadrant B Data is divided into 100 sec bins |
 |
 |
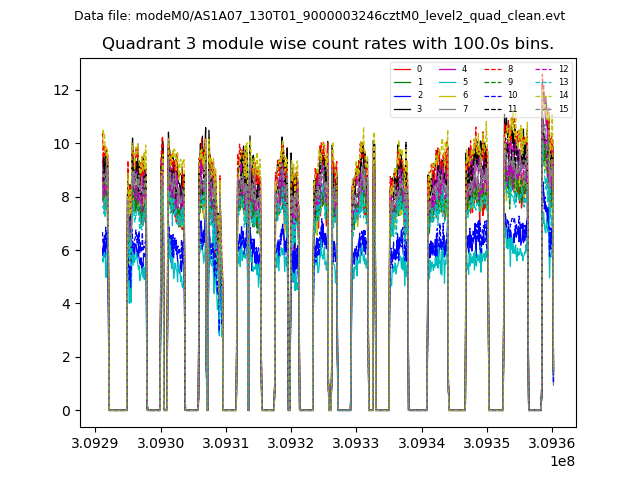
| Module-wise count rates for Quadrant C Data is divided into 100 sec bins |
 |
 |
| Module-wise count rates for Quadrant D Data is divided into 100 sec bins |
 |
 |
| Parameter | Plot |
|---|---|
| CZT HV Monitor | 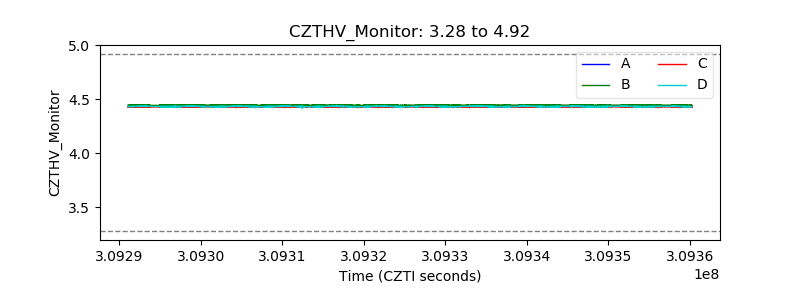 |
| D_VDD | 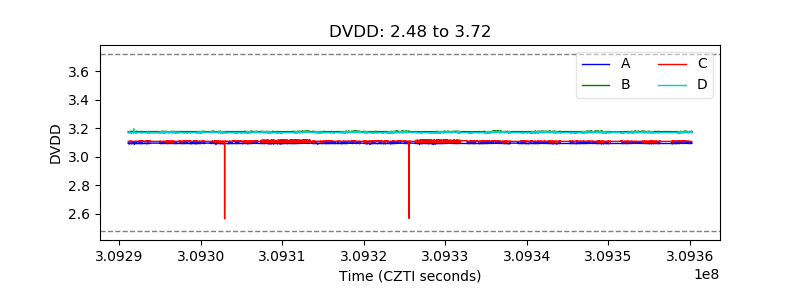 |
| Temperature 1 | 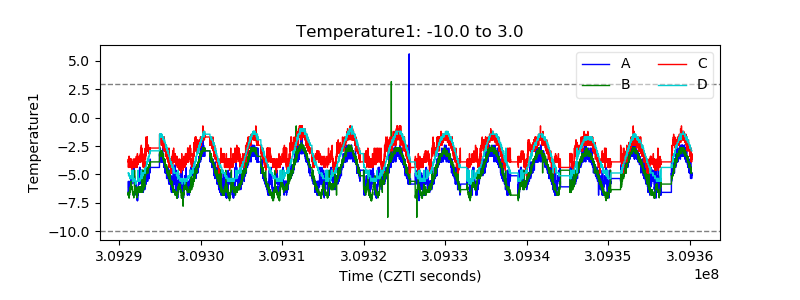 |
| Veto HV Monitor |  |
| Veto LLD | 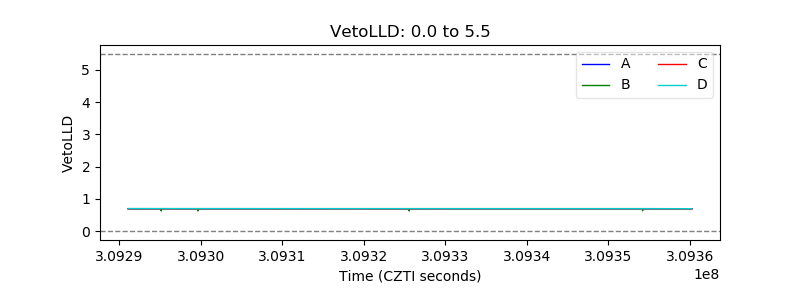 |
| Alpha Counter |  |
| _CPM_Rate | 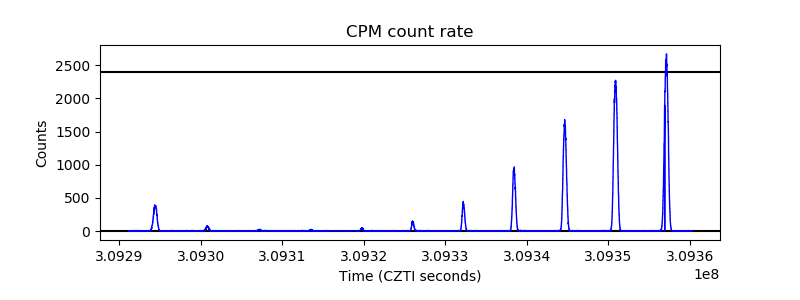 |
| CZT Counter |  |
| +2.5 Volts monitor |  |
| +5 Volts monitor |  |
| _ROLL_ROT | 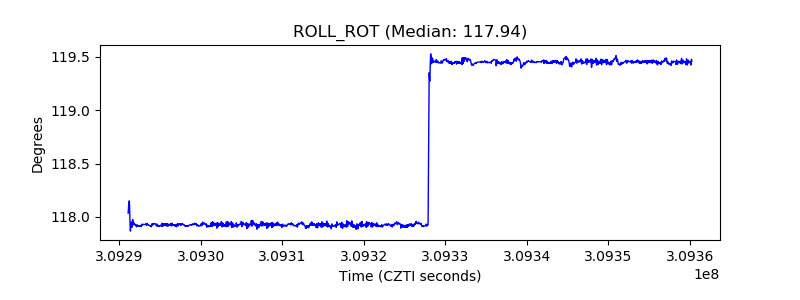 |
| _Roll_DEC | 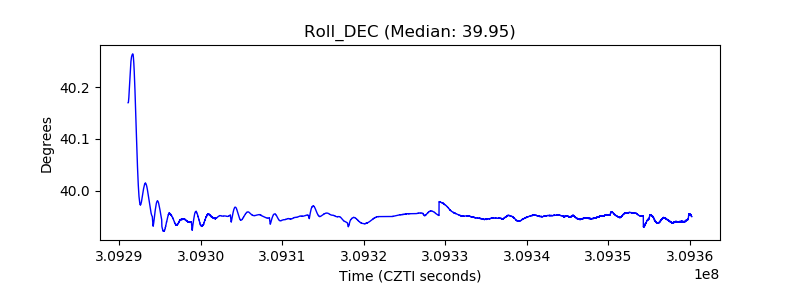 |
| _Roll_RA | 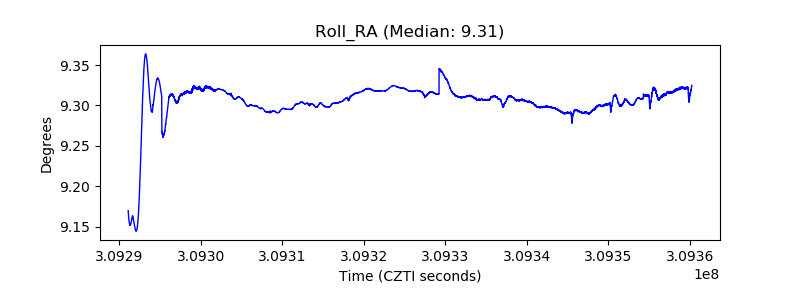 |
| Veto Counter |  |