| Param | Original file | Final file |
|---|---|---|
| Filename | modeM0/AS1A07_130T01_9000003246_21960cztM0_level2.evt | modeM0/AS1A07_130T01_9000003246_21960cztM0_level2_quad_clean.evt |
| Size (bytes) | 320,734,080 | 49,924,800 |
| Size | 305.9 MB | 47.6 MB |
| Events in quadrant A | 1,993,173 | 312,387 |
| Events in quadrant B | 2,468,513 | 317,959 |
| Events in quadrant C | 2,017,551 | 312,612 |
| Events in quadrant D | 2,958,293 | 283,146 |
| Mode M0 | |||
|---|---|---|---|
| Quadrant | BADHDUFLAG | Total packets | Discarded packets |
| A | 0 | 8491 | 1 |
| B | 0 | 9863 | 1 |
| C | 0 | 8451 | 1 |
| D | 0 | 11472 | 1 |
| Mode SS | |||
|---|---|---|---|
| Quadrant | BADHDUFLAG | Total packets | Discarded packets |
| A | 0 | 82 | 0 |
| B | 0 | 82 | 0 |
| C | 0 | 82 | 0 |
| D | 0 | 82 | 0 |
| Mode M9 | |||
|---|---|---|---|
| Quadrant | BADHDUFLAG | Total packets | Discarded packets |
| A | 0 | 11 | 0 |
| B | 0 | 11 | 0 |
| C | 0 | 11 | 0 |
| D | 0 | 11 | 0 |
| Quadrant | Total seconds | Saturated seconds | Saturation percentage |
|---|---|---|---|
| A | 4044 | 14 | 0.346192% |
| B | 4044 | 244 | 6.033630% |
| C | 4044 | 55 | 1.360040% |
| D | 4044 | 358 | 8.852621% |
Noise dominated data is calculated using 1-second bins in cleaned event files. If a bin has >2000 counts, and if more than 50% of those come from <1% of pixels, then it is considered to be noise-dominated and hence unusable.
| Quadrant | # 1 sec bins | Bins with >0 counts | Bins with >2000 counts | High rate bins dominated by noise | Noise dominated (total time) | Noise dominated (detector-on time) | Marked lightcurve |
|---|---|---|---|---|---|---|---|
| A | 5154 | 4045 | 0 | 0 | 0.00% | 0.00% | 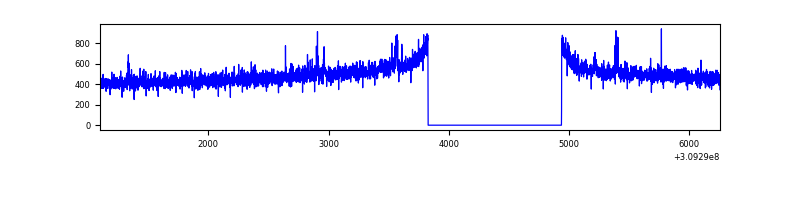 |
| B | 5154 | 4045 | 167 | 167 | 3.24% | 4.13% | 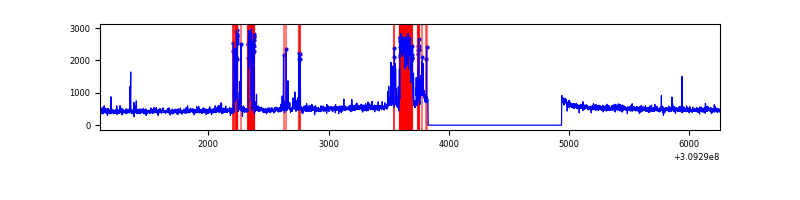 |
| C | 5154 | 4044 | 0 | 0 | 0.00% | 0.00% | 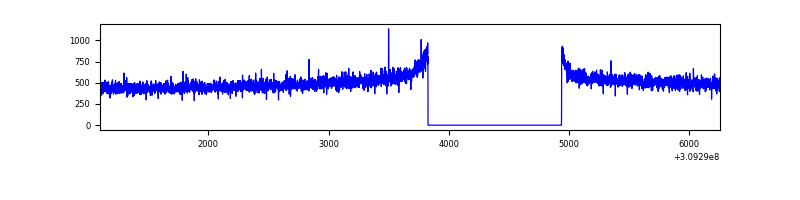 |
| D | 5154 | 4045 | 314 | 314 | 6.09% | 7.76% | 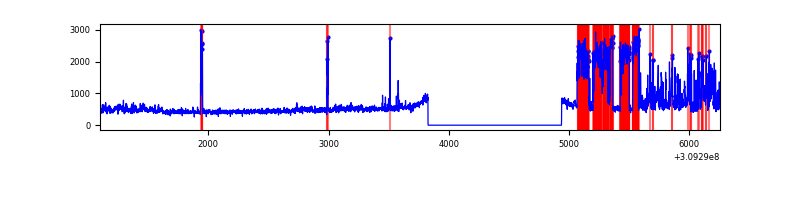 |
Top three noisy pixels from each quadrant. If the there are fewer than three noisy pixels in the level2.evt file, extra rows are filled as -1
| Pixel properties | Quadrant properties | ||||||
|---|---|---|---|---|---|---|---|
| Quadrant | DetID | PixID | Counts | Sigma | Mean | Median | Sigma |
| A | 2 | 79 | 27811 | 263.73 | 509 | 498 | 103.6 |
| A | 13 | 254 | 6757 | 60.44 | 509 | 498 | 103.6 |
| A | 0 | 226 | 4359 | 37.28 | 509 | 498 | 103.6 |
| B | 3 | 64 | 516981 | 5478.02 | 492 | 478 | 94.3 |
| B | 12 | 111 | 11273 | 114.49 | 492 | 478 | 94.3 |
| B | 0 | 229 | 11157 | 113.26 | 492 | 478 | 94.3 |
| C | 14 | 238 | 78082 | 664.43 | 496 | 501 | 116.8 |
| C | 13 | 61 | 3397 | 24.8 | 496 | 501 | 116.8 |
| C | 0 | 10 | 2023 | 13.03 | 496 | 501 | 116.8 |
| D | 13 | 174 | 901362 | 7666.83 | 484 | 470 | 117.5 |
| D | 2 | 136 | 128400 | 1088.72 | 484 | 470 | 117.5 |
| D | 1 | 52 | 102216 | 865.89 | 484 | 470 | 117.5 |
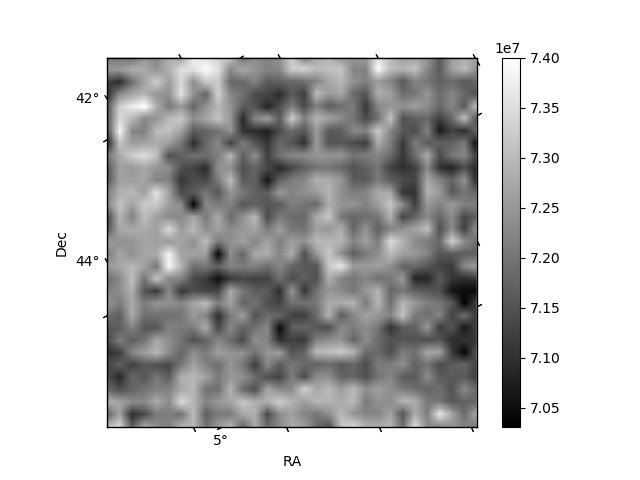
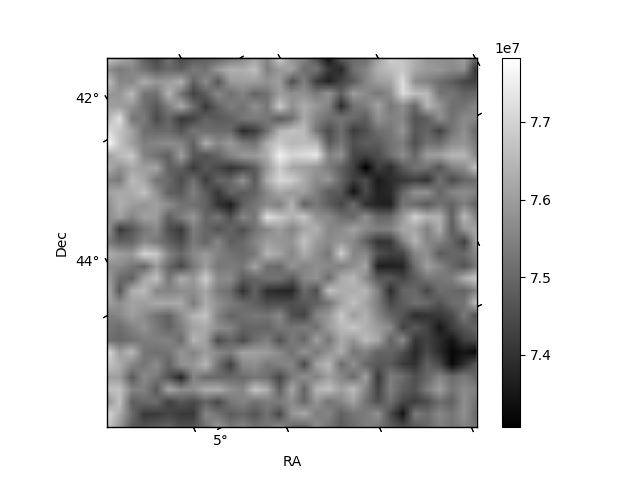
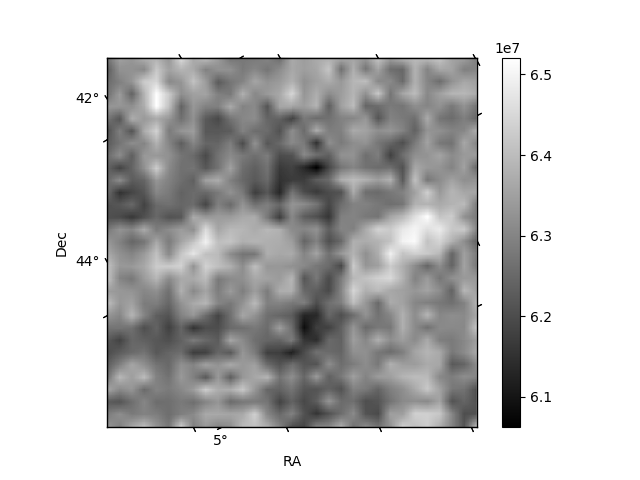
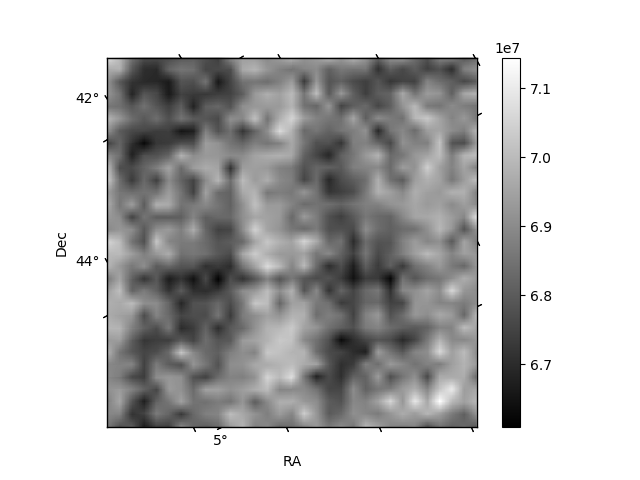
Histogram calculated using DETX and DETY for each event in the final _common_clean file
| Quadrant A |  |
 |
Quadrant B |
|---|---|---|---|
| Quadrant D |  |
 |
Quadrant C |
| Plot type | Count rate plots | Images |
|---|---|---|
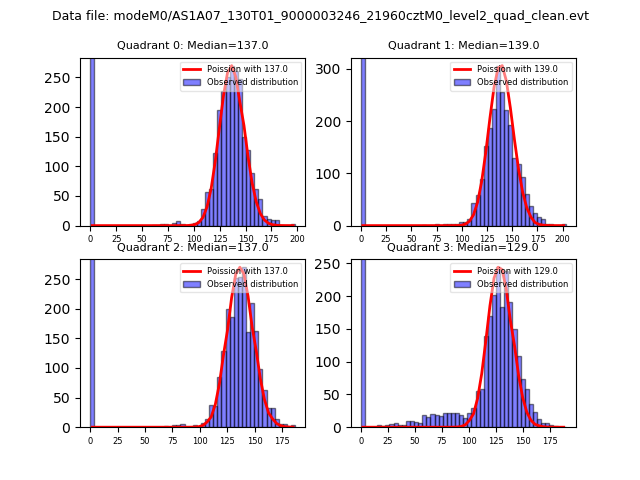
| Comparison with Poisson distribution Blue bars denote a histogram of data divided into 1 sec bins. Red curve is a Poisson curve with rate = median count rate of data. |
 |
 |
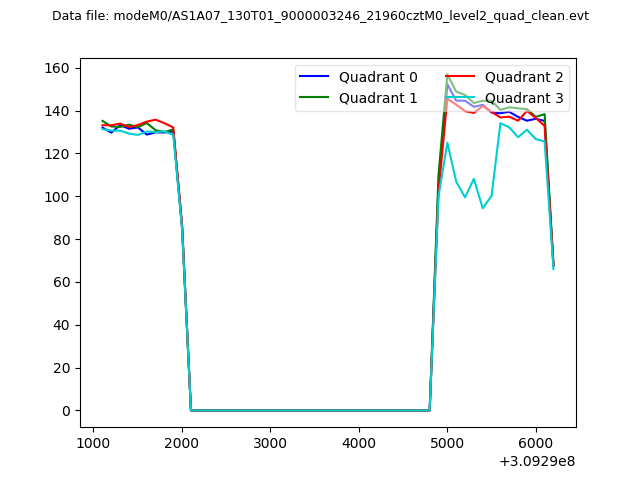
| Quadrant-wise count rates Data is divided into 100 sec bins |
 |
|
| Module-wise count rates for Quadrant A Data is divided into 100 sec bins |
 |
 |
| Module-wise count rates for Quadrant B Data is divided into 100 sec bins |
 |
 |
| Module-wise count rates for Quadrant C Data is divided into 100 sec bins |
 |
 |
| Module-wise count rates for Quadrant D Data is divided into 100 sec bins |
 |
 |
| Parameter | Plot |
|---|---|
| CZT HV Monitor |  |
| D_VDD | 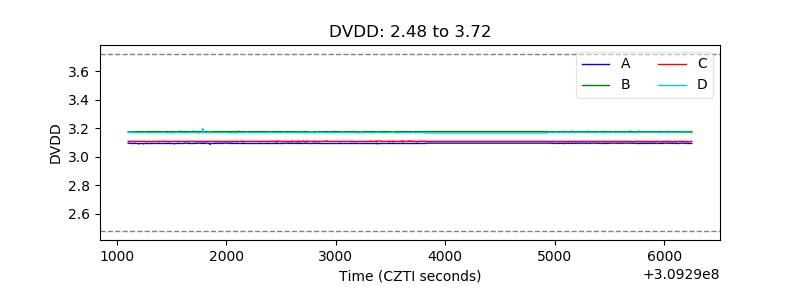 |
| Temperature 1 |  |
| Veto HV Monitor |  |
| Veto LLD |  |
| Alpha Counter |  |
| _CPM_Rate | 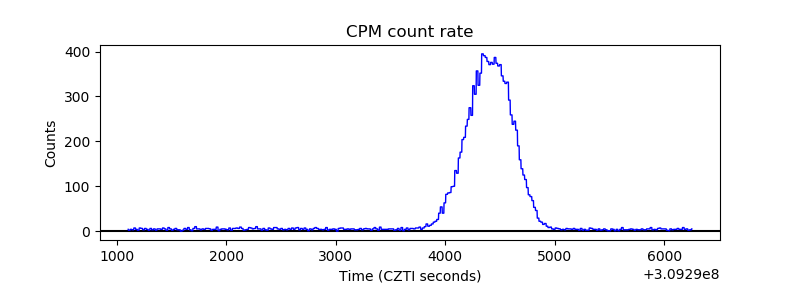 |
| CZT Counter |  |
| +2.5 Volts monitor |  |
| +5 Volts monitor |  |
| _ROLL_ROT |  |
| _Roll_DEC |  |
| _Roll_RA |  |
| Veto Counter |  |