| Param | Original file | Final file |
|---|---|---|
| Filename | modeM0/AS1A07_130T01_9000003246_21961cztM0_level2.evt | modeM0/AS1A07_130T01_9000003246_21961cztM0_level2_quad_clean.evt |
| Size (bytes) | 509,051,520 | 99,172,800 |
| Size | 485.5 MB | 94.6 MB |
| Events in quadrant A | 3,346,673 | 639,792 |
| Events in quadrant B | 3,491,445 | 651,504 |
| Events in quadrant C | 3,394,461 | 634,987 |
| Events in quadrant D | 4,715,103 | 595,939 |
| Mode M0 | |||
|---|---|---|---|
| Quadrant | BADHDUFLAG | Total packets | Discarded packets |
| A | 0 | 14476 | 3 |
| B | 0 | 14798 | 2 |
| C | 0 | 14414 | 2 |
| D | 0 | 18696 | 2 |
| Mode SS | |||
|---|---|---|---|
| Quadrant | BADHDUFLAG | Total packets | Discarded packets |
| A | 0 | 140 | 0 |
| B | 0 | 140 | 0 |
| C | 0 | 140 | 0 |
| D | 0 | 140 | 0 |
| Mode M9 | |||
|---|---|---|---|
| Quadrant | BADHDUFLAG | Total packets | Discarded packets |
| A | 0 | 9 | 0 |
| B | 0 | 10 | 0 |
| C | 0 | 10 | 0 |
| D | 0 | 10 | 0 |
| Quadrant | Total seconds | Saturated seconds | Saturation percentage |
|---|---|---|---|
| A | 6906 | 83 | 1.201853% |
| B | 6906 | 125 | 1.810020% |
| C | 6906 | 114 | 1.650738% |
| D | 6906 | 461 | 6.675355% |
Noise dominated data is calculated using 1-second bins in cleaned event files. If a bin has >2000 counts, and if more than 50% of those come from <1% of pixels, then it is considered to be noise-dominated and hence unusable.
| Quadrant | # 1 sec bins | Bins with >0 counts | Bins with >2000 counts | High rate bins dominated by noise | Noise dominated (total time) | Noise dominated (detector-on time) | Marked lightcurve |
|---|---|---|---|---|---|---|---|
| A | 7521 | 6906 | 0 | 0 | 0.00% | 0.00% | 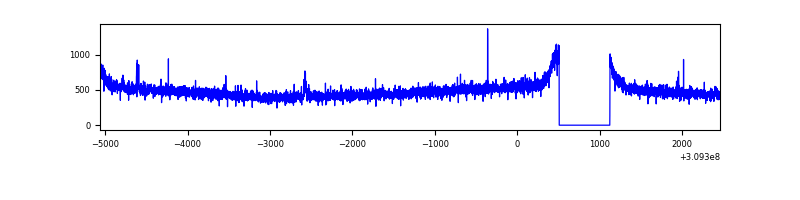 |
| B | 7521 | 6906 | 22 | 22 | 0.29% | 0.32% | 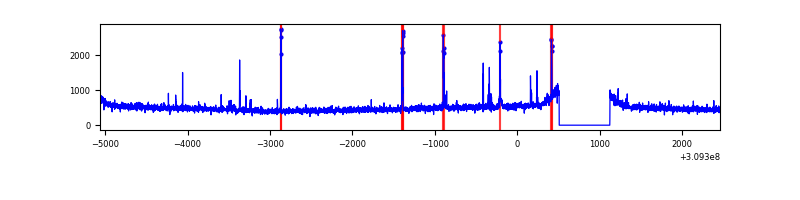 |
| C | 7521 | 6906 | 1 | 1 | 0.01% | 0.01% | 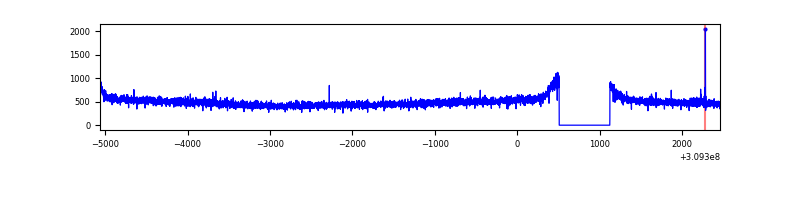 |
| D | 7521 | 6907 | 330 | 330 | 4.39% | 4.78% | 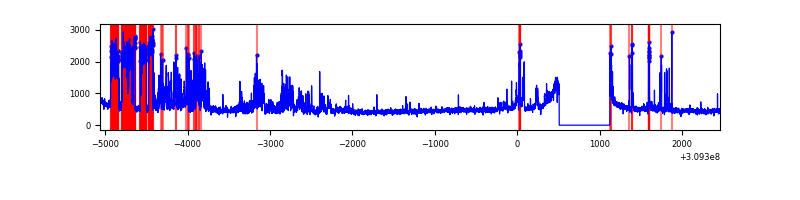 |
Top three noisy pixels from each quadrant. If the there are fewer than three noisy pixels in the level2.evt file, extra rows are filled as -1
| Pixel properties | Quadrant properties | ||||||
|---|---|---|---|---|---|---|---|
| Quadrant | DetID | PixID | Counts | Sigma | Mean | Median | Sigma |
| A | 2 | 79 | 23783 | 133.1 | 861 | 843 | 172.3 |
| A | 13 | 254 | 11678 | 62.86 | 861 | 843 | 172.3 |
| A | 3 | 137 | 7527 | 38.78 | 861 | 843 | 172.3 |
| B | 3 | 64 | 84926 | 510.33 | 855 | 833 | 164.8 |
| B | 6 | 36 | 22377 | 130.74 | 855 | 833 | 164.8 |
| B | 12 | 111 | 19942 | 115.97 | 855 | 833 | 164.8 |
| C | 14 | 238 | 129057 | 651.58 | 836 | 842 | 196.8 |
| C | 10 | 22 | 7335 | 33.0 | 836 | 842 | 196.8 |
| C | 13 | 61 | 5767 | 25.03 | 836 | 842 | 196.8 |
| D | 13 | 174 | 1146691 | 5672.13 | 828 | 806 | 202.0 |
| D | 2 | 136 | 158694 | 781.55 | 828 | 806 | 202.0 |
| D | 1 | 52 | 155957 | 768.0 | 828 | 806 | 202.0 |
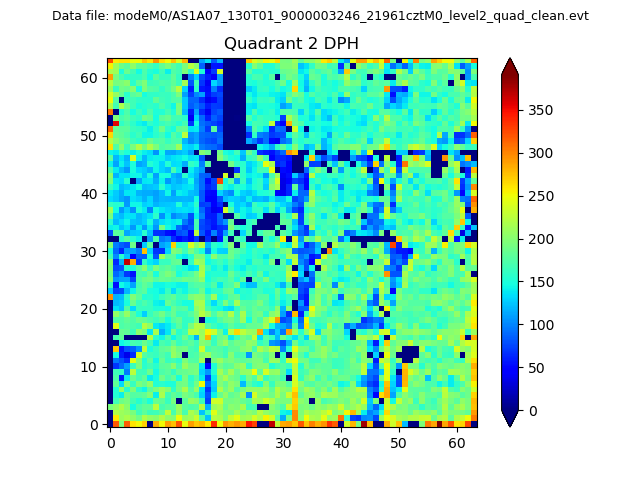
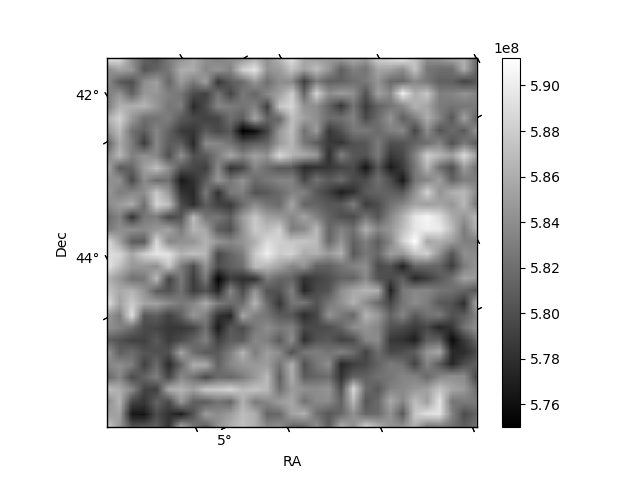
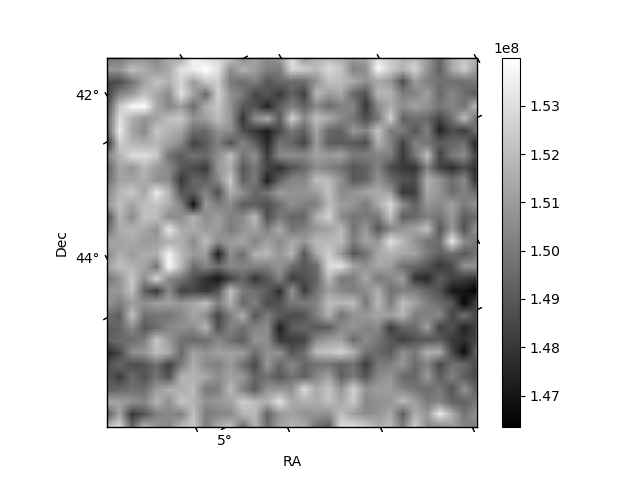
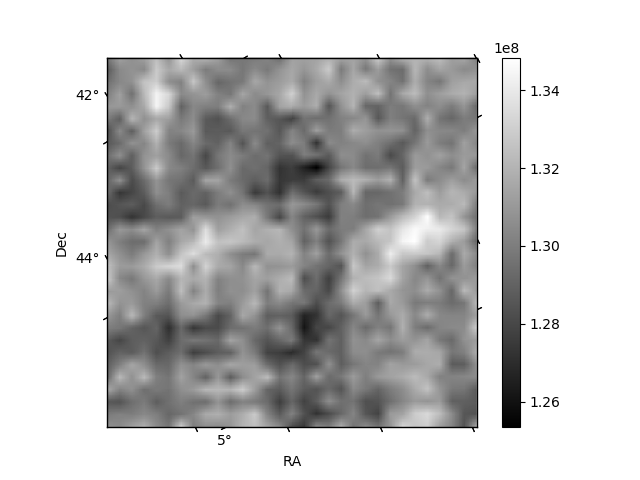
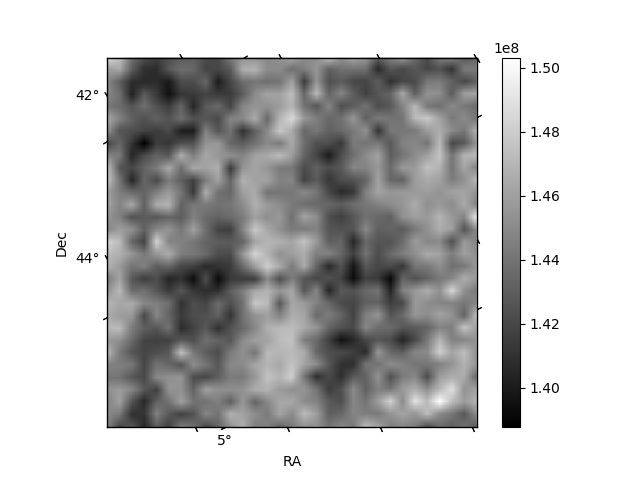
Histogram calculated using DETX and DETY for each event in the final _common_clean file
| Quadrant A | 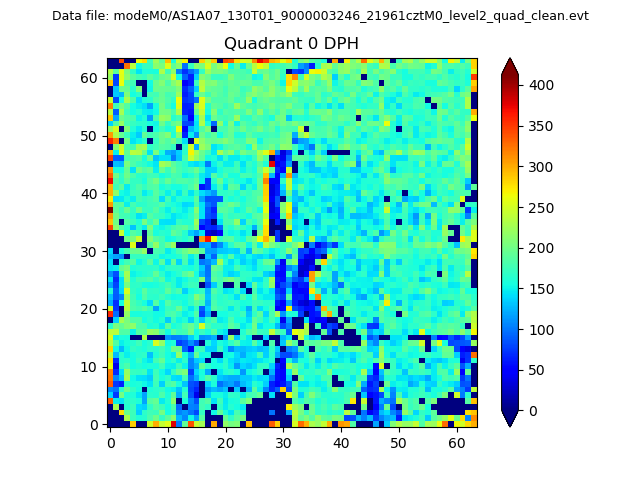 |
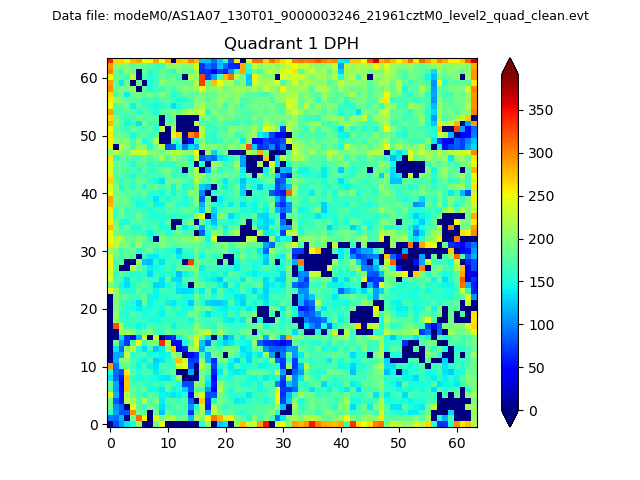 |
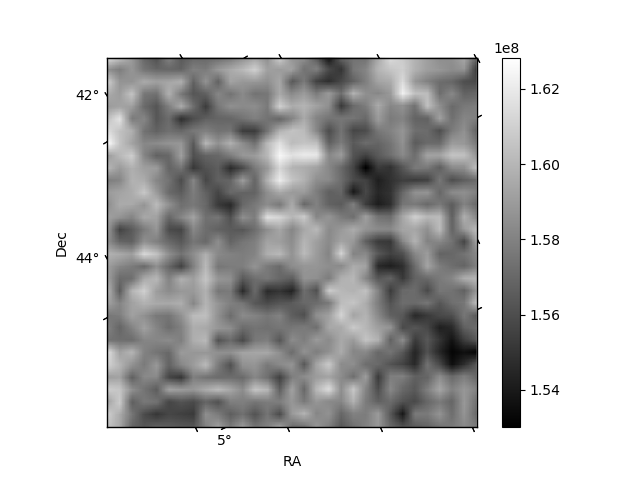
Quadrant B |
|---|---|---|---|
| Quadrant D | 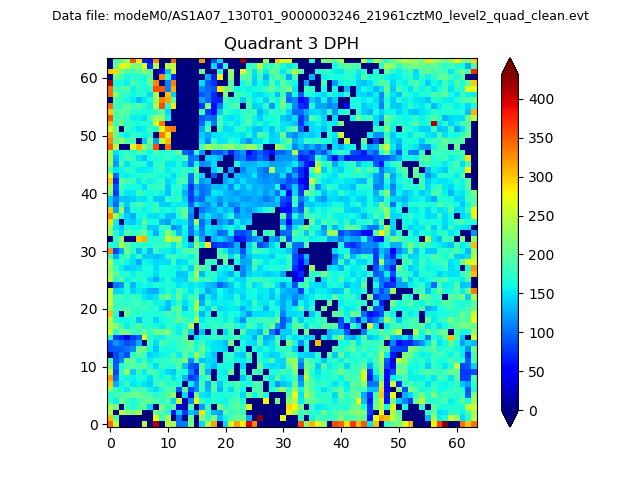 |
 |
Quadrant C |
| Plot type | Count rate plots | Images |
|---|---|---|
| Comparison with Poisson distribution Blue bars denote a histogram of data divided into 1 sec bins. Red curve is a Poisson curve with rate = median count rate of data. |
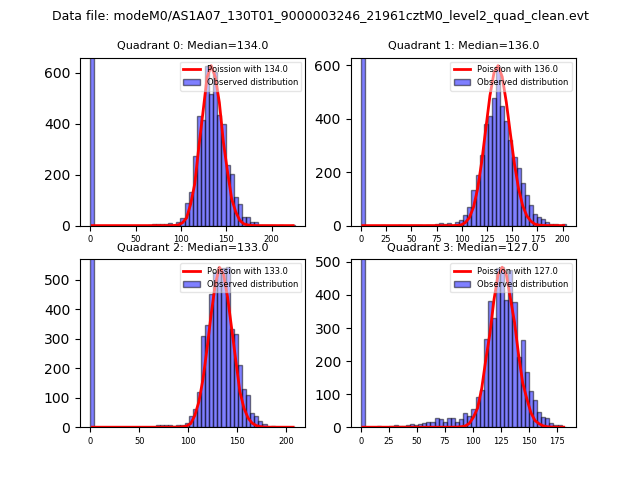 |
 |
| Quadrant-wise count rates Data is divided into 100 sec bins |
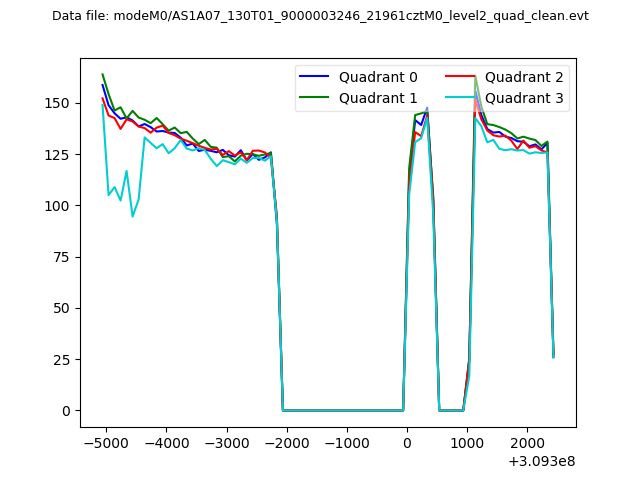 |
|
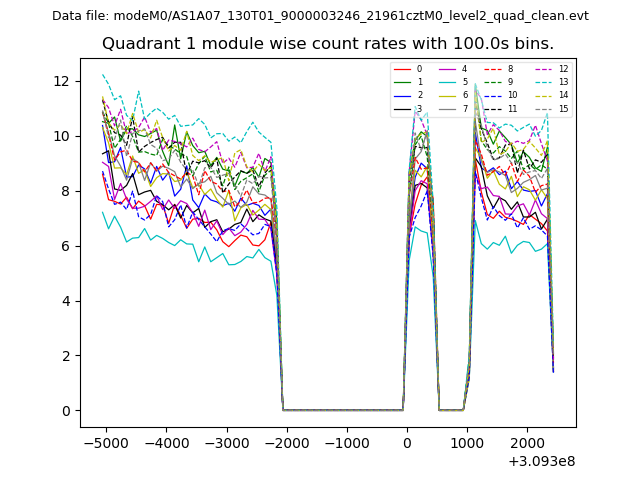
| Module-wise count rates for Quadrant A Data is divided into 100 sec bins |
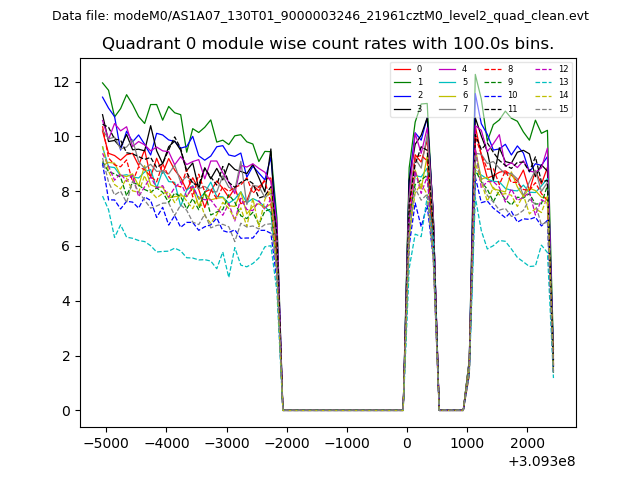 |
 |
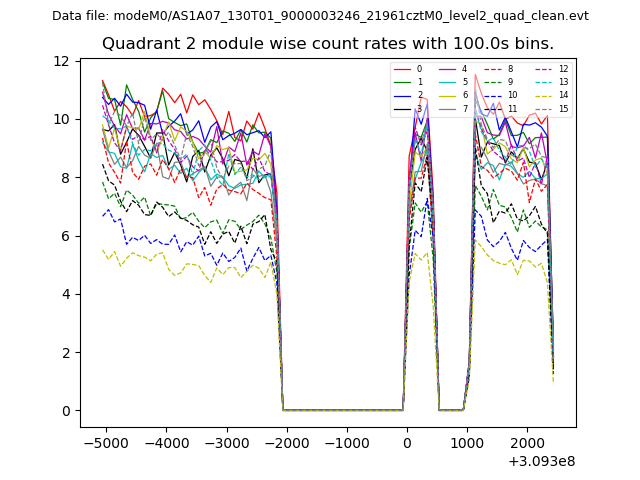
| Module-wise count rates for Quadrant B Data is divided into 100 sec bins |
 |
 |
| Module-wise count rates for Quadrant C Data is divided into 100 sec bins |
 |
 |
| Module-wise count rates for Quadrant D Data is divided into 100 sec bins |
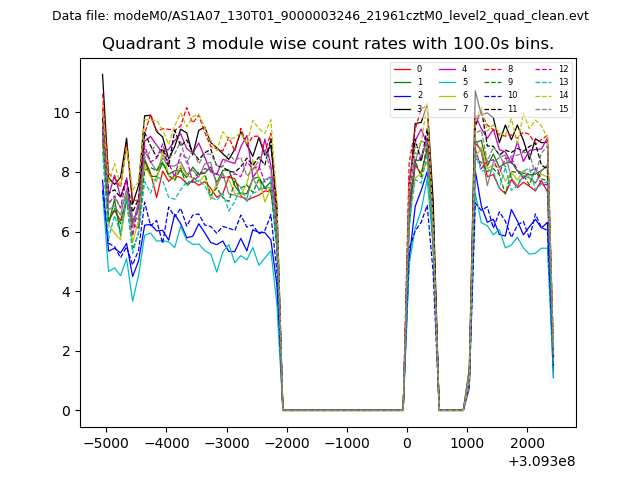 |
 |
| Parameter | Plot |
|---|---|
| CZT HV Monitor | 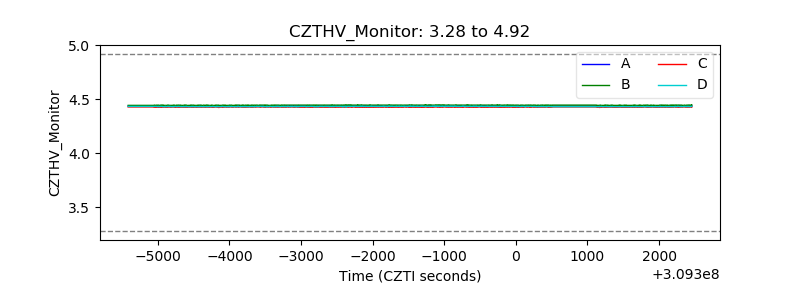 |
| D_VDD | 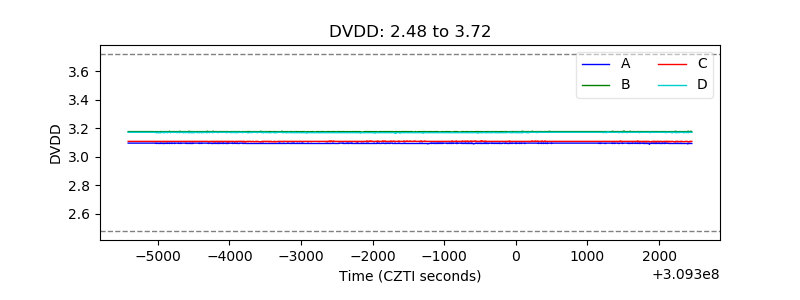 |
| Temperature 1 | 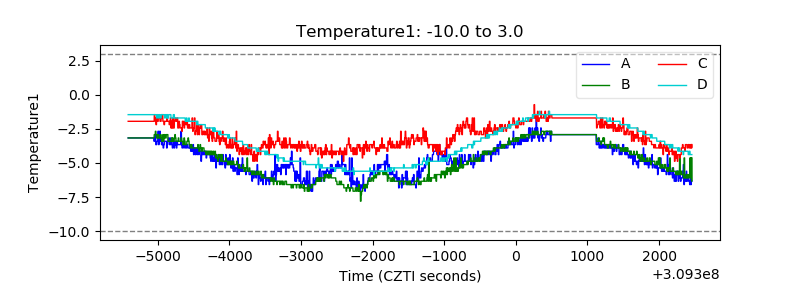 |
| Veto HV Monitor | 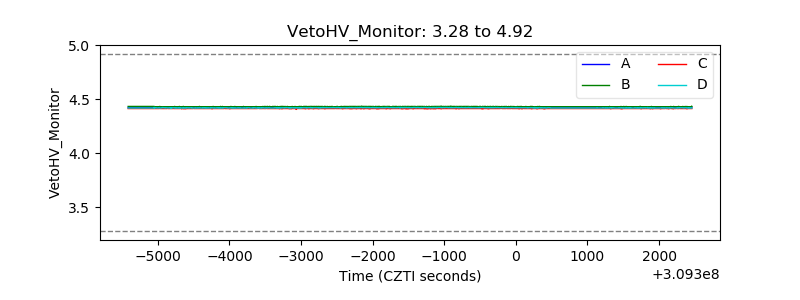 |
| Veto LLD |  |
| Alpha Counter | 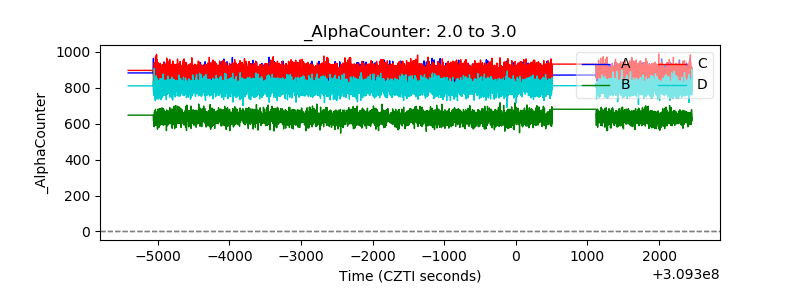 |
| _CPM_Rate | 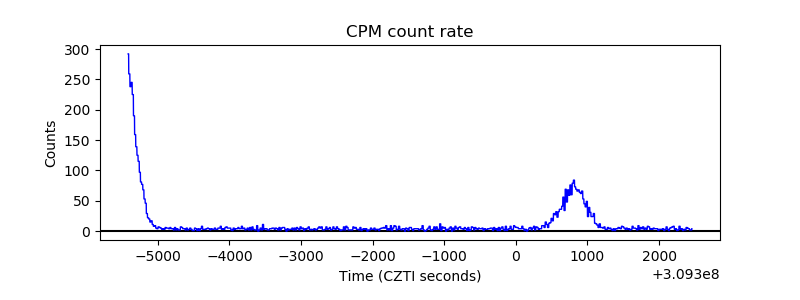 |
| CZT Counter | 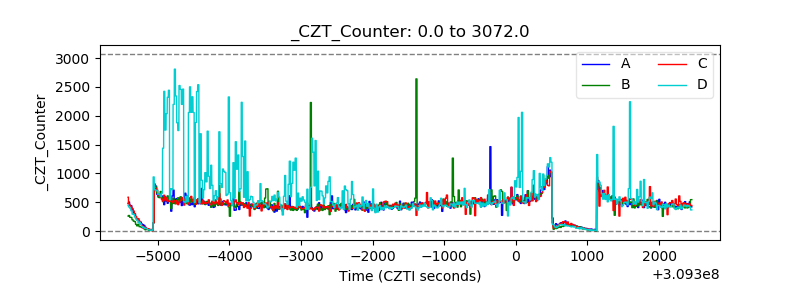 |
| +2.5 Volts monitor |  |
| +5 Volts monitor |  |
| _ROLL_ROT | 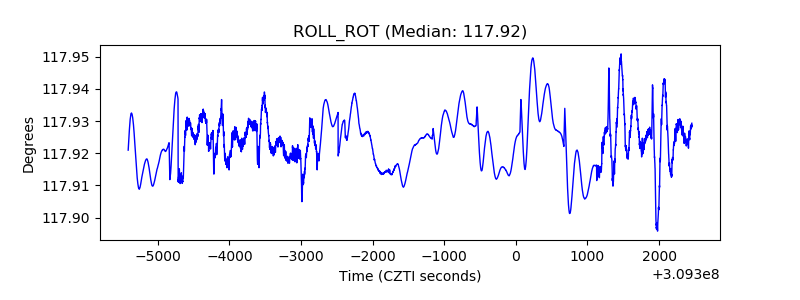 |
| _Roll_DEC | 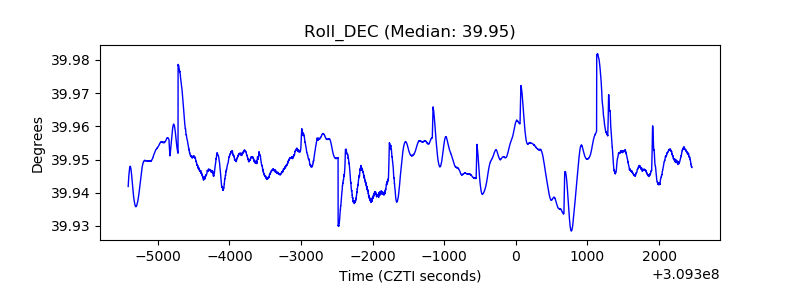 |
| _Roll_RA | 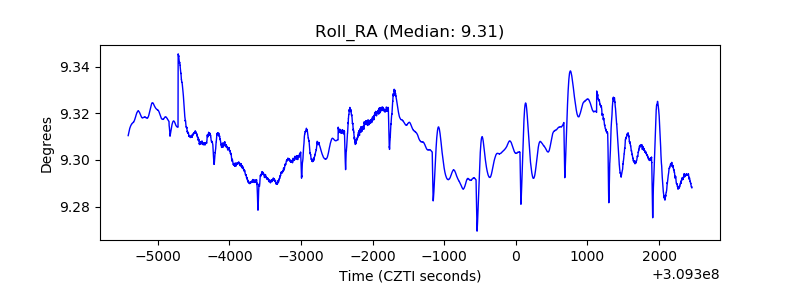 |
| Veto Counter | 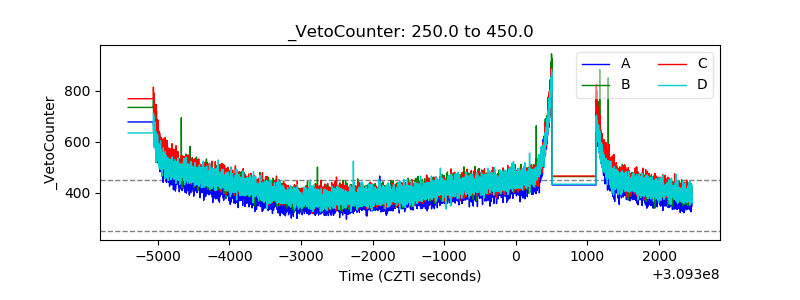 |