| Param | Original file | Final file |
|---|---|---|
| Filename | modeM0/AS1A07_130T01_9000003246_21963cztM0_level2.evt | modeM0/AS1A07_130T01_9000003246_21963cztM0_level2_quad_clean.evt |
| Size (bytes) | 571,619,520 | 109,039,680 |
| Size | 545.1 MB | 104.0 MB |
| Events in quadrant A | 3,553,367 | 706,596 |
| Events in quadrant B | 3,735,433 | 716,946 |
| Events in quadrant C | 3,727,934 | 699,373 |
| Events in quadrant D | 5,776,145 | 647,299 |
| Mode M0 | |||
|---|---|---|---|
| Quadrant | BADHDUFLAG | Total packets | Discarded packets |
| A | 0 | 15773 | 2 |
| B | 0 | 16202 | 2 |
| C | 0 | 16018 | 2 |
| D | 0 | 22462 | 2 |
| Mode SS | |||
|---|---|---|---|
| Quadrant | BADHDUFLAG | Total packets | Discarded packets |
| A | 0 | 156 | 0 |
| B | 0 | 156 | 0 |
| C | 0 | 156 | 0 |
| D | 0 | 156 | 0 |
| Mode M9 | |||
|---|---|---|---|
| Quadrant | BADHDUFLAG | Total packets | Discarded packets |
| A | 0 | 2 | 0 |
| B | 0 | 3 | 0 |
| C | 0 | 3 | 0 |
| D | 0 | 3 | 0 |
| Quadrant | Total seconds | Saturated seconds | Saturation percentage |
|---|---|---|---|
| A | 7641 | 18 | 0.235571% |
| B | 7641 | 82 | 1.073158% |
| C | 7641 | 100 | 1.308729% |
| D | 7641 | 747 | 9.776207% |
Noise dominated data is calculated using 1-second bins in cleaned event files. If a bin has >2000 counts, and if more than 50% of those come from <1% of pixels, then it is considered to be noise-dominated and hence unusable.
| Quadrant | # 1 sec bins | Bins with >0 counts | Bins with >2000 counts | High rate bins dominated by noise | Noise dominated (total time) | Noise dominated (detector-on time) | Marked lightcurve |
|---|---|---|---|---|---|---|---|
| A | 7876 | 7642 | 0 | 0 | 0.00% | 0.00% | 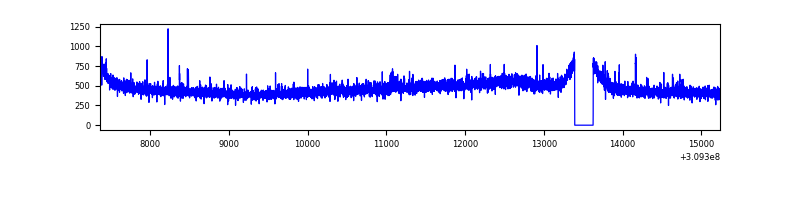 |
| B | 7876 | 7642 | 22 | 22 | 0.28% | 0.29% | 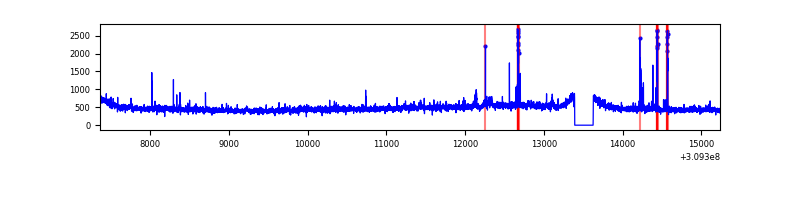 |
| C | 7876 | 7642 | 17 | 17 | 0.22% | 0.22% | 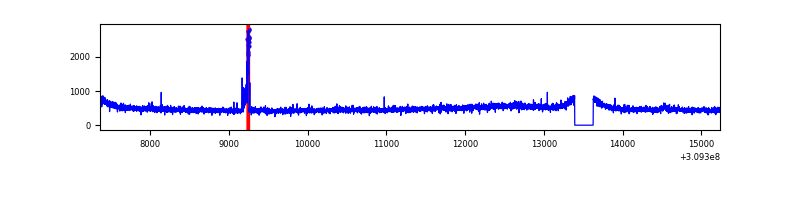 |
| D | 7876 | 7642 | 604 | 604 | 7.67% | 7.90% | 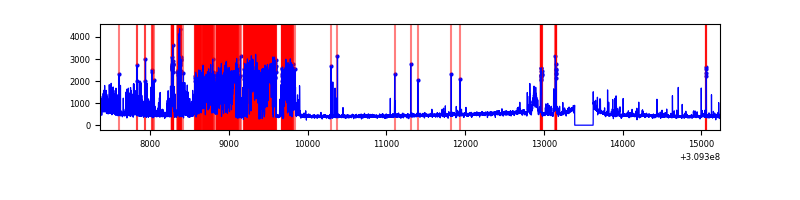 |
Top three noisy pixels from each quadrant. If the there are fewer than three noisy pixels in the level2.evt file, extra rows are filled as -1
| Pixel properties | Quadrant properties | ||||||
|---|---|---|---|---|---|---|---|
| Quadrant | DetID | PixID | Counts | Sigma | Mean | Median | Sigma |
| A | 2 | 79 | 32087 | 169.67 | 913 | 895 | 183.8 |
| A | 13 | 254 | 12871 | 65.14 | 913 | 895 | 183.8 |
| A | 3 | 137 | 7919 | 38.21 | 913 | 895 | 183.8 |
| B | 3 | 64 | 96851 | 547.32 | 913 | 889 | 175.3 |
| B | 0 | 197 | 25407 | 139.84 | 913 | 889 | 175.3 |
| B | 0 | 230 | 22409 | 122.74 | 913 | 889 | 175.3 |
| C | 14 | 238 | 139172 | 661.24 | 889 | 896 | 209.1 |
| C | 9 | 54 | 89986 | 426.03 | 889 | 896 | 209.1 |
| C | 8 | 128 | 14294 | 64.07 | 889 | 896 | 209.1 |
| D | 13 | 174 | 2154846 | 10310.23 | 865 | 840 | 208.9 |
| D | 11 | 176 | 132607 | 630.71 | 865 | 840 | 208.9 |
| D | 13 | 172 | 118871 | 564.96 | 865 | 840 | 208.9 |
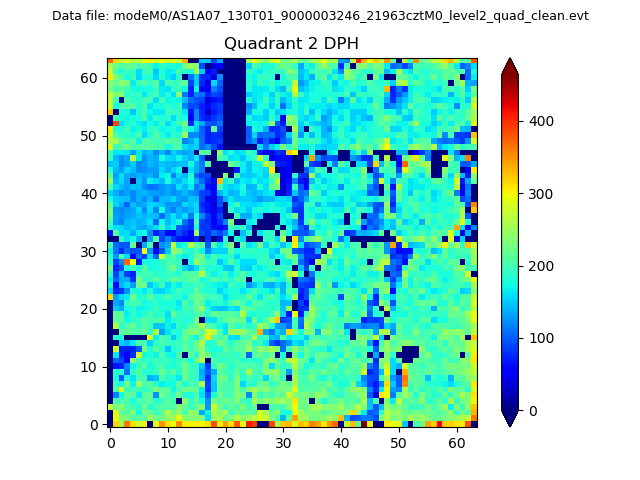
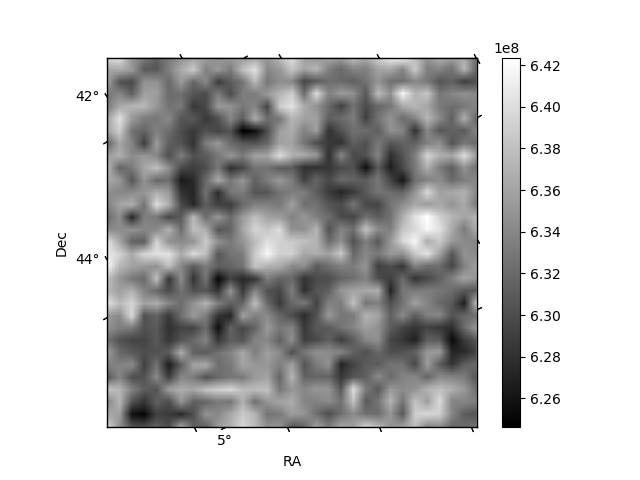
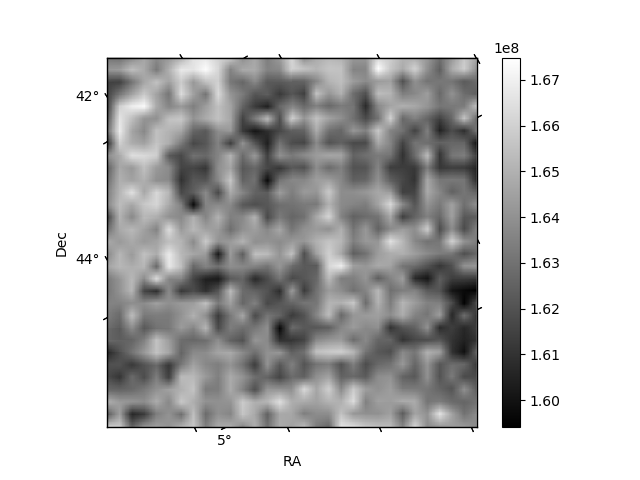
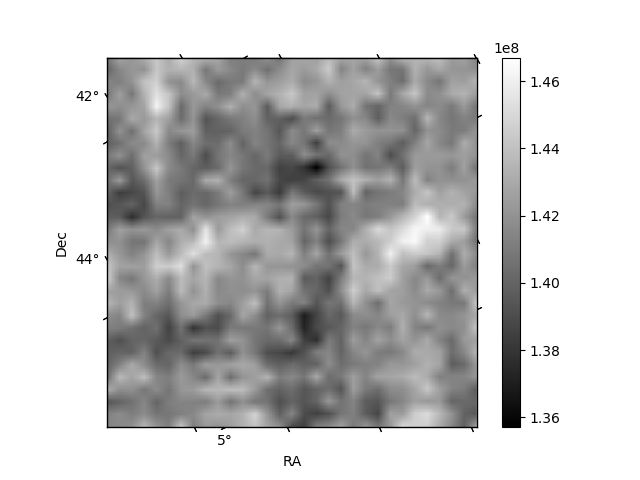
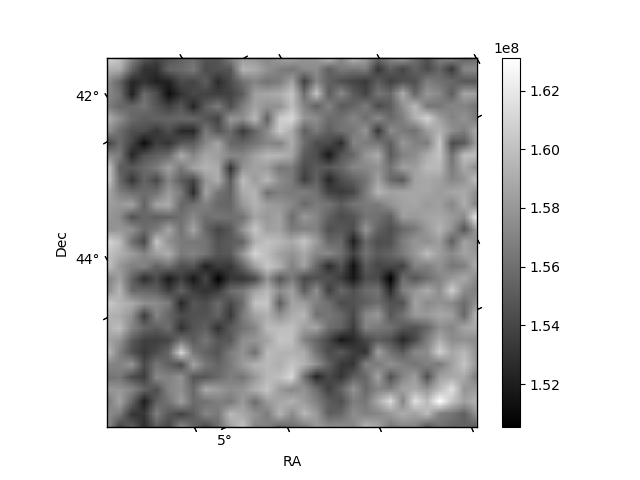
Histogram calculated using DETX and DETY for each event in the final _common_clean file
| Quadrant A | 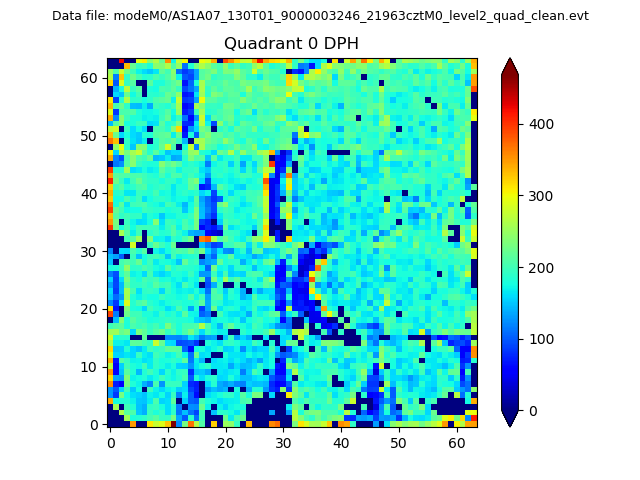 |
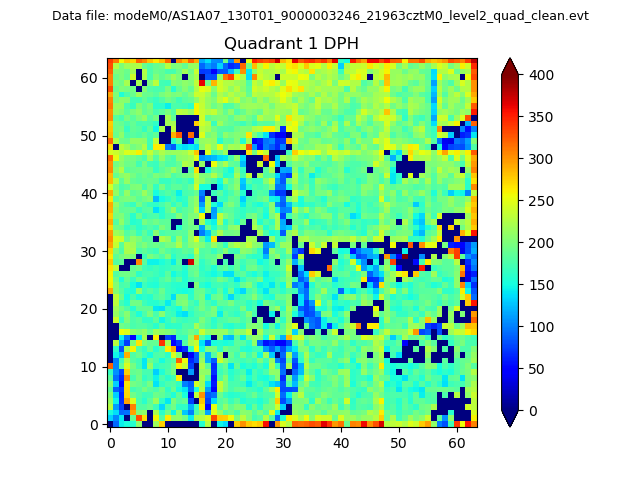 |
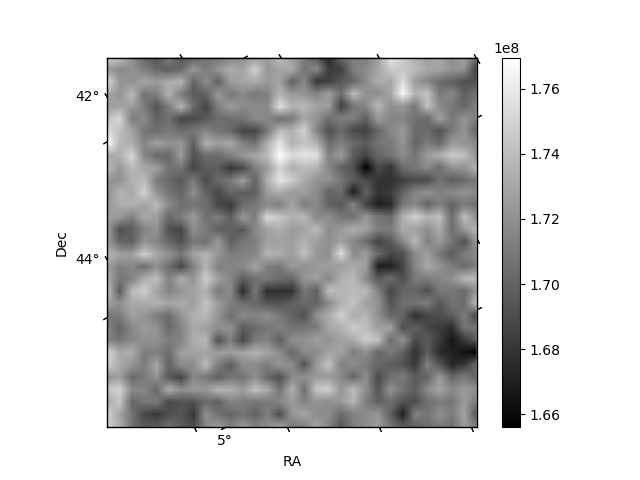
Quadrant B |
|---|---|---|---|
| Quadrant D | 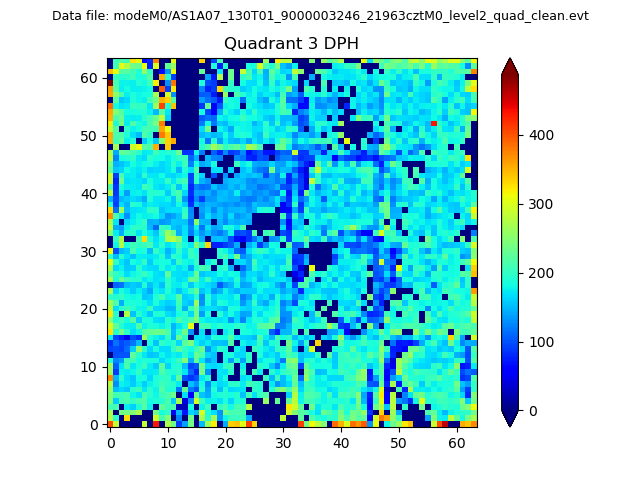 |
 |
Quadrant C |
| Plot type | Count rate plots | Images |
|---|---|---|
| Comparison with Poisson distribution Blue bars denote a histogram of data divided into 1 sec bins. Red curve is a Poisson curve with rate = median count rate of data. |
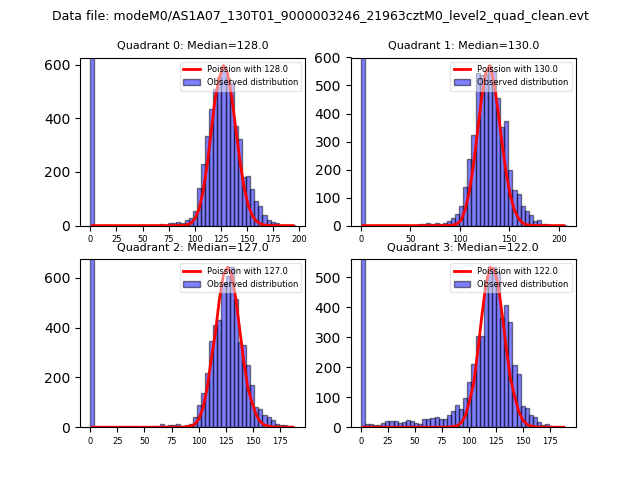 |
 |
| Quadrant-wise count rates Data is divided into 100 sec bins |
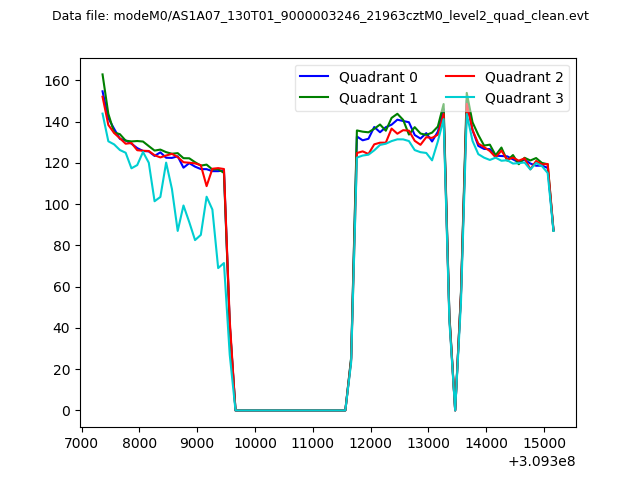 |
|
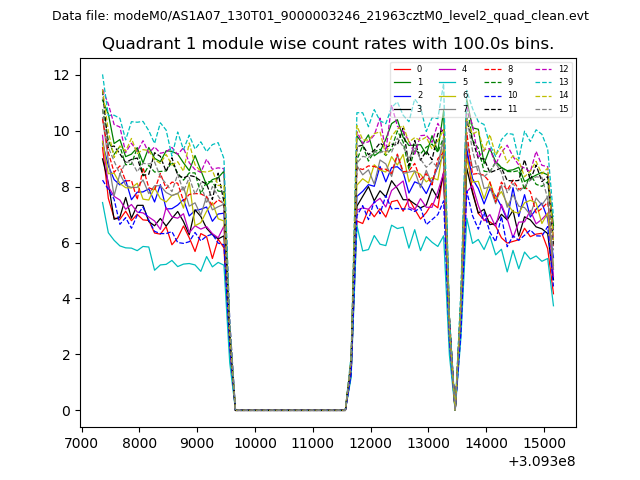
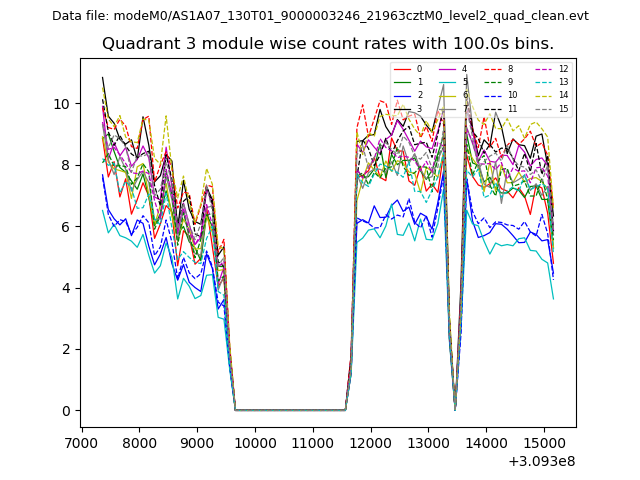
| Module-wise count rates for Quadrant A Data is divided into 100 sec bins |
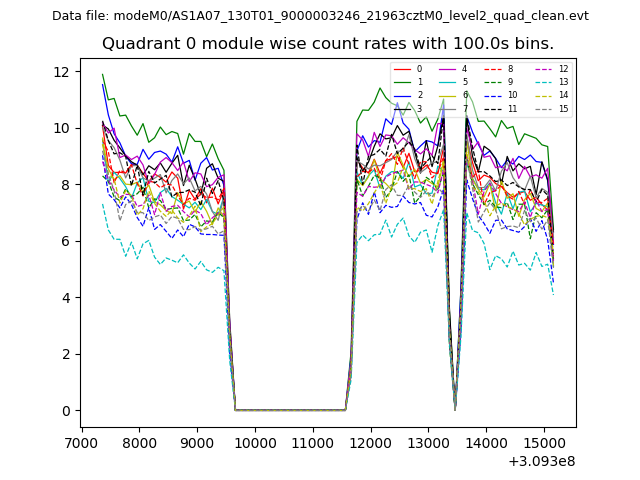 |
 |
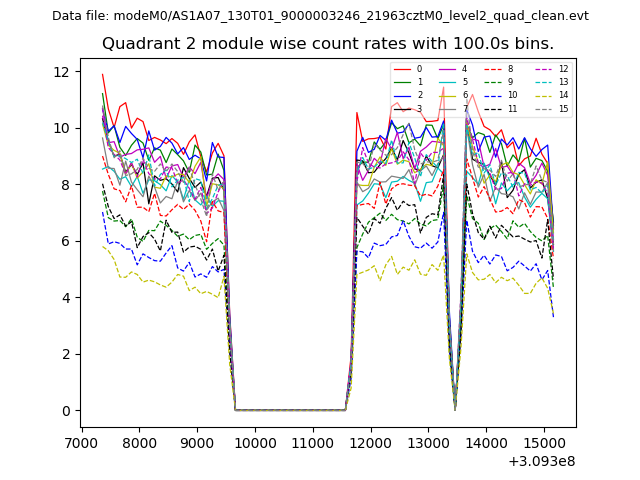
| Module-wise count rates for Quadrant B Data is divided into 100 sec bins |
 |
 |
| Module-wise count rates for Quadrant C Data is divided into 100 sec bins |
 |
 |
| Module-wise count rates for Quadrant D Data is divided into 100 sec bins |
 |
 |
| Parameter | Plot |
|---|---|
| CZT HV Monitor | 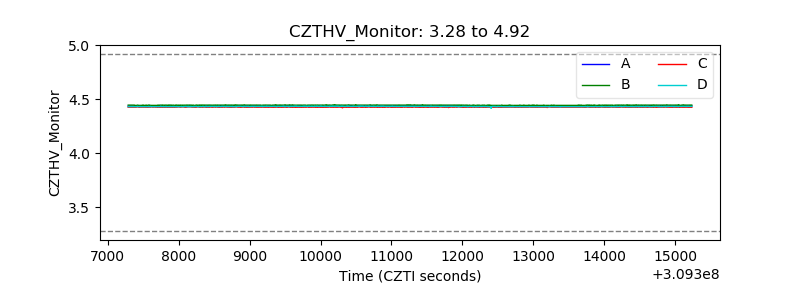 |
| D_VDD | 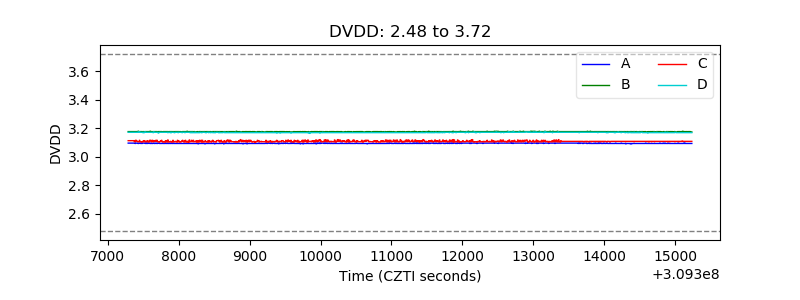 |
| Temperature 1 | 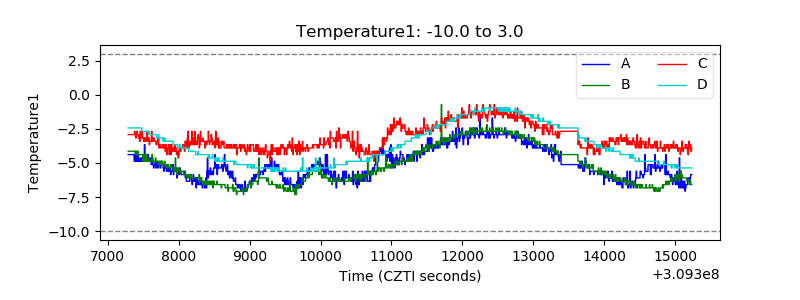 |
| Veto HV Monitor | 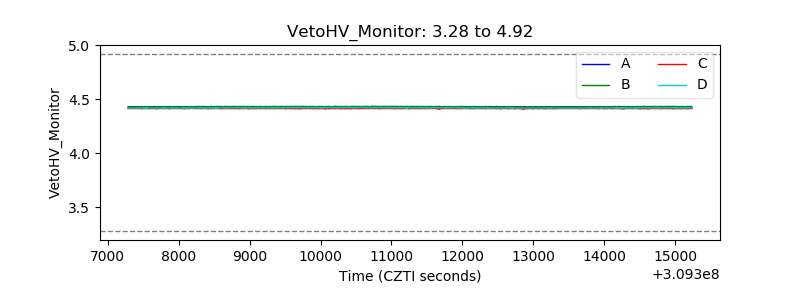 |
| Veto LLD | 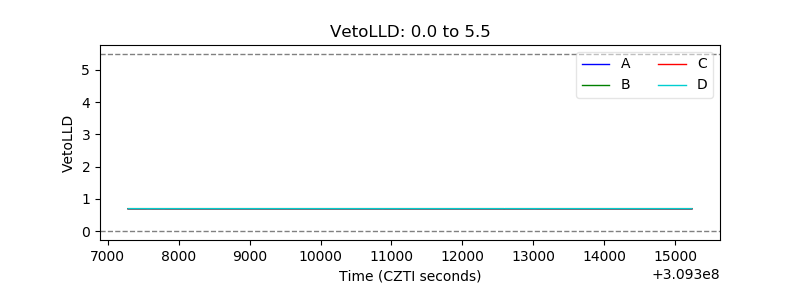 |
| Alpha Counter | 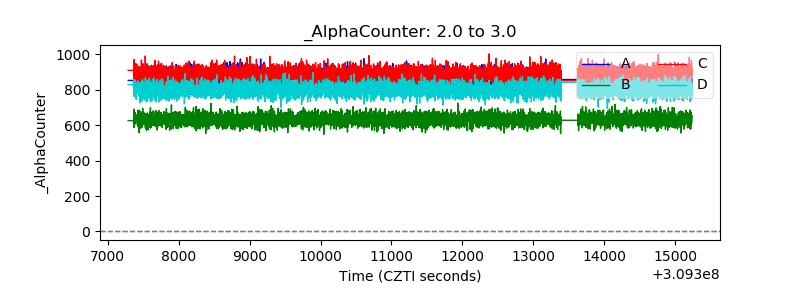 |
| _CPM_Rate | 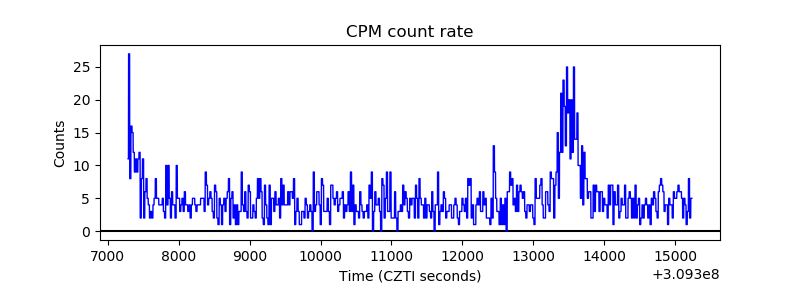 |
| CZT Counter | 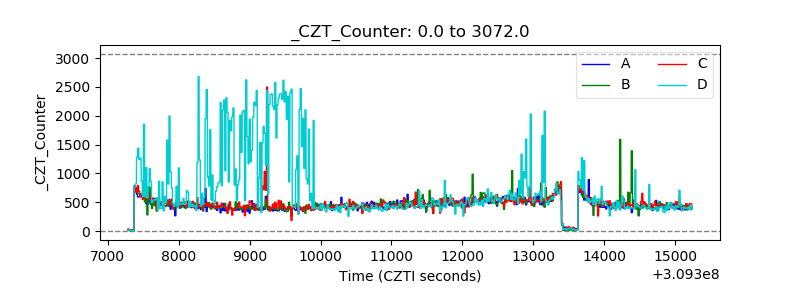 |
| +2.5 Volts monitor |  |
| +5 Volts monitor |  |
| _ROLL_ROT | 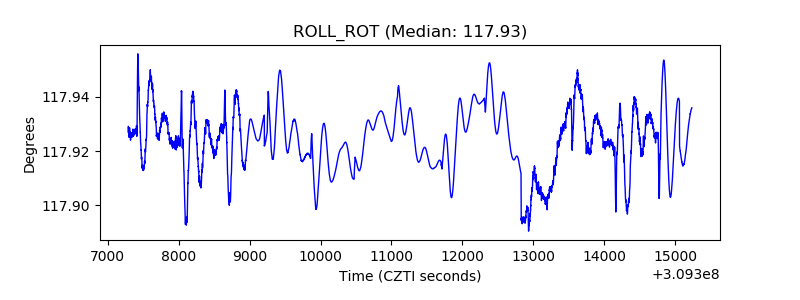 |
| _Roll_DEC |  |
| _Roll_RA | 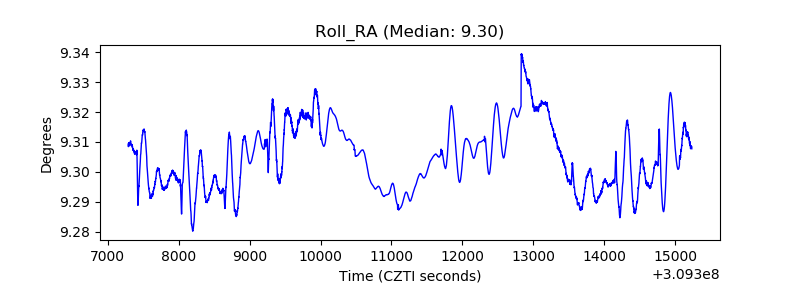 |
| Veto Counter | 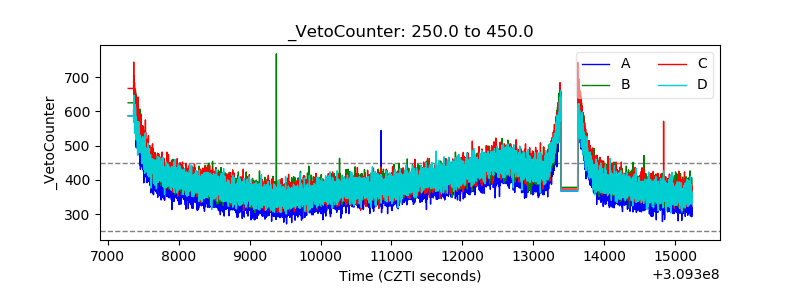 |