| Param | Original file | Final file |
|---|---|---|
| Filename | modeM0/AS1A07_130T01_9000003246_21964cztM0_level2.evt | modeM0/AS1A07_130T01_9000003246_21964cztM0_level2_quad_clean.evt |
| Size (bytes) | 582,739,200 | 120,159,360 |
| Size | 555.7 MB | 114.6 MB |
| Events in quadrant A | 3,912,737 | 771,880 |
| Events in quadrant B | 4,211,176 | 785,150 |
| Events in quadrant C | 4,007,363 | 764,775 |
| Events in quadrant D | 4,950,229 | 737,041 |
| Mode M0 | |||
|---|---|---|---|
| Quadrant | BADHDUFLAG | Total packets | Discarded packets |
| A | 0 | 17222 | 2 |
| B | 0 | 17934 | 2 |
| C | 0 | 17331 | 2 |
| D | 0 | 20546 | 2 |
| Mode SS | |||
|---|---|---|---|
| Quadrant | BADHDUFLAG | Total packets | Discarded packets |
| A | 0 | 172 | 0 |
| B | 0 | 172 | 0 |
| C | 0 | 172 | 0 |
| D | 0 | 172 | 0 |
| Mode M9 | |||
|---|---|---|---|
| Quadrant | BADHDUFLAG | Total packets | Discarded packets |
| A | 0 | 6 | 0 |
| B | 0 | 6 | 0 |
| C | 0 | 6 | 0 |
| D | 0 | 6 | 0 |
| Quadrant | Total seconds | Saturated seconds | Saturation percentage |
|---|---|---|---|
| A | 8347 | 43 | 0.515155% |
| B | 8348 | 135 | 1.617154% |
| C | 8348 | 114 | 1.365597% |
| D | 8348 | 275 | 3.294202% |
Noise dominated data is calculated using 1-second bins in cleaned event files. If a bin has >2000 counts, and if more than 50% of those come from <1% of pixels, then it is considered to be noise-dominated and hence unusable.
| Quadrant | # 1 sec bins | Bins with >0 counts | Bins with >2000 counts | High rate bins dominated by noise | Noise dominated (total time) | Noise dominated (detector-on time) | Marked lightcurve |
|---|---|---|---|---|---|---|---|
| A | 8977 | 8349 | 0 | 0 | 0.00% | 0.00% | 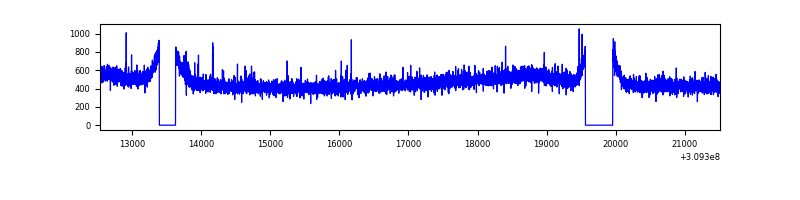 |
| B | 8978 | 8349 | 38 | 38 | 0.42% | 0.46% | 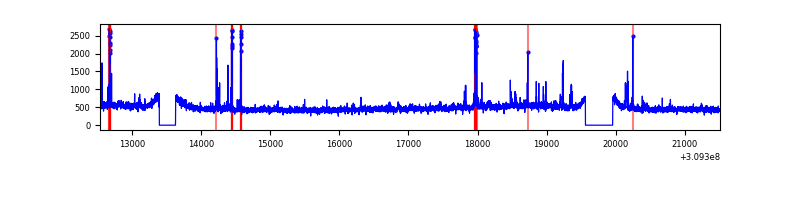 |
| C | 8978 | 8349 | 0 | 0 | 0.00% | 0.00% | 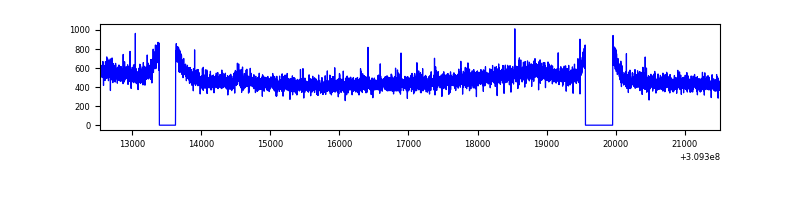 |
| D | 8978 | 8350 | 208 | 208 | 2.32% | 2.49% | 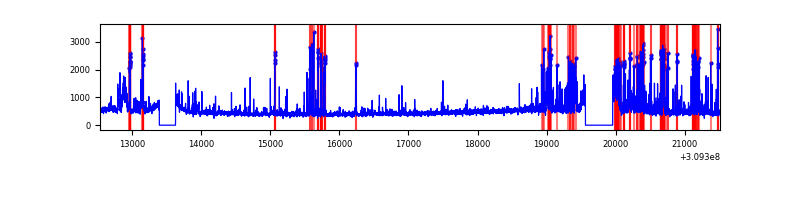 |
Top three noisy pixels from each quadrant. If the there are fewer than three noisy pixels in the level2.evt file, extra rows are filled as -1
| Pixel properties | Quadrant properties | ||||||
|---|---|---|---|---|---|---|---|
| Quadrant | DetID | PixID | Counts | Sigma | Mean | Median | Sigma |
| A | 13 | 254 | 14569 | 66.79 | 1008 | 986 | 203.4 |
| A | 2 | 79 | 12285 | 55.56 | 1008 | 986 | 203.4 |
| A | 3 | 1 | 10984 | 49.16 | 1008 | 986 | 203.4 |
| B | 3 | 64 | 199846 | 1032.4 | 1007 | 978 | 192.6 |
| B | 0 | 197 | 27859 | 139.55 | 1007 | 978 | 192.6 |
| B | 0 | 230 | 24150 | 120.29 | 1007 | 978 | 192.6 |
| C | 14 | 238 | 154417 | 659.56 | 983 | 990 | 232.6 |
| C | 9 | 54 | 17392 | 70.51 | 983 | 990 | 232.6 |
| C | 13 | 61 | 6922 | 25.5 | 983 | 990 | 232.6 |
| D | 13 | 174 | 810050 | 3385.16 | 980 | 951 | 239.0 |
| D | 13 | 172 | 181694 | 756.2 | 980 | 951 | 239.0 |
| D | 2 | 136 | 167783 | 698.0 | 980 | 951 | 239.0 |
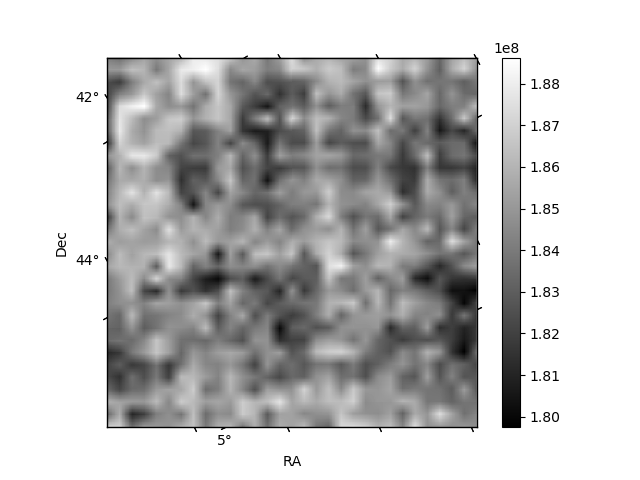
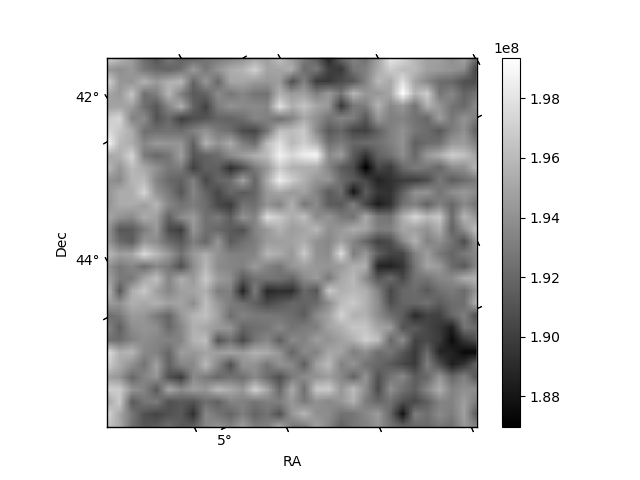
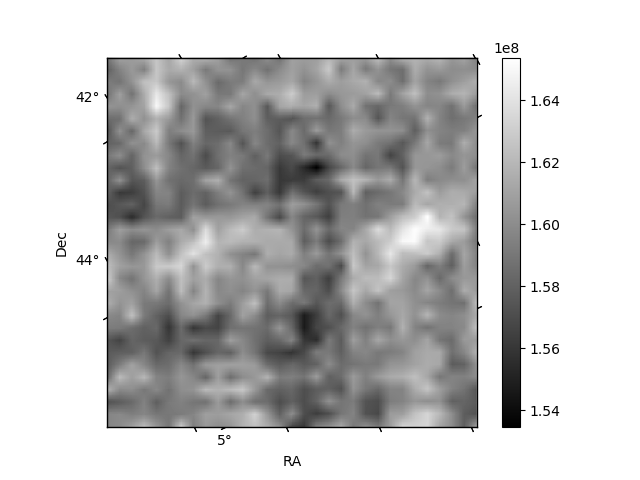
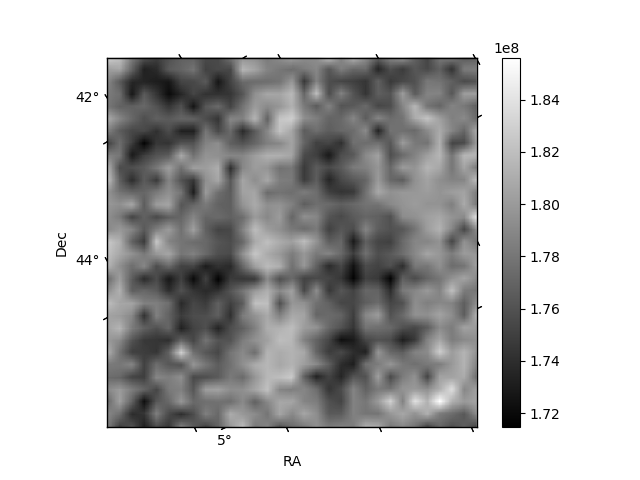
Histogram calculated using DETX and DETY for each event in the final _common_clean file
| Quadrant A |  |
 |
Quadrant B |
|---|---|---|---|
| Quadrant D |  |
 |
Quadrant C |
| Plot type | Count rate plots | Images |
|---|---|---|
| Comparison with Poisson distribution Blue bars denote a histogram of data divided into 1 sec bins. Red curve is a Poisson curve with rate = median count rate of data. |
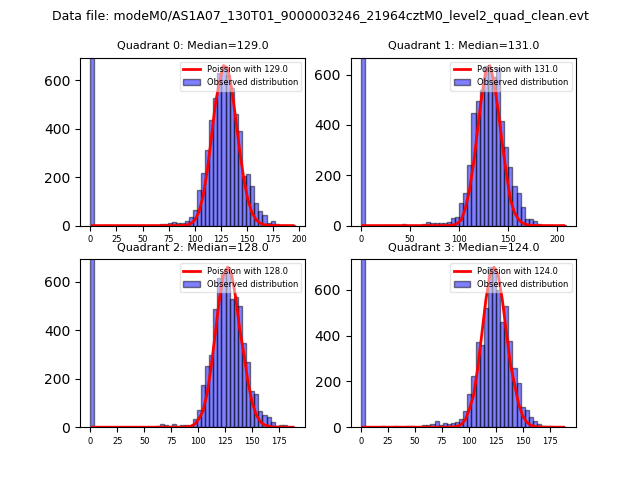 |
 |
| Quadrant-wise count rates Data is divided into 100 sec bins |
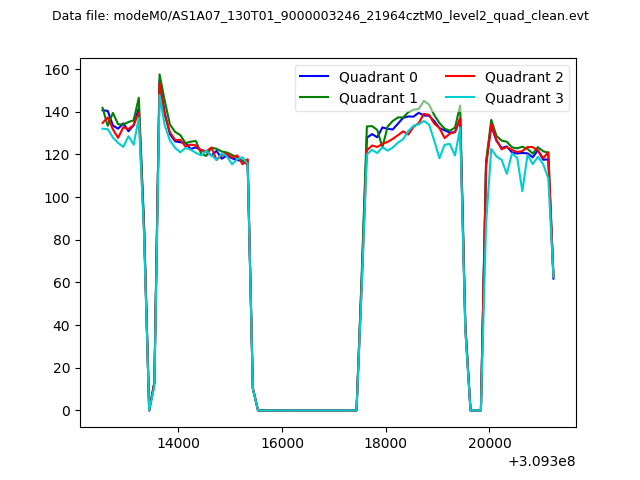 |
|
| Module-wise count rates for Quadrant A Data is divided into 100 sec bins |
 |
 |
| Module-wise count rates for Quadrant B Data is divided into 100 sec bins |
 |
 |
| Module-wise count rates for Quadrant C Data is divided into 100 sec bins |
 |
 |
| Module-wise count rates for Quadrant D Data is divided into 100 sec bins |
 |
 |
| Parameter | Plot |
|---|---|
| CZT HV Monitor |  |
| D_VDD | 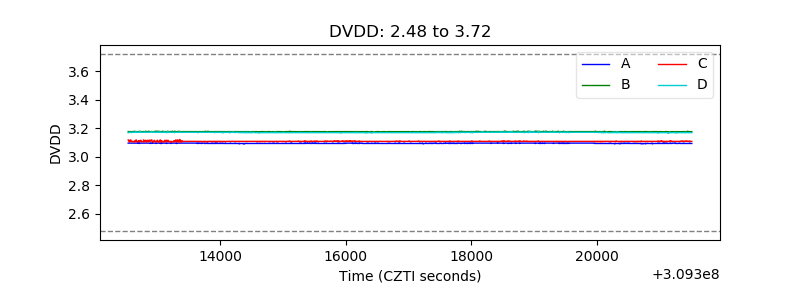 |
| Temperature 1 | 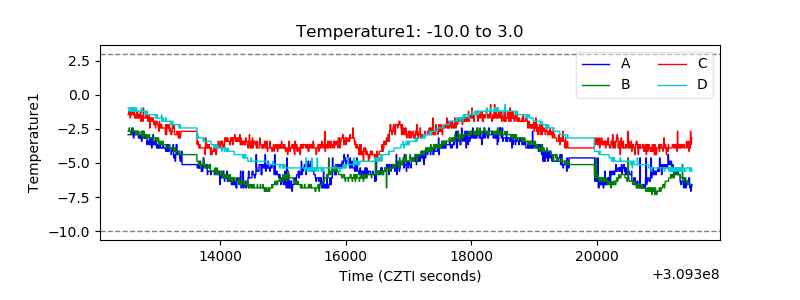 |
| Veto HV Monitor |  |
| Veto LLD |  |
| Alpha Counter |  |
| _CPM_Rate |  |
| CZT Counter |  |
| +2.5 Volts monitor |  |
| +5 Volts monitor |  |
| _ROLL_ROT |  |
| _Roll_DEC |  |
| _Roll_RA |  |
| Veto Counter |  |