| Param | Original file | Final file |
|---|---|---|
| Filename | modeM0/AS1A07_130T01_9000003246_21966cztM0_level2.evt | modeM0/AS1A07_130T01_9000003246_21966cztM0_level2_quad_clean.evt |
| Size (bytes) | 858,919,680 | 153,558,720 |
| Size | 819.1 MB | 146.4 MB |
| Events in quadrant A | 5,948,895 | 950,664 |
| Events in quadrant B | 6,452,775 | 967,681 |
| Events in quadrant C | 6,006,658 | 940,575 |
| Events in quadrant D | 6,740,634 | 910,443 |
| Mode M0 | |||
|---|---|---|---|
| Quadrant | BADHDUFLAG | Total packets | Discarded packets |
| A | 0 | 26065 | 4 |
| B | 0 | 27268 | 3 |
| C | 0 | 25989 | 3 |
| D | 0 | 28831 | 3 |
| Mode SS | |||
|---|---|---|---|
| Quadrant | BADHDUFLAG | Total packets | Discarded packets |
| A | 0 | 258 | 0 |
| B | 0 | 258 | 0 |
| C | 0 | 258 | 0 |
| D | 0 | 258 | 0 |
| Mode M9 | |||
|---|---|---|---|
| Quadrant | BADHDUFLAG | Total packets | Discarded packets |
| A | 0 | 15 | 0 |
| B | 0 | 16 | 0 |
| C | 0 | 16 | 0 |
| D | 0 | 16 | 0 |
| Quadrant | Total seconds | Saturated seconds | Saturation percentage |
|---|---|---|---|
| A | 12748 | 110 | 0.862880% |
| B | 12748 | 239 | 1.874804% |
| C | 12748 | 147 | 1.153122% |
| D | 12748 | 257 | 2.016003% |
Noise dominated data is calculated using 1-second bins in cleaned event files. If a bin has >2000 counts, and if more than 50% of those come from <1% of pixels, then it is considered to be noise-dominated and hence unusable.
| Quadrant | # 1 sec bins | Bins with >0 counts | Bins with >2000 counts | High rate bins dominated by noise | Noise dominated (total time) | Noise dominated (detector-on time) | Marked lightcurve |
|---|---|---|---|---|---|---|---|
| A | 14078 | 12748 | 13 | 13 | 0.09% | 0.10% | 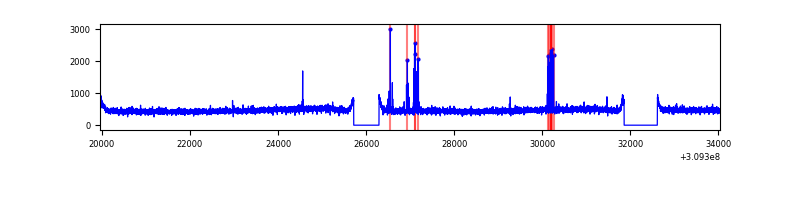 |
| B | 14078 | 12748 | 87 | 87 | 0.62% | 0.68% | 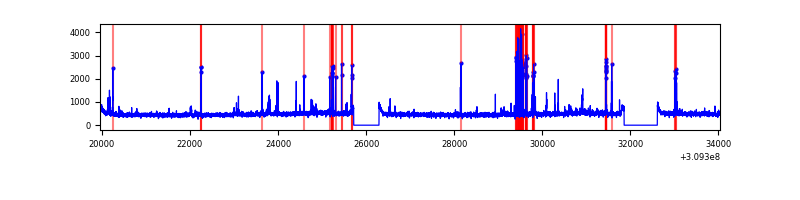 |
| C | 14078 | 12748 | 0 | 0 | 0.00% | 0.00% | 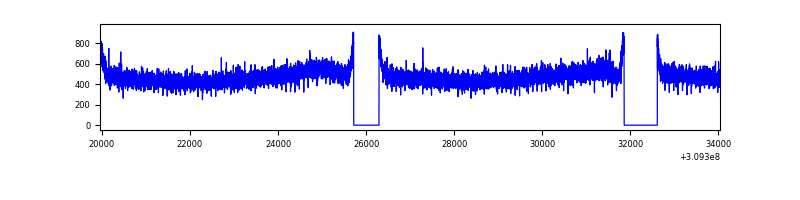 |
| D | 14078 | 12749 | 170 | 170 | 1.21% | 1.33% | 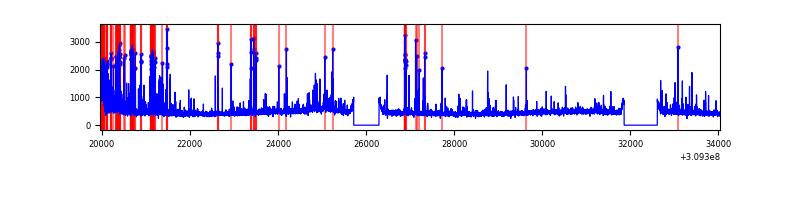 |
Top three noisy pixels from each quadrant. If the there are fewer than three noisy pixels in the level2.evt file, extra rows are filled as -1
| Pixel properties | Quadrant properties | ||||||
|---|---|---|---|---|---|---|---|
| Quadrant | DetID | PixID | Counts | Sigma | Mean | Median | Sigma |
| A | 10 | 253 | 68952 | 220.36 | 1523 | 1489 | 306.1 |
| A | 13 | 254 | 20583 | 62.37 | 1523 | 1489 | 306.1 |
| A | 3 | 137 | 13353 | 38.75 | 1523 | 1489 | 306.1 |
| B | 3 | 64 | 412587 | 1424.74 | 1518 | 1479 | 288.6 |
| B | 0 | 197 | 46701 | 156.72 | 1518 | 1479 | 288.6 |
| B | 12 | 111 | 36369 | 120.91 | 1518 | 1479 | 288.6 |
| C | 14 | 238 | 232995 | 670.71 | 1474 | 1483 | 345.2 |
| C | 8 | 128 | 14292 | 37.11 | 1474 | 1483 | 345.2 |
| C | 13 | 61 | 10291 | 25.52 | 1474 | 1483 | 345.2 |
| D | 13 | 174 | 700784 | 1944.77 | 1483 | 1441 | 359.6 |
| D | 2 | 136 | 264903 | 732.65 | 1483 | 1441 | 359.6 |
| D | 7 | 238 | 54829 | 148.46 | 1483 | 1441 | 359.6 |
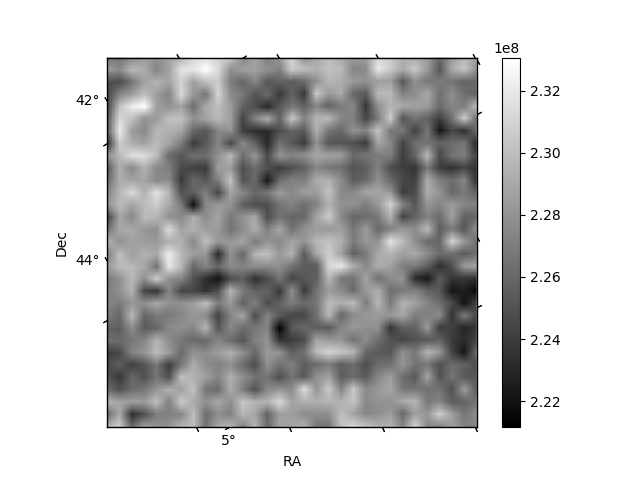
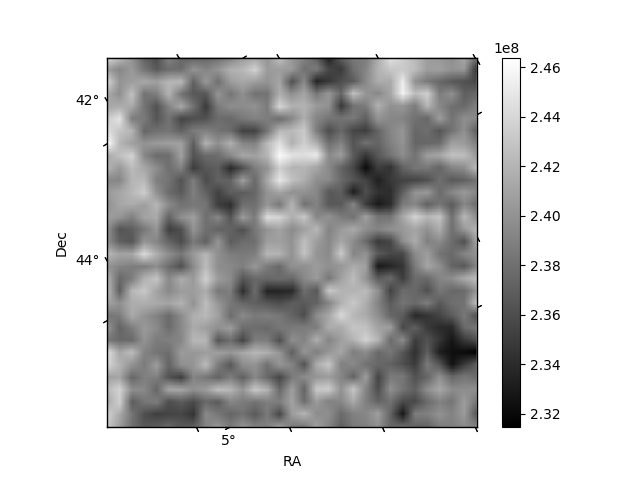
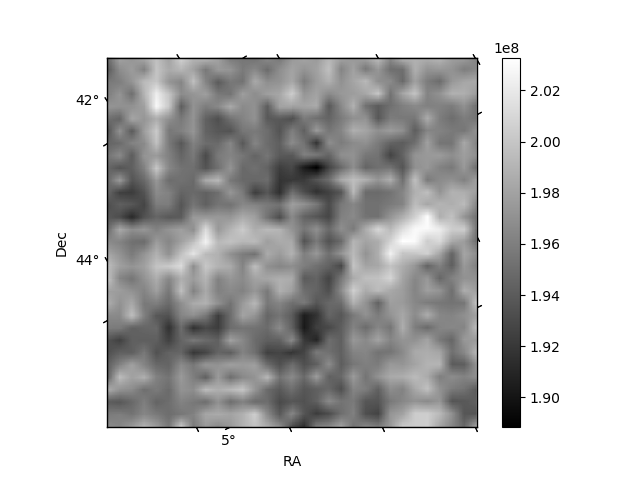
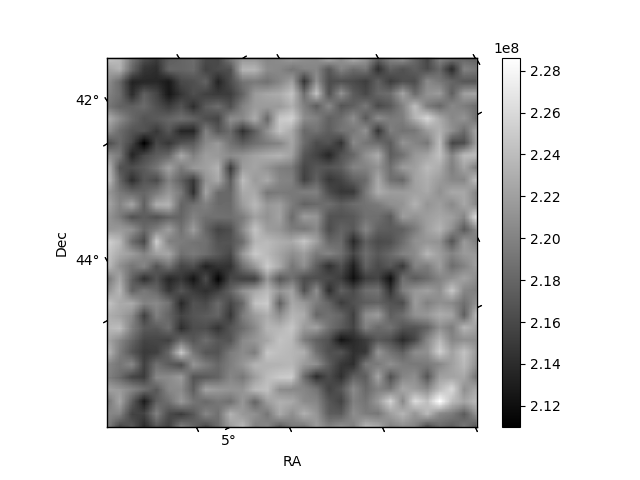
Histogram calculated using DETX and DETY for each event in the final _common_clean file
| Quadrant A |  |
 |
Quadrant B |
|---|---|---|---|
| Quadrant D |  |
 |
Quadrant C |
| Plot type | Count rate plots | Images |
|---|---|---|
| Comparison with Poisson distribution Blue bars denote a histogram of data divided into 1 sec bins. Red curve is a Poisson curve with rate = median count rate of data. |
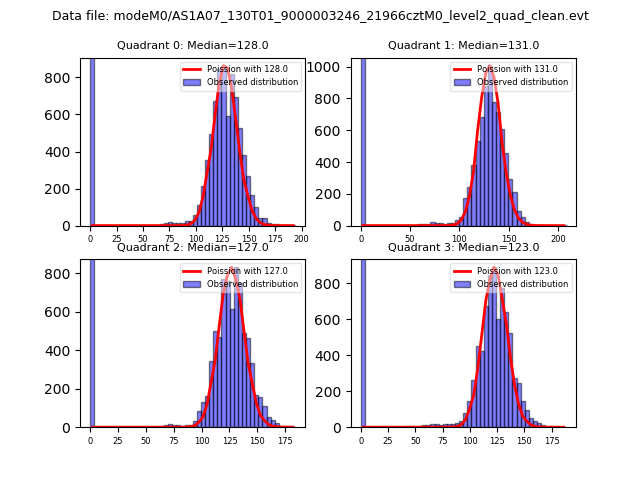 |
 |
| Quadrant-wise count rates Data is divided into 100 sec bins |
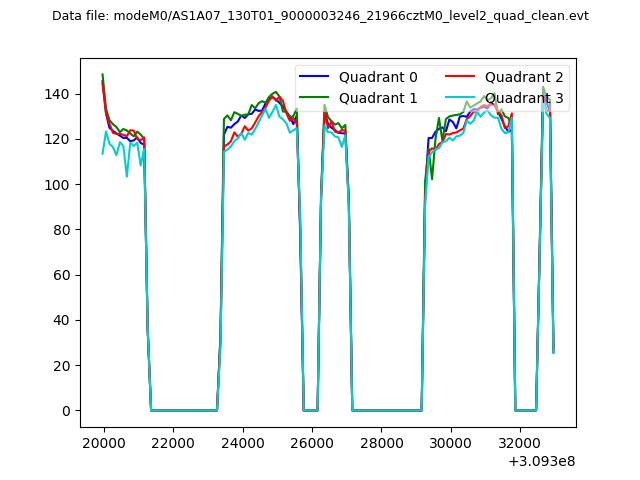 |
|
| Module-wise count rates for Quadrant A Data is divided into 100 sec bins |
 |
 |
| Module-wise count rates for Quadrant B Data is divided into 100 sec bins |
 |
 |
| Module-wise count rates for Quadrant C Data is divided into 100 sec bins |
 |
 |
| Module-wise count rates for Quadrant D Data is divided into 100 sec bins |
 |
 |
| Parameter | Plot |
|---|---|
| CZT HV Monitor |  |
| D_VDD | 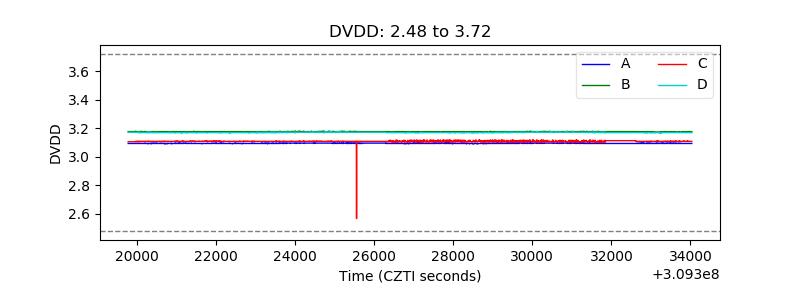 |
| Temperature 1 |  |
| Veto HV Monitor |  |
| Veto LLD |  |
| Alpha Counter |  |
| _CPM_Rate | 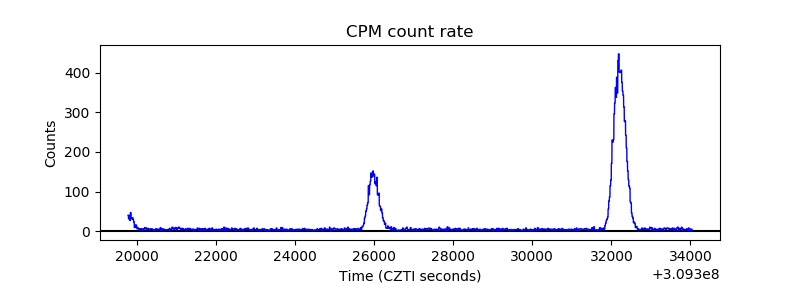 |
| CZT Counter |  |
| +2.5 Volts monitor |  |
| +5 Volts monitor |  |
| _ROLL_ROT |  |
| _Roll_DEC |  |
| _Roll_RA |  |
| Veto Counter |  |