| Param | Original file | Final file |
|---|---|---|
| Filename | modeM0/AS1A07_130T01_9000003246_21969cztM0_level2.evt | modeM0/AS1A07_130T01_9000003246_21969cztM0_level2_quad_clean.evt |
| Size (bytes) | 462,758,400 | 68,590,080 |
| Size | 441.3 MB | 65.4 MB |
| Events in quadrant A | 3,272,949 | 409,030 |
| Events in quadrant B | 3,432,275 | 417,830 |
| Events in quadrant C | 3,258,024 | 399,998 |
| Events in quadrant D | 3,607,512 | 394,175 |
| Mode M0 | |||
|---|---|---|---|
| Quadrant | BADHDUFLAG | Total packets | Discarded packets |
| A | 0 | 13771 | 2 |
| B | 0 | 14187 | 2 |
| C | 0 | 13622 | 2 |
| D | 0 | 14891 | 2 |
| Mode SS | |||
|---|---|---|---|
| Quadrant | BADHDUFLAG | Total packets | Discarded packets |
| A | 0 | 132 | 0 |
| B | 0 | 132 | 0 |
| C | 0 | 132 | 0 |
| D | 0 | 132 | 0 |
| Mode M9 | |||
|---|---|---|---|
| Quadrant | BADHDUFLAG | Total packets | Discarded packets |
| A | 0 | 16 | 0 |
| B | 0 | 17 | 0 |
| C | 0 | 17 | 0 |
| D | 0 | 17 | 0 |
| Quadrant | Total seconds | Saturated seconds | Saturation percentage |
|---|---|---|---|
| A | 6536 | 57 | 0.872093% |
| B | 6536 | 87 | 1.331089% |
| C | 6536 | 78 | 1.193390% |
| D | 6536 | 104 | 1.591187% |
Noise dominated data is calculated using 1-second bins in cleaned event files. If a bin has >2000 counts, and if more than 50% of those come from <1% of pixels, then it is considered to be noise-dominated and hence unusable.
| Quadrant | # 1 sec bins | Bins with >0 counts | Bins with >2000 counts | High rate bins dominated by noise | Noise dominated (total time) | Noise dominated (detector-on time) | Marked lightcurve |
|---|---|---|---|---|---|---|---|
| A | 7671 | 6536 | 1 | 1 | 0.01% | 0.02% | 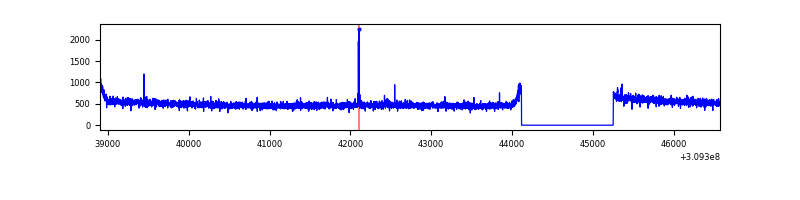 |
| B | 7671 | 6536 | 13 | 13 | 0.17% | 0.20% | 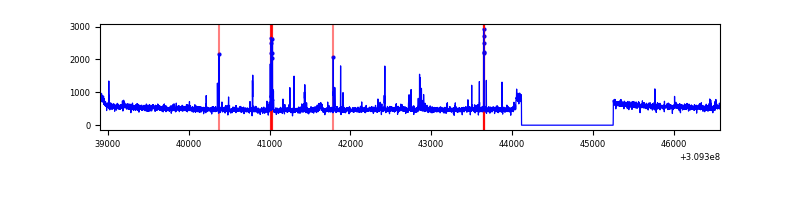 |
| C | 7671 | 6536 | 0 | 0 | 0.00% | 0.00% | 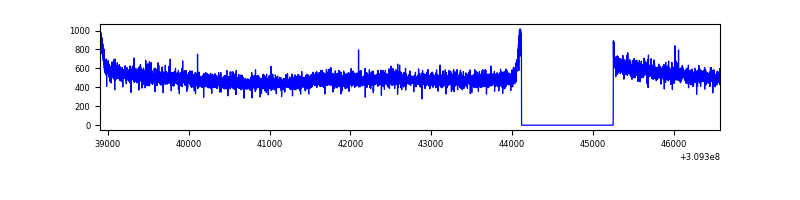 |
| D | 7671 | 6536 | 64 | 64 | 0.83% | 0.98% | 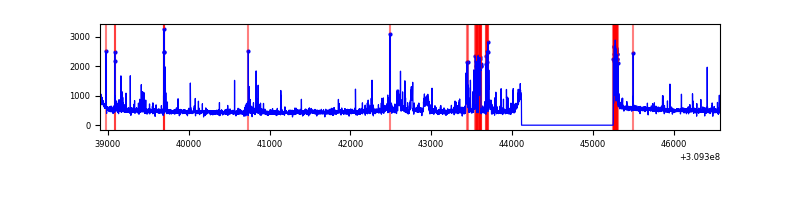 |
Top three noisy pixels from each quadrant. If the there are fewer than three noisy pixels in the level2.evt file, extra rows are filled as -1
| Pixel properties | Quadrant properties | ||||||
|---|---|---|---|---|---|---|---|
| Quadrant | DetID | PixID | Counts | Sigma | Mean | Median | Sigma |
| A | 13 | 254 | 11142 | 61.22 | 844 | 830 | 168.4 |
| A | 5 | 242 | 8899 | 47.91 | 844 | 830 | 168.4 |
| A | 0 | 226 | 7263 | 38.19 | 844 | 830 | 168.4 |
| B | 3 | 64 | 103791 | 653.25 | 837 | 817 | 157.6 |
| B | 12 | 111 | 19389 | 117.82 | 837 | 817 | 157.6 |
| B | 11 | 111 | 17427 | 105.37 | 837 | 817 | 157.6 |
| C | 14 | 238 | 127778 | 685.77 | 799 | 807 | 185.2 |
| C | 10 | 91 | 11981 | 60.35 | 799 | 807 | 185.2 |
| C | 13 | 61 | 5679 | 26.31 | 799 | 807 | 185.2 |
| D | 13 | 174 | 280423 | 1411.98 | 813 | 790 | 198.0 |
| D | 2 | 136 | 141390 | 709.94 | 813 | 790 | 198.0 |
| D | 1 | 52 | 28907 | 141.97 | 813 | 790 | 198.0 |
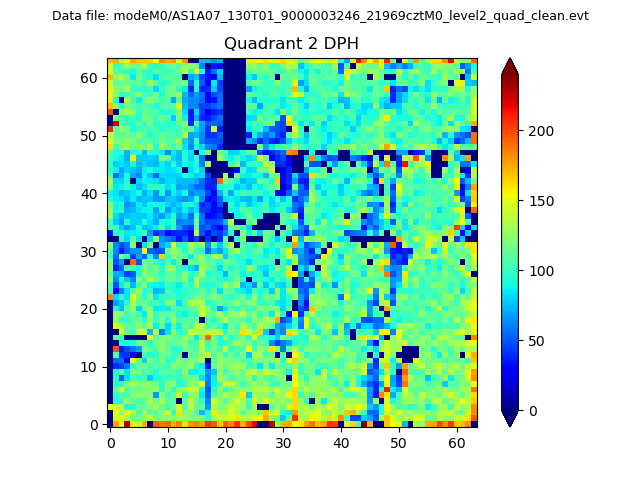
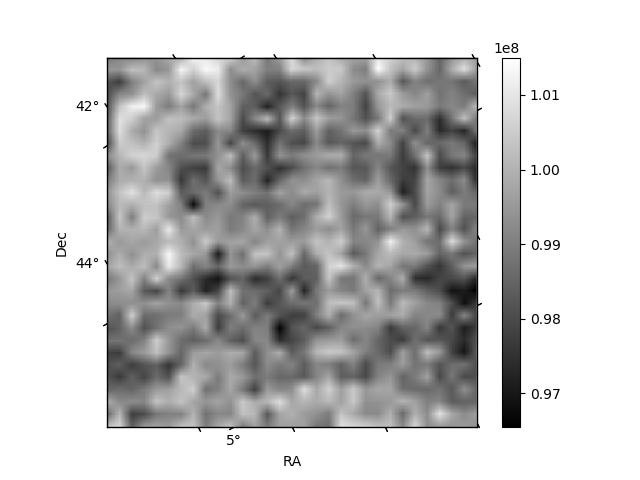
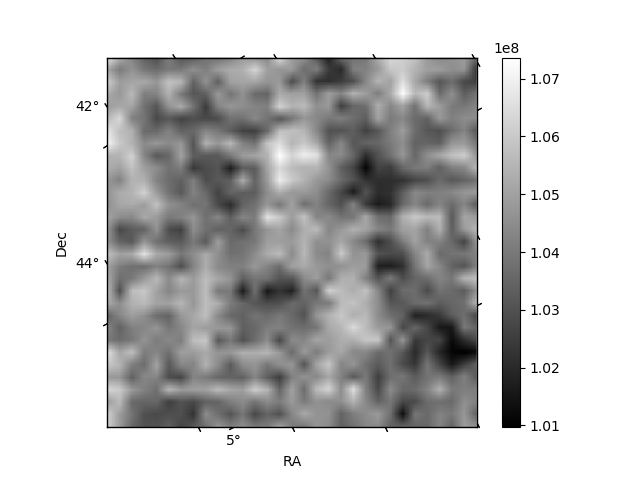
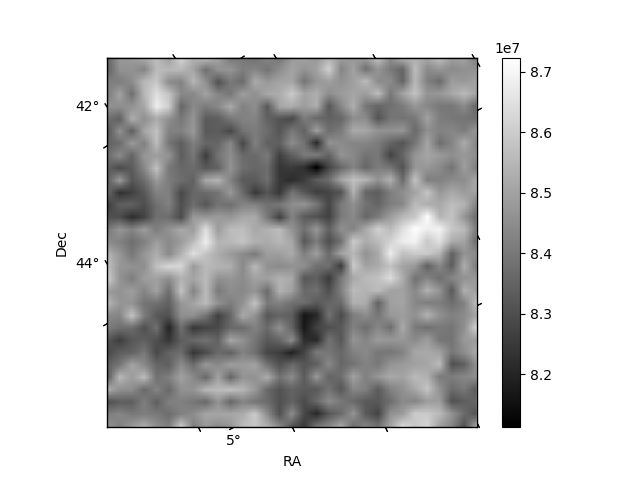
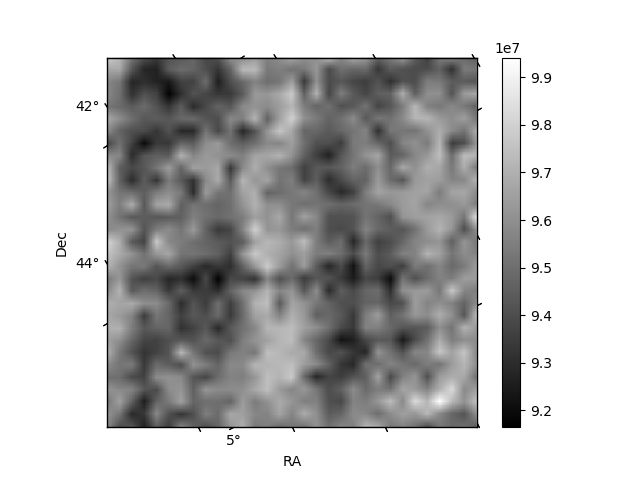
Histogram calculated using DETX and DETY for each event in the final _common_clean file
| Quadrant A | 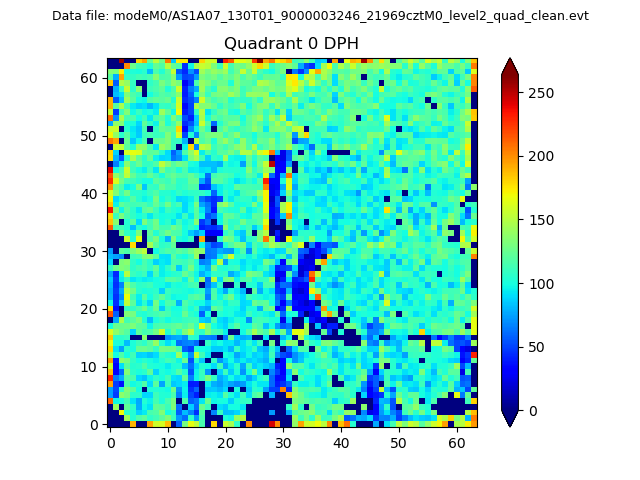 |
 |
Quadrant B |
|---|---|---|---|
| Quadrant D | 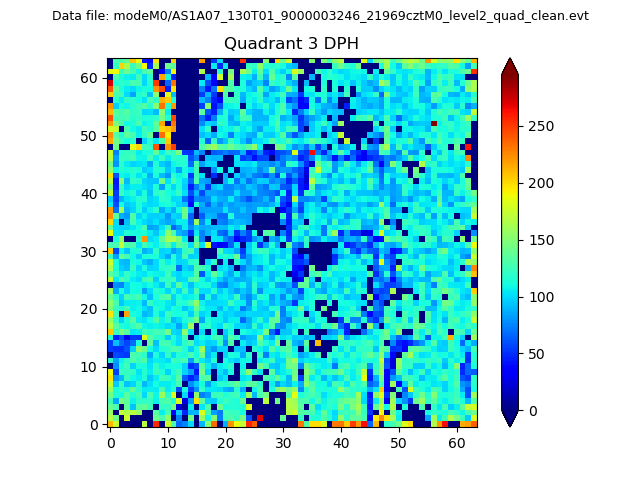 |
 |
Quadrant C |
| Plot type | Count rate plots | Images |
|---|---|---|
| Comparison with Poisson distribution Blue bars denote a histogram of data divided into 1 sec bins. Red curve is a Poisson curve with rate = median count rate of data. |
 |
 |
| Quadrant-wise count rates Data is divided into 100 sec bins |
 |
|
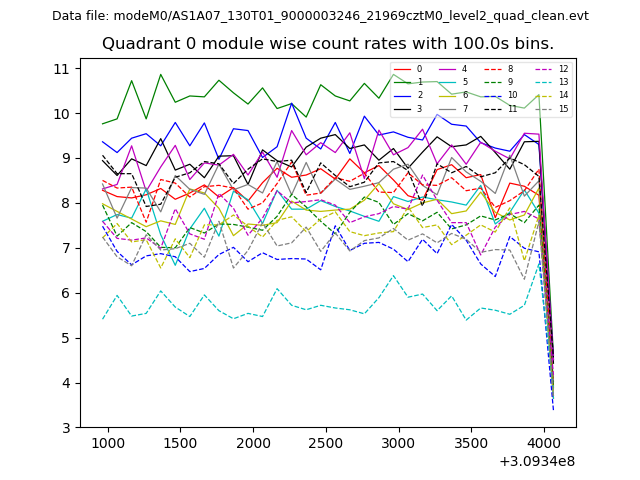
| Module-wise count rates for Quadrant A Data is divided into 100 sec bins |
 |
 |
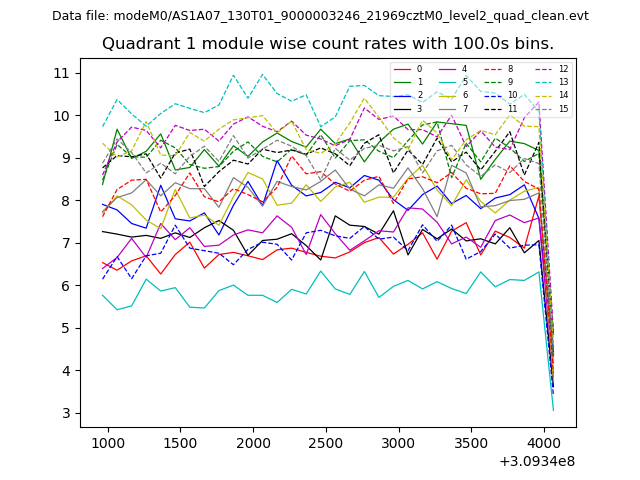
| Module-wise count rates for Quadrant B Data is divided into 100 sec bins |
 |
 |
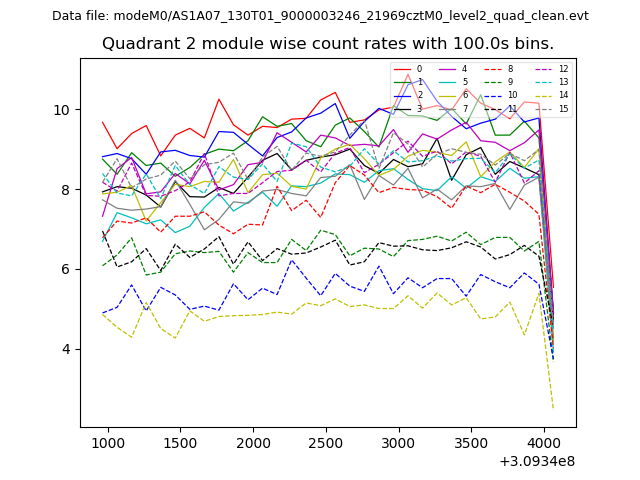
| Module-wise count rates for Quadrant C Data is divided into 100 sec bins |
 |
 |
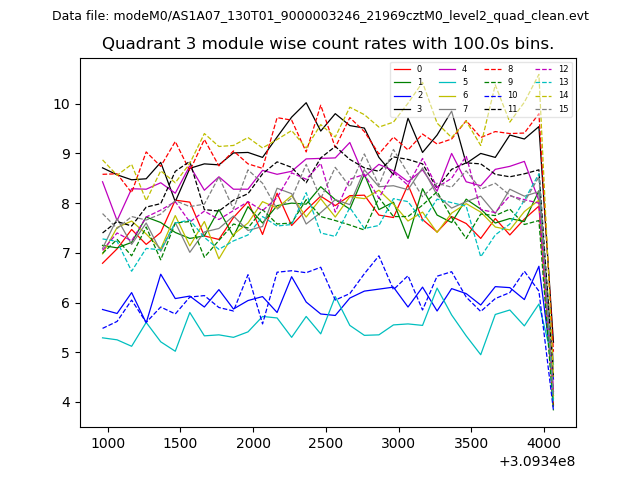
| Module-wise count rates for Quadrant D Data is divided into 100 sec bins |
 |
 |
| Parameter | Plot |
|---|---|
| CZT HV Monitor | 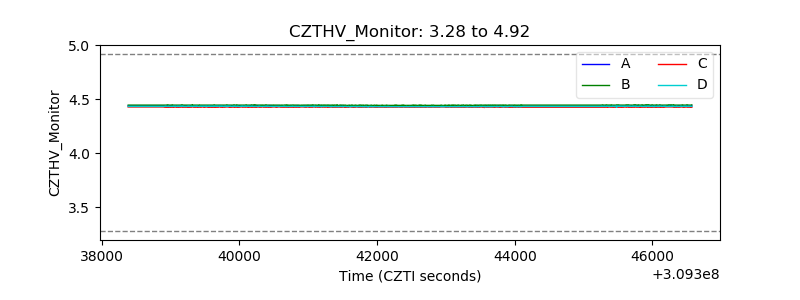 |
| D_VDD | 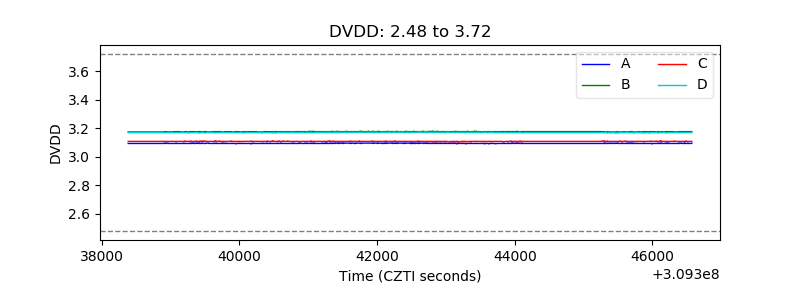 |
| Temperature 1 | 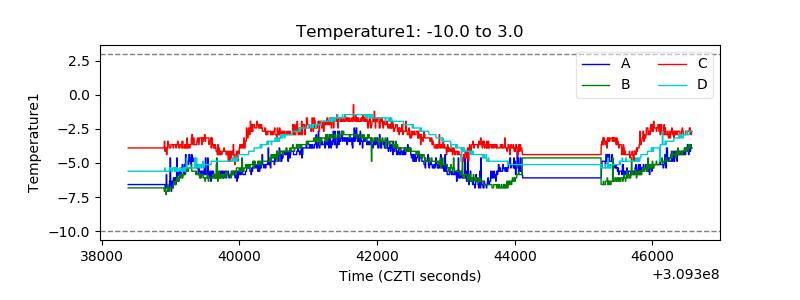 |
| Veto HV Monitor | 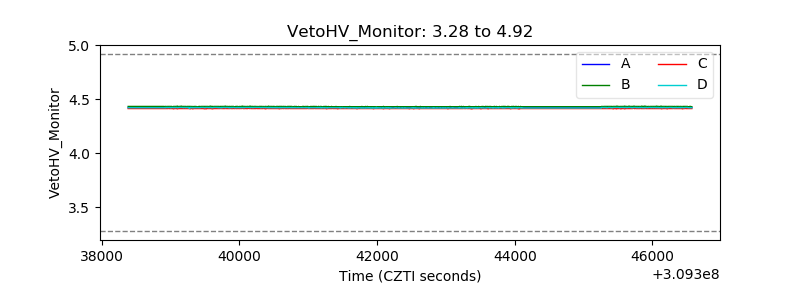 |
| Veto LLD | 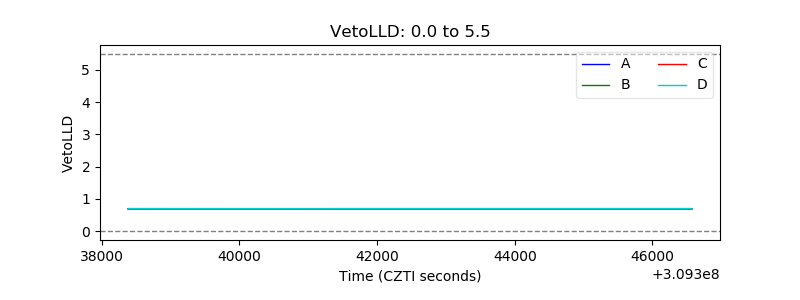 |
| Alpha Counter | 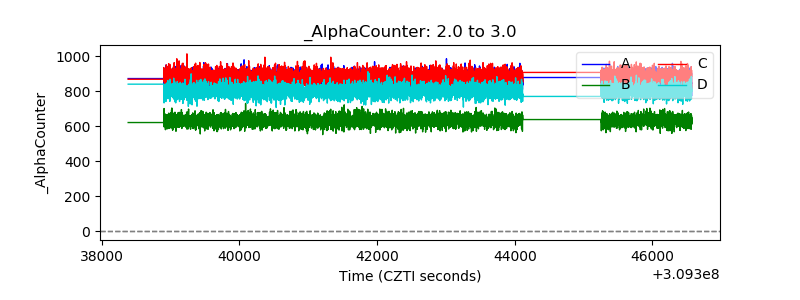 |
| _CPM_Rate | 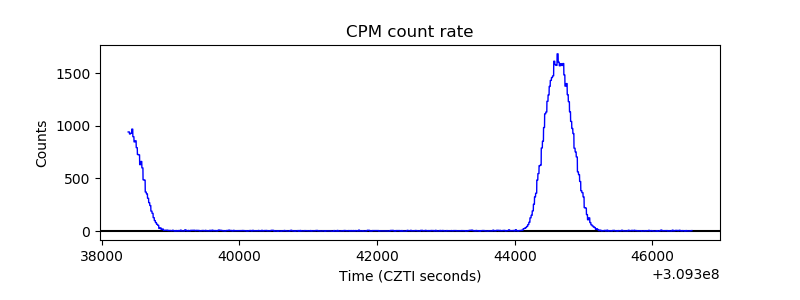 |
| CZT Counter | 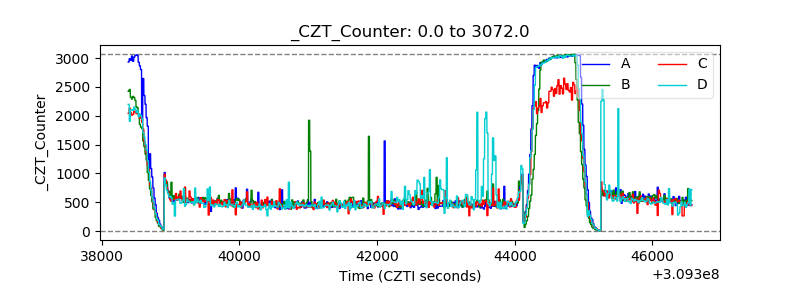 |
| +2.5 Volts monitor |  |
| +5 Volts monitor |  |
| _ROLL_ROT | 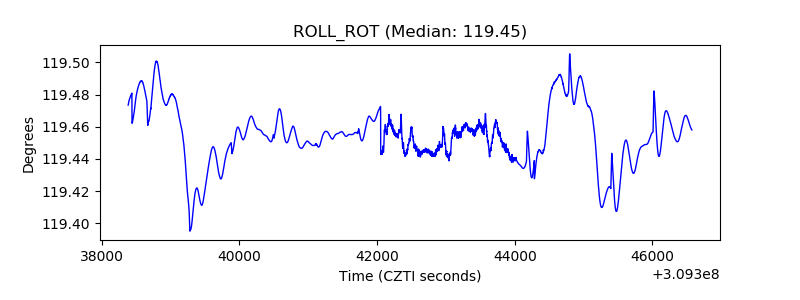 |
| _Roll_DEC | 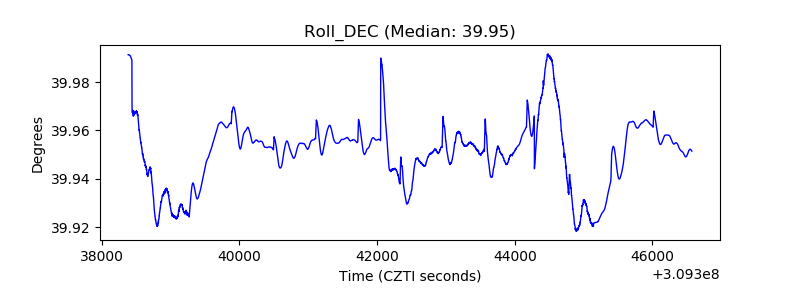 |
| _Roll_RA | 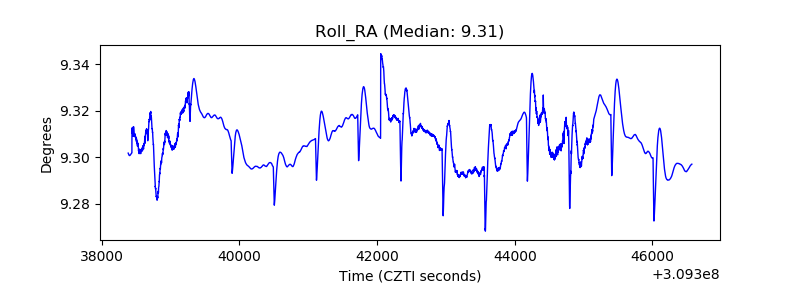 |
| Veto Counter | 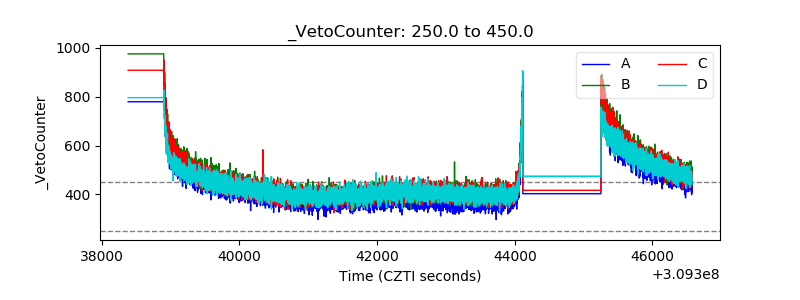 |