| Param | Original file | Final file |
|---|---|---|
| Filename | modeM0/AS1A07_130T01_9000003246_21970cztM0_level2.evt | modeM0/AS1A07_130T01_9000003246_21970cztM0_level2_quad_clean.evt |
| Size (bytes) | 503,835,840 | 89,064,000 |
| Size | 480.5 MB | 84.9 MB |
| Events in quadrant A | 3,618,671 | 565,752 |
| Events in quadrant B | 3,729,671 | 572,179 |
| Events in quadrant C | 3,578,724 | 545,925 |
| Events in quadrant D | 3,868,979 | 538,222 |
| Mode M0 | |||
|---|---|---|---|
| Quadrant | BADHDUFLAG | Total packets | Discarded packets |
| A | 0 | 15076 | 3 |
| B | 0 | 15418 | 2 |
| C | 0 | 14772 | 2 |
| D | 0 | 15828 | 2 |
| Mode SS | |||
|---|---|---|---|
| Quadrant | BADHDUFLAG | Total packets | Discarded packets |
| A | 0 | 140 | 0 |
| B | 0 | 140 | 0 |
| C | 0 | 140 | 0 |
| D | 0 | 140 | 0 |
| Mode M9 | |||
|---|---|---|---|
| Quadrant | BADHDUFLAG | Total packets | Discarded packets |
| A | 0 | 23 | 0 |
| B | 0 | 23 | 0 |
| C | 0 | 23 | 0 |
| D | 0 | 23 | 0 |
| Quadrant | Total seconds | Saturated seconds | Saturation percentage |
|---|---|---|---|
| A | 6816 | 106 | 1.555164% |
| B | 6816 | 145 | 2.127347% |
| C | 6816 | 128 | 1.877934% |
| D | 6817 | 146 | 2.141705% |
Noise dominated data is calculated using 1-second bins in cleaned event files. If a bin has >2000 counts, and if more than 50% of those come from <1% of pixels, then it is considered to be noise-dominated and hence unusable.
| Quadrant | # 1 sec bins | Bins with >0 counts | Bins with >2000 counts | High rate bins dominated by noise | Noise dominated (total time) | Noise dominated (detector-on time) | Marked lightcurve |
|---|---|---|---|---|---|---|---|
| A | 9146 | 6816 | 0 | 0 | 0.00% | 0.00% | 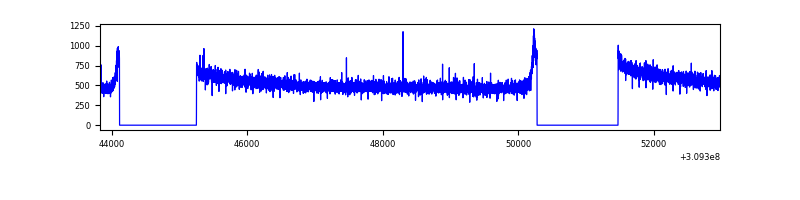 |
| B | 9146 | 6816 | 19 | 19 | 0.21% | 0.28% | 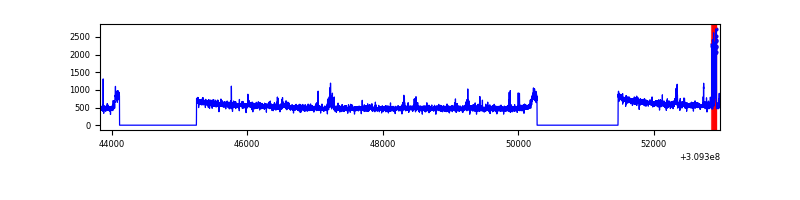 |
| C | 9146 | 6816 | 0 | 0 | 0.00% | 0.00% | 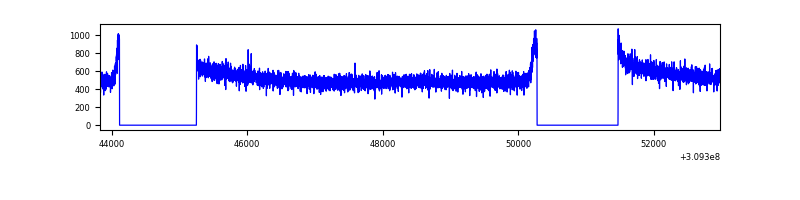 |
| D | 9147 | 6817 | 64 | 64 | 0.70% | 0.94% | 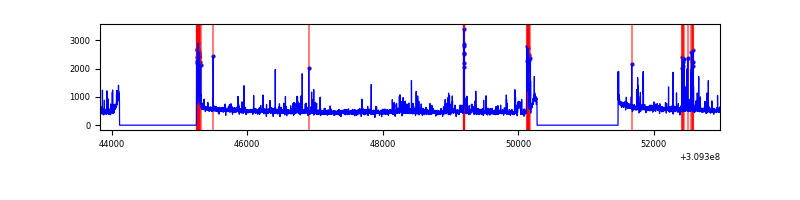 |
Top three noisy pixels from each quadrant. If the there are fewer than three noisy pixels in the level2.evt file, extra rows are filled as -1
| Pixel properties | Quadrant properties | ||||||
|---|---|---|---|---|---|---|---|
| Quadrant | DetID | PixID | Counts | Sigma | Mean | Median | Sigma |
| A | 13 | 254 | 11837 | 59.1 | 936 | 919 | 184.7 |
| A | 0 | 226 | 8124 | 39.0 | 936 | 919 | 184.7 |
| A | 3 | 137 | 7645 | 36.41 | 936 | 919 | 184.7 |
| B | 3 | 64 | 65981 | 377.35 | 920 | 900 | 172.5 |
| B | 0 | 230 | 26275 | 147.13 | 920 | 900 | 172.5 |
| B | 0 | 197 | 25731 | 143.97 | 920 | 900 | 172.5 |
| C | 14 | 238 | 140605 | 687.75 | 881 | 891 | 203.1 |
| C | 13 | 61 | 6278 | 26.52 | 881 | 891 | 203.1 |
| C | 0 | 10 | 2782 | 9.31 | 881 | 891 | 203.1 |
| D | 2 | 136 | 202117 | 915.66 | 900 | 875 | 219.8 |
| D | 13 | 174 | 151955 | 687.42 | 900 | 875 | 219.8 |
| D | 7 | 238 | 51296 | 229.42 | 900 | 875 | 219.8 |
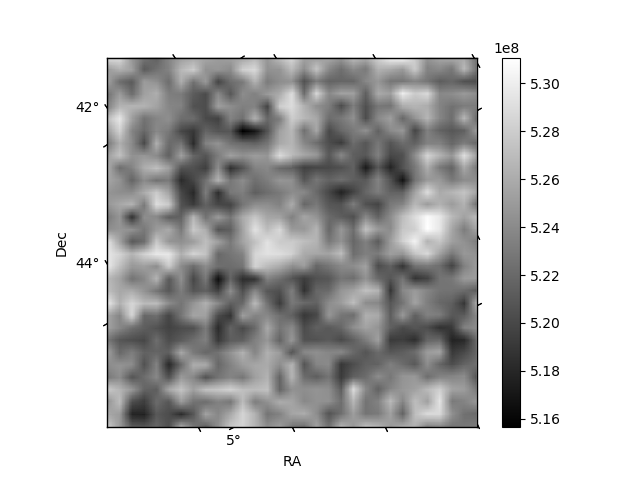
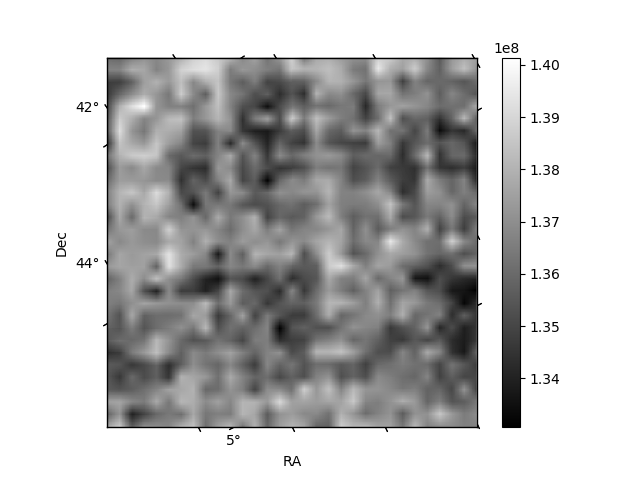
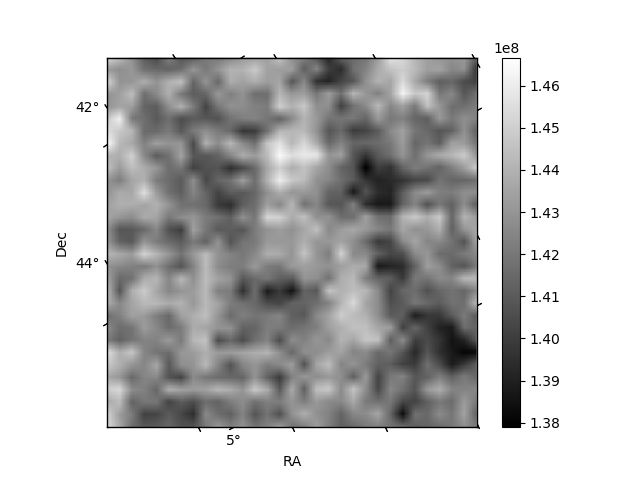
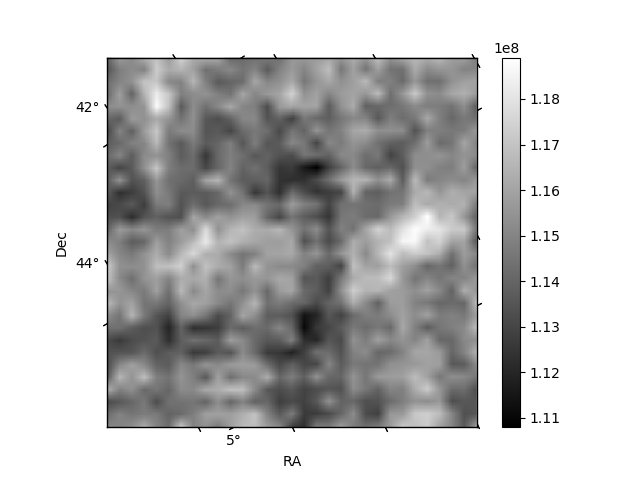
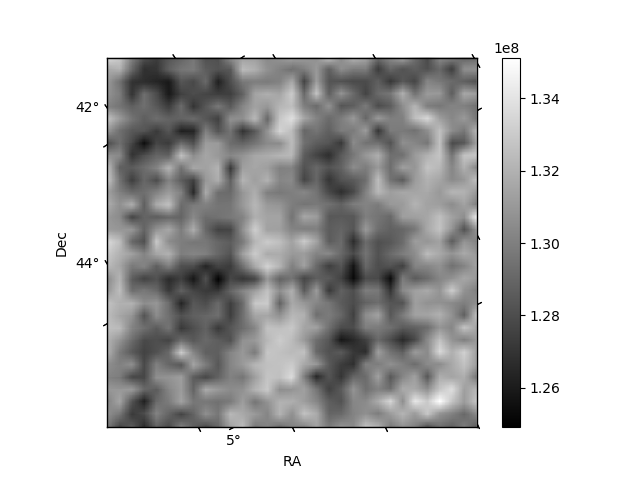
Histogram calculated using DETX and DETY for each event in the final _common_clean file
| Quadrant A | 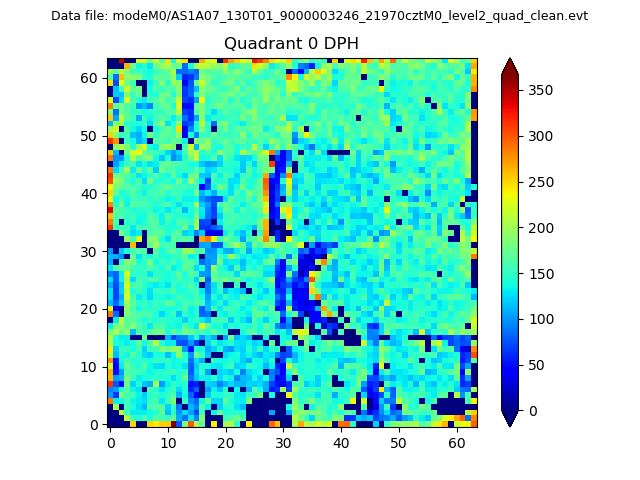 |
 |
Quadrant B |
|---|---|---|---|
| Quadrant D | 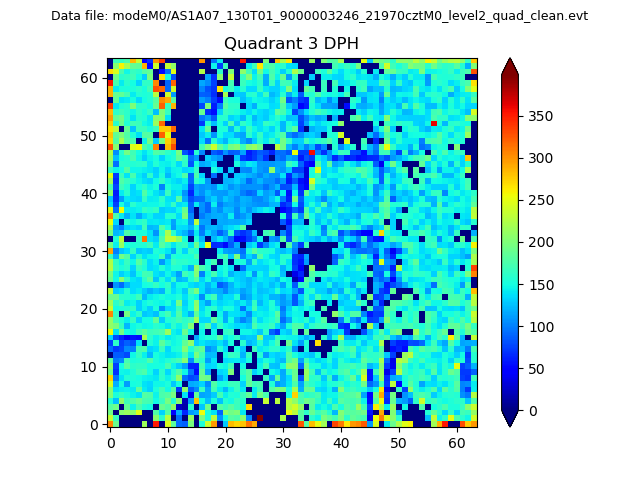 |
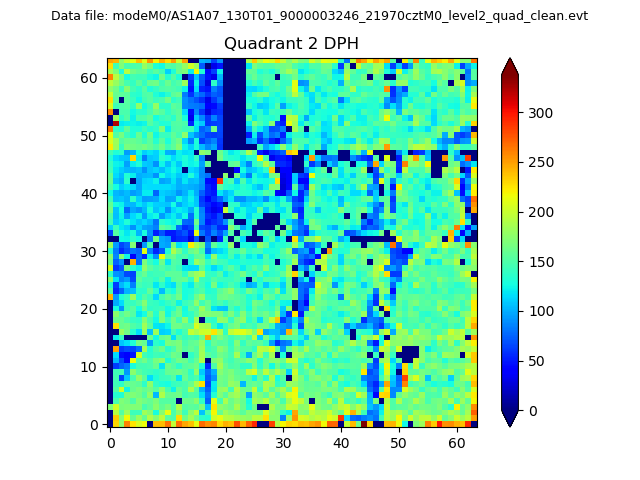 |
Quadrant C |
| Plot type | Count rate plots | Images |
|---|---|---|
| Comparison with Poisson distribution Blue bars denote a histogram of data divided into 1 sec bins. Red curve is a Poisson curve with rate = median count rate of data. |
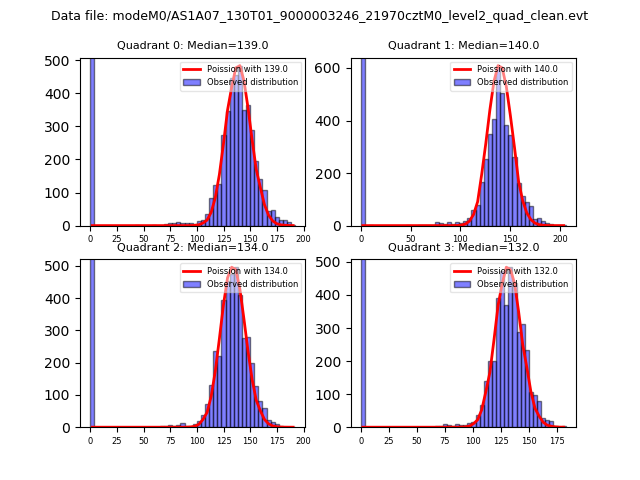 |
 |
| Quadrant-wise count rates Data is divided into 100 sec bins |
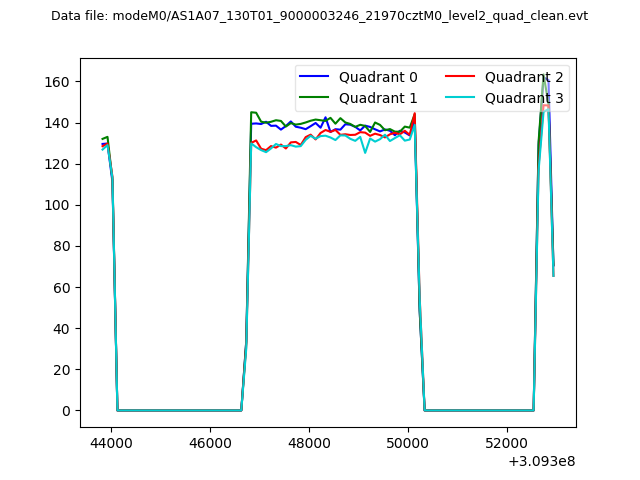 |
|
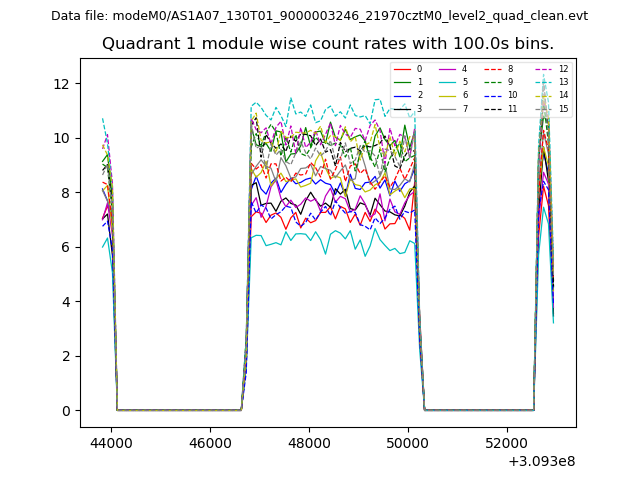
| Module-wise count rates for Quadrant A Data is divided into 100 sec bins |
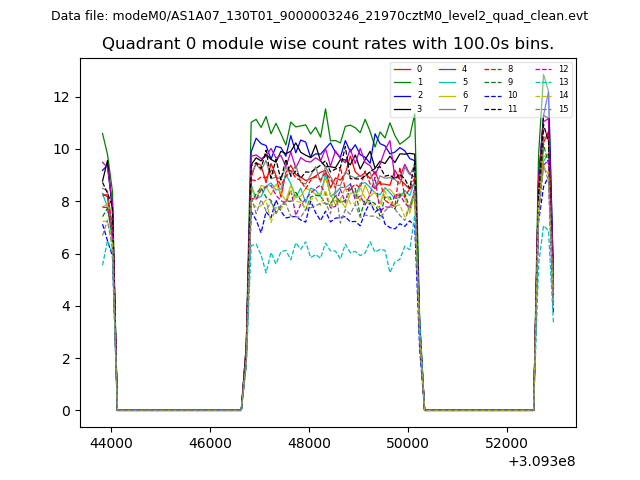 |
 |
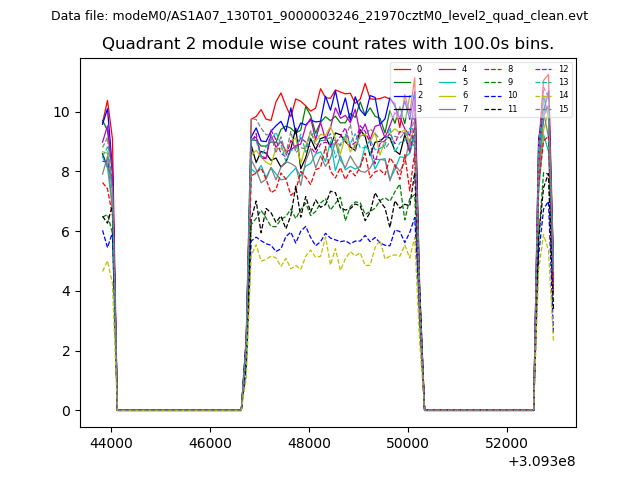
| Module-wise count rates for Quadrant B Data is divided into 100 sec bins |
 |
 |
| Module-wise count rates for Quadrant C Data is divided into 100 sec bins |
 |
 |
| Module-wise count rates for Quadrant D Data is divided into 100 sec bins |
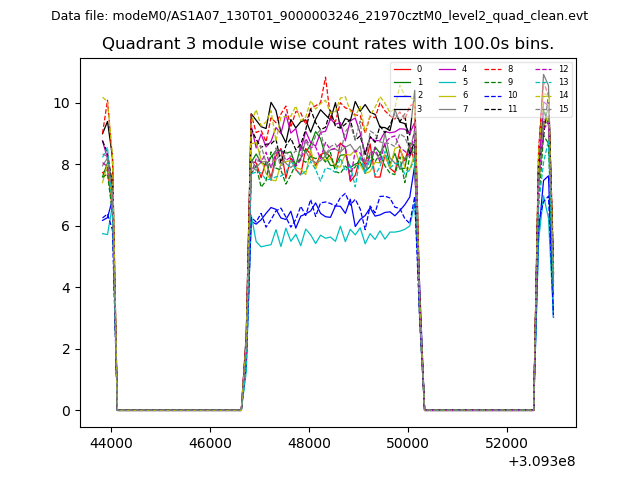 |
 |
| Parameter | Plot |
|---|---|
| CZT HV Monitor | 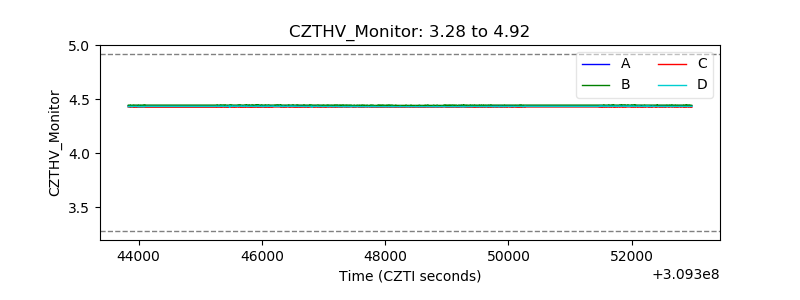 |
| D_VDD | 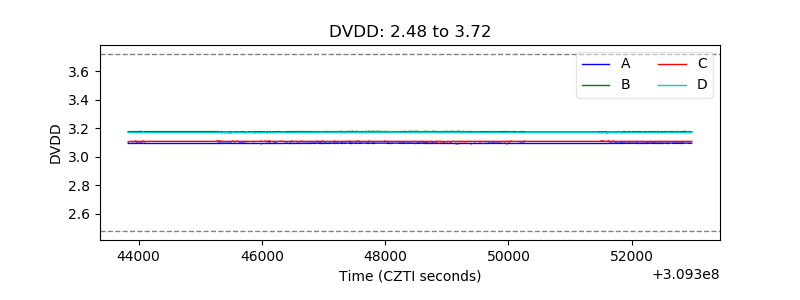 |
| Temperature 1 | 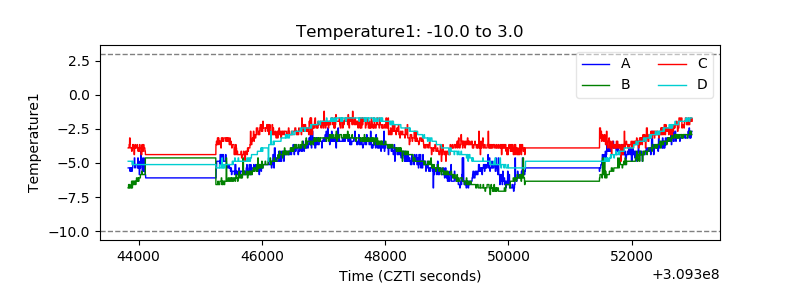 |
| Veto HV Monitor |  |
| Veto LLD | 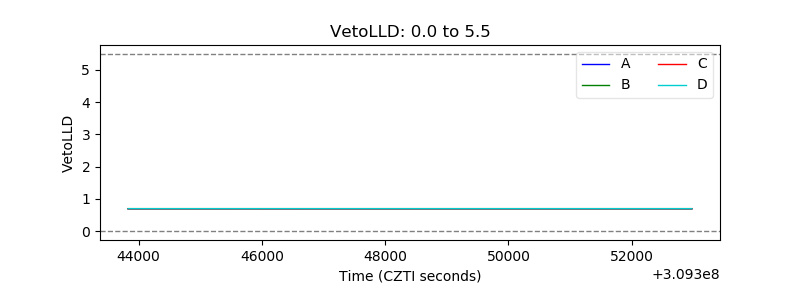 |
| Alpha Counter | 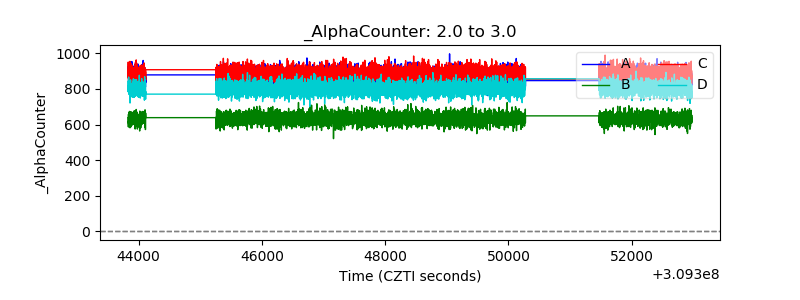 |
| _CPM_Rate | 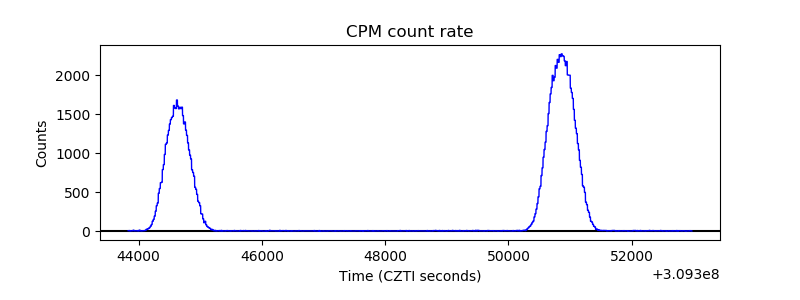 |
| CZT Counter | 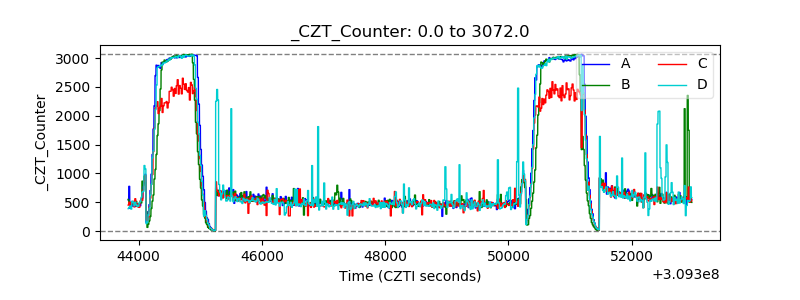 |
| +2.5 Volts monitor | 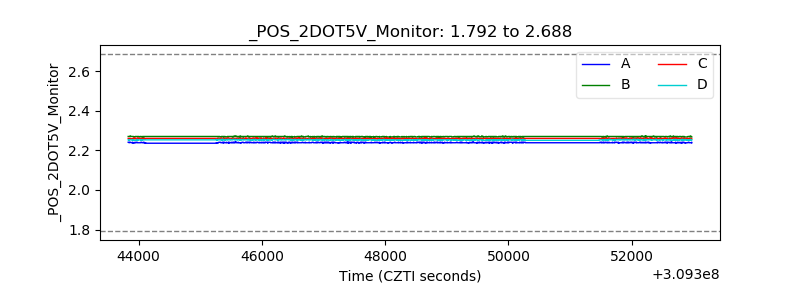 |
| +5 Volts monitor |  |
| _ROLL_ROT | 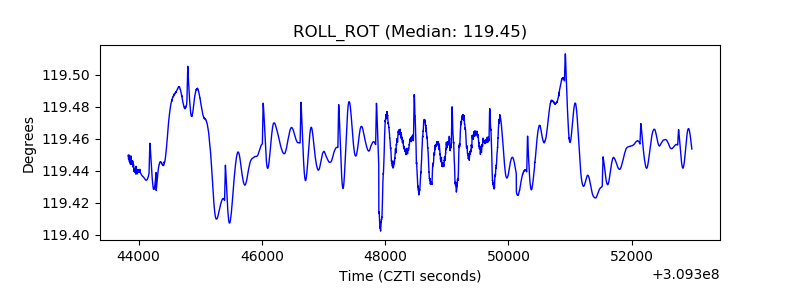 |
| _Roll_DEC | 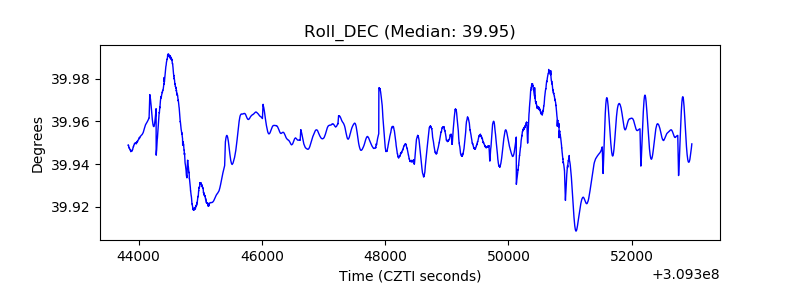 |
| _Roll_RA | 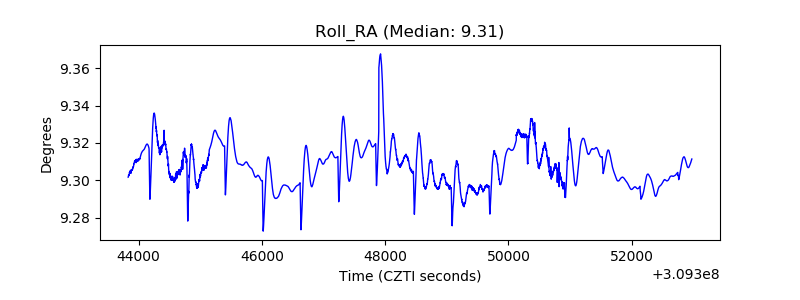 |
| Veto Counter | 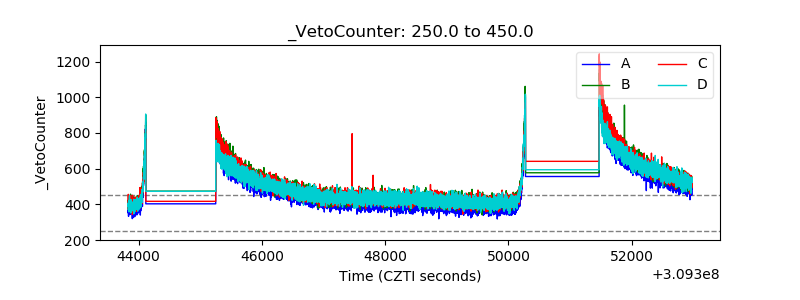 |