| Param | Original file | Final file |
|---|---|---|
| Filename | modeM0/AS1A07_130T01_9000003246_21971cztM0_level2.evt | modeM0/AS1A07_130T01_9000003246_21971cztM0_level2_quad_clean.evt |
| Size (bytes) | 507,404,160 | 100,702,080 |
| Size | 483.9 MB | 96.0 MB |
| Events in quadrant A | 3,509,010 | 668,408 |
| Events in quadrant B | 3,722,740 | 675,410 |
| Events in quadrant C | 3,442,279 | 639,587 |
| Events in quadrant D | 4,265,724 | 627,139 |
| Mode M0 | |||
|---|---|---|---|
| Quadrant | BADHDUFLAG | Total packets | Discarded packets |
| A | 0 | 14542 | 1 |
| B | 0 | 15207 | 1 |
| C | 0 | 14141 | 1 |
| D | 0 | 16684 | 1 |
| Mode SS | |||
|---|---|---|---|
| Quadrant | BADHDUFLAG | Total packets | Discarded packets |
| A | 0 | 128 | 0 |
| B | 0 | 128 | 0 |
| C | 0 | 128 | 0 |
| D | 0 | 128 | 0 |
| Mode M9 | |||
|---|---|---|---|
| Quadrant | BADHDUFLAG | Total packets | Discarded packets |
| A | 0 | 13 | 0 |
| B | 0 | 13 | 0 |
| C | 0 | 13 | 0 |
| D | 0 | 13 | 0 |
| Quadrant | Total seconds | Saturated seconds | Saturation percentage |
|---|---|---|---|
| A | 6293 | 113 | 1.795646% |
| B | 6294 | 161 | 2.557992% |
| C | 6294 | 130 | 2.065459% |
| D | 6294 | 194 | 3.082301% |
Noise dominated data is calculated using 1-second bins in cleaned event files. If a bin has >2000 counts, and if more than 50% of those come from <1% of pixels, then it is considered to be noise-dominated and hence unusable.
| Quadrant | # 1 sec bins | Bins with >0 counts | Bins with >2000 counts | High rate bins dominated by noise | Noise dominated (total time) | Noise dominated (detector-on time) | Marked lightcurve |
|---|---|---|---|---|---|---|---|
| A | 7558 | 6293 | 2 | 2 | 0.03% | 0.03% | 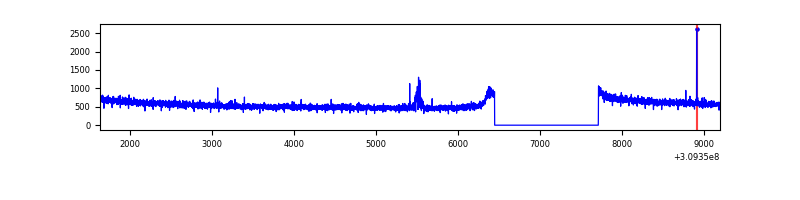 |
| B | 7559 | 6294 | 39 | 39 | 0.52% | 0.62% | 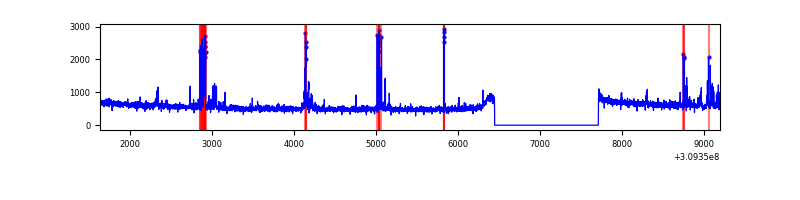 |
| C | 7559 | 6294 | 0 | 0 | 0.00% | 0.00% | 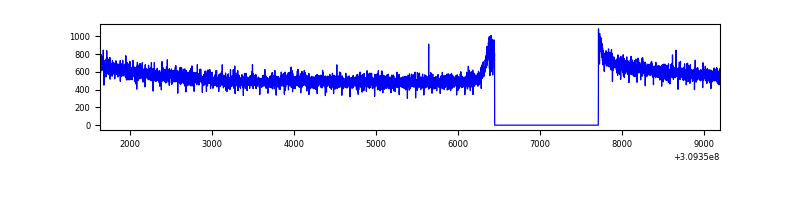 |
| D | 7559 | 6294 | 82 | 82 | 1.08% | 1.30% | 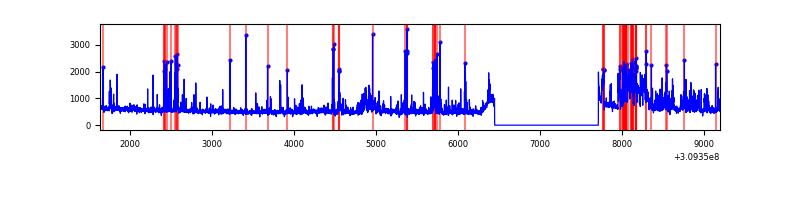 |
Top three noisy pixels from each quadrant. If the there are fewer than three noisy pixels in the level2.evt file, extra rows are filled as -1
| Pixel properties | Quadrant properties | ||||||
|---|---|---|---|---|---|---|---|
| Quadrant | DetID | PixID | Counts | Sigma | Mean | Median | Sigma |
| A | 4 | 2 | 20453 | 110.42 | 902 | 888 | 177.2 |
| A | 13 | 254 | 11135 | 57.83 | 902 | 888 | 177.2 |
| A | 0 | 226 | 7895 | 39.55 | 902 | 888 | 177.2 |
| B | 3 | 64 | 175697 | 1071.88 | 882 | 864 | 163.1 |
| B | 0 | 197 | 67305 | 407.34 | 882 | 864 | 163.1 |
| B | 0 | 230 | 32979 | 196.89 | 882 | 864 | 163.1 |
| C | 14 | 238 | 135215 | 688.56 | 848 | 856 | 195.1 |
| C | 13 | 61 | 5931 | 26.01 | 848 | 856 | 195.1 |
| C | 15 | 78 | 2043 | 6.08 | 848 | 856 | 195.1 |
| D | 7 | 223 | 367019 | 1769.14 | 866 | 843 | 207.0 |
| D | 1 | 52 | 359831 | 1734.41 | 866 | 843 | 207.0 |
| D | 2 | 136 | 125873 | 604.07 | 866 | 843 | 207.0 |
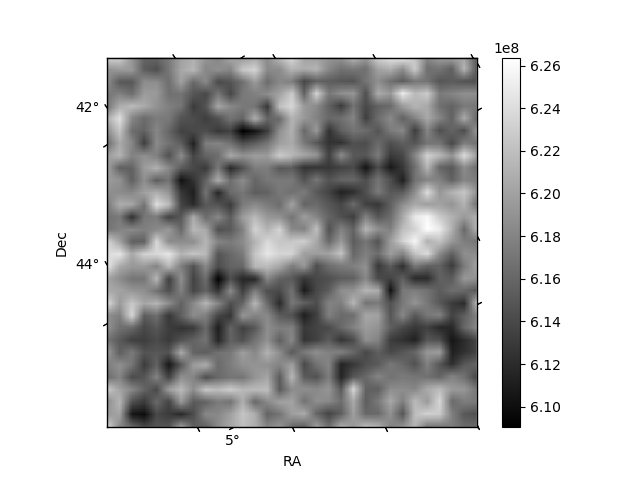
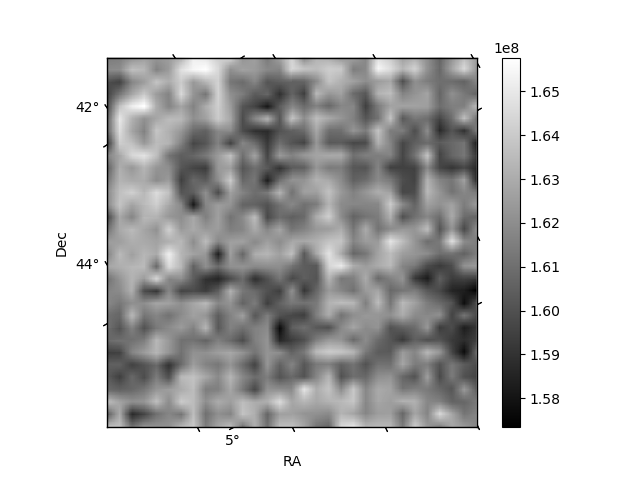
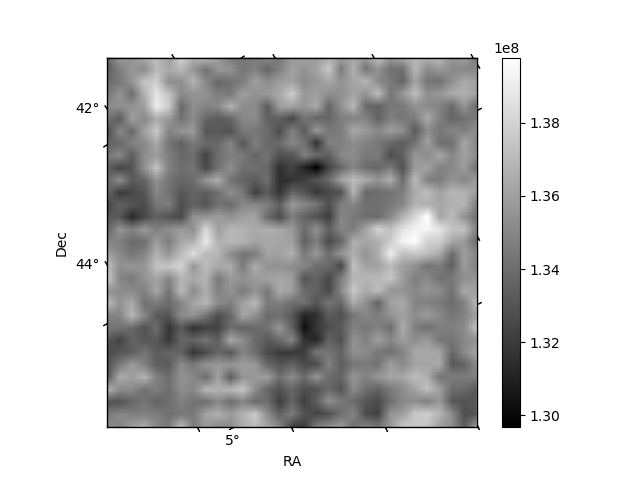
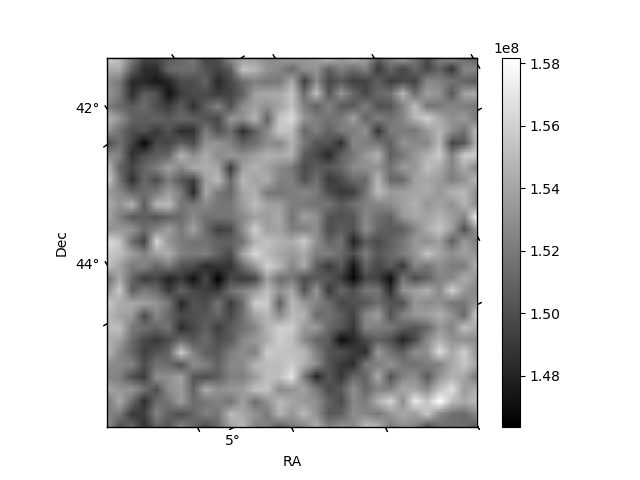
Histogram calculated using DETX and DETY for each event in the final _common_clean file
| Quadrant A | 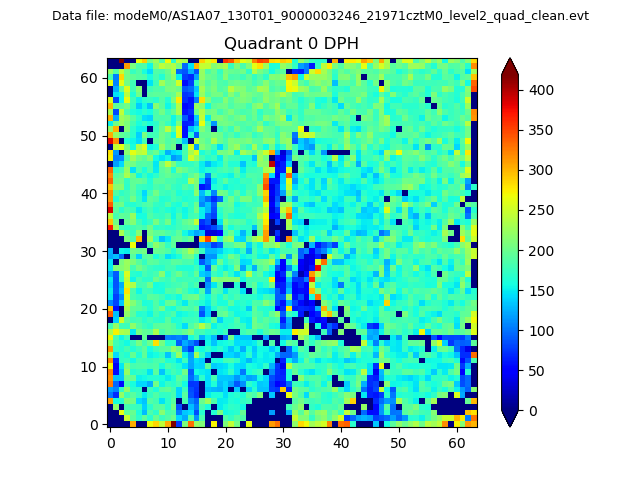 |
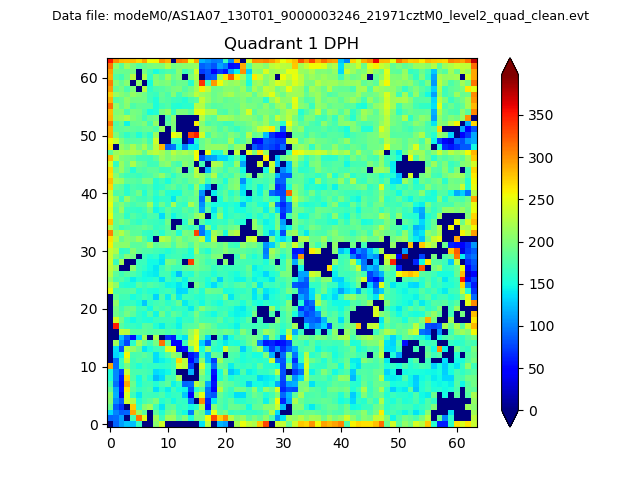 |
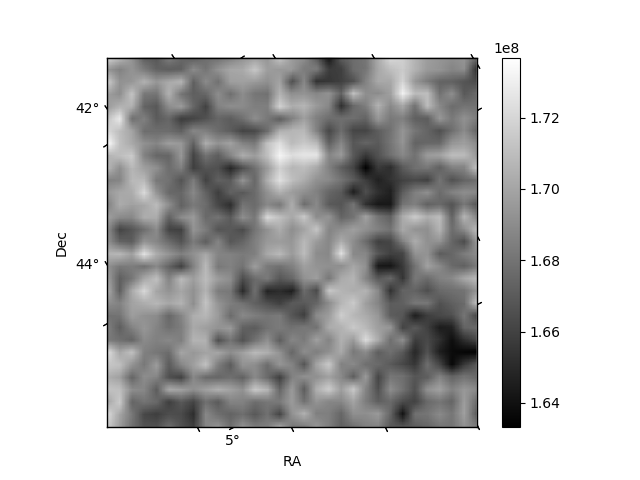
Quadrant B |
|---|---|---|---|
| Quadrant D | 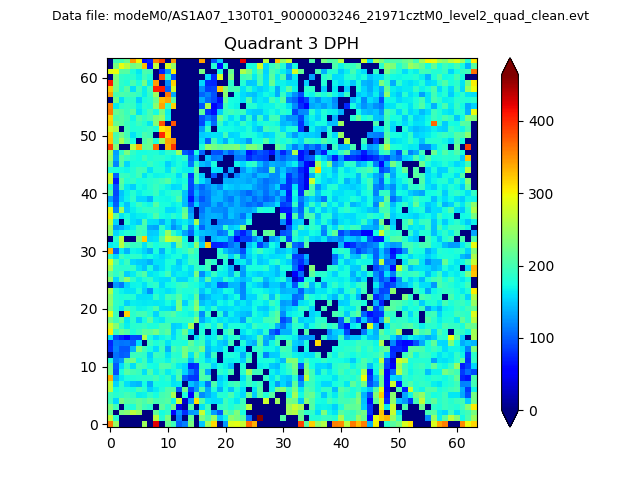 |
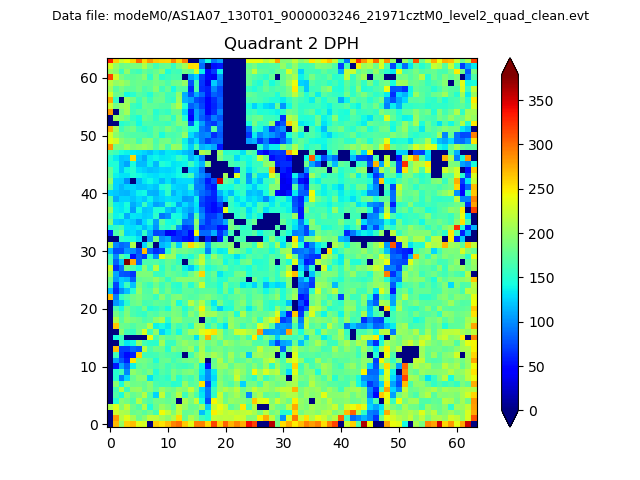 |
Quadrant C |
| Plot type | Count rate plots | Images |
|---|---|---|
| Comparison with Poisson distribution Blue bars denote a histogram of data divided into 1 sec bins. Red curve is a Poisson curve with rate = median count rate of data. |
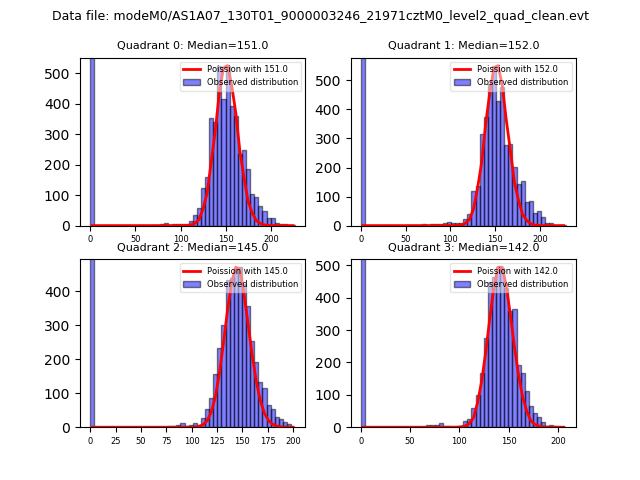 |
 |
| Quadrant-wise count rates Data is divided into 100 sec bins |
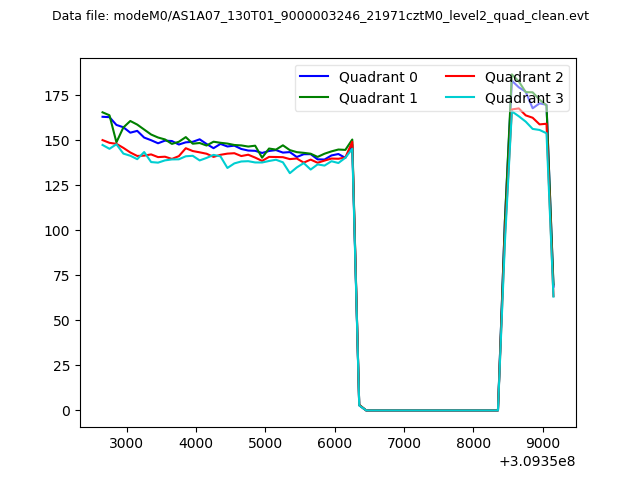 |
|
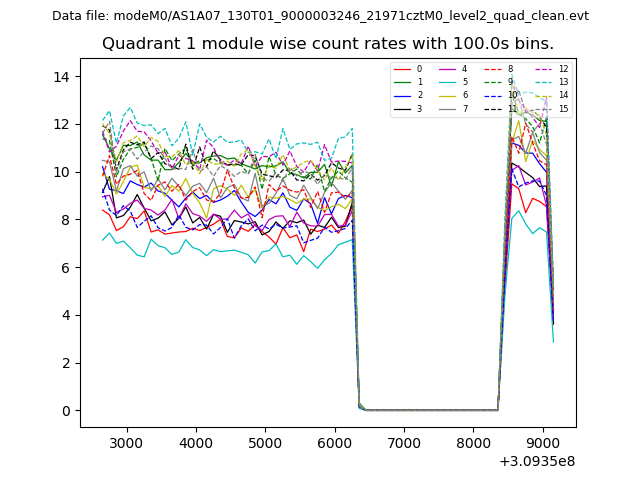
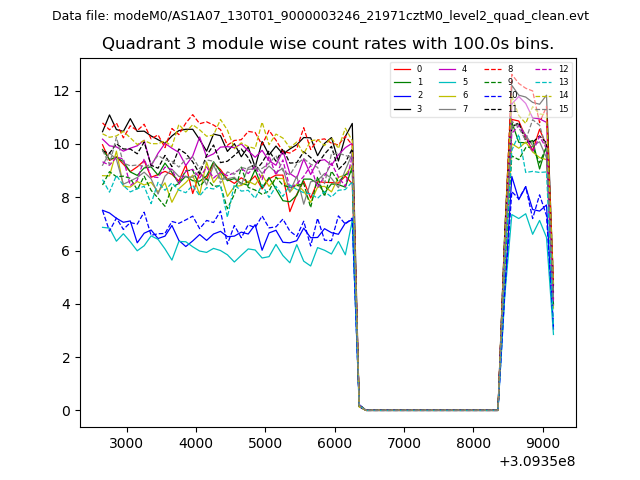
| Module-wise count rates for Quadrant A Data is divided into 100 sec bins |
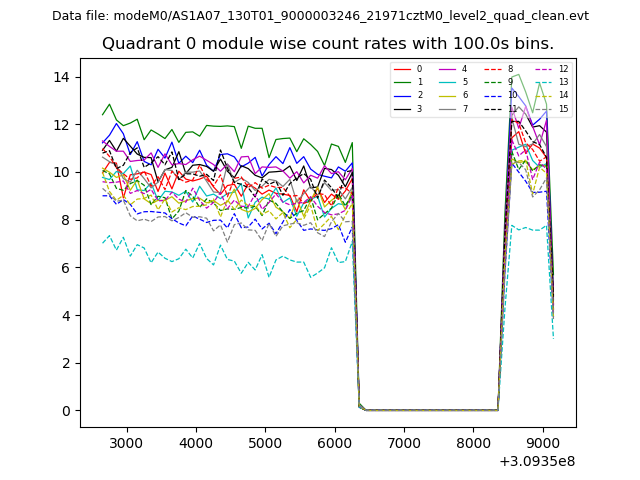 |
 |
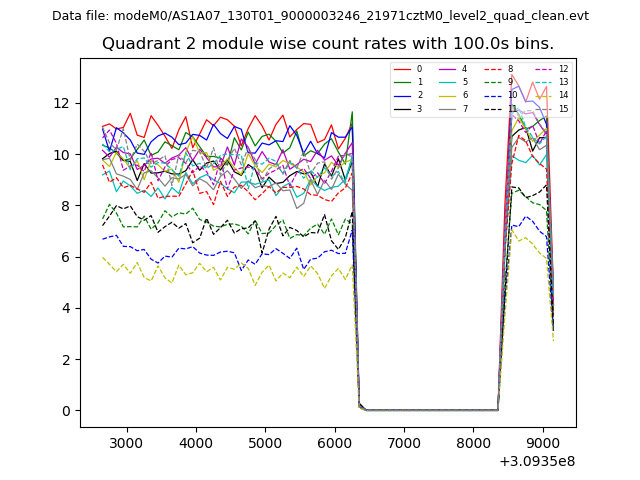
| Module-wise count rates for Quadrant B Data is divided into 100 sec bins |
 |
 |
| Module-wise count rates for Quadrant C Data is divided into 100 sec bins |
 |
 |
| Module-wise count rates for Quadrant D Data is divided into 100 sec bins |
 |
 |
| Parameter | Plot |
|---|---|
| CZT HV Monitor | 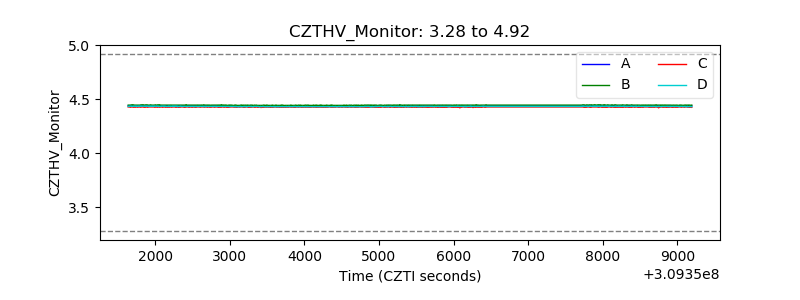 |
| D_VDD | 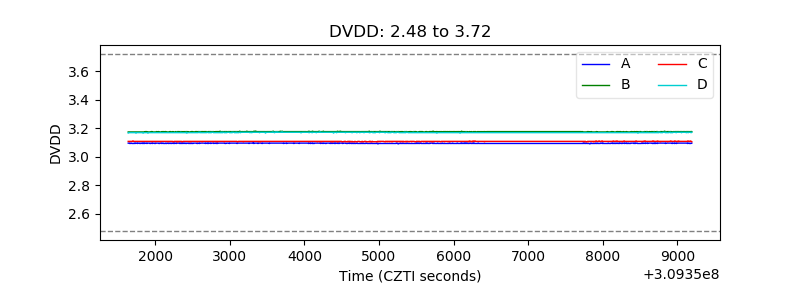 |
| Temperature 1 | 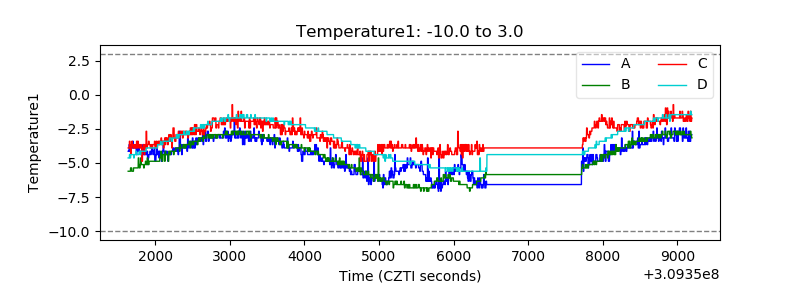 |
| Veto HV Monitor | 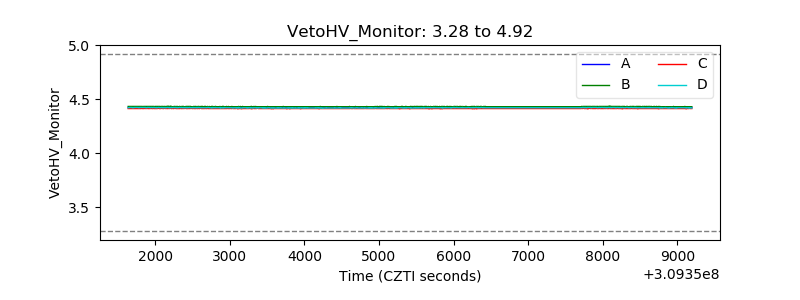 |
| Veto LLD | 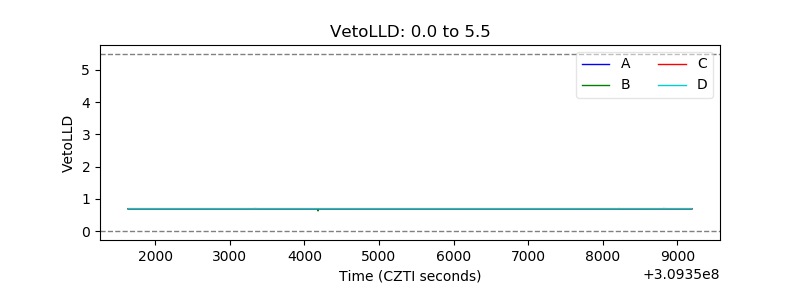 |
| Alpha Counter | 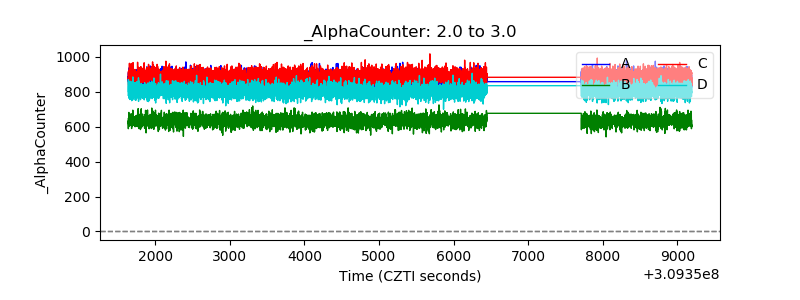 |
| _CPM_Rate | 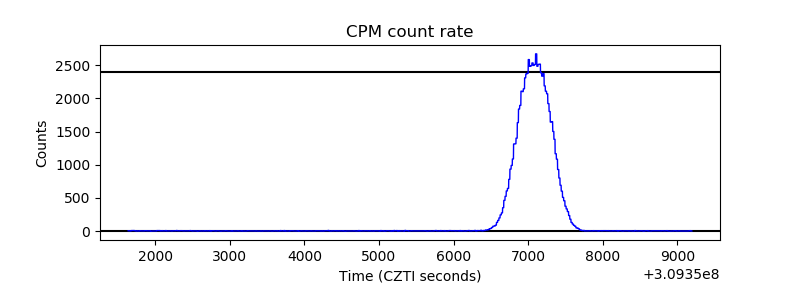 |
| CZT Counter | 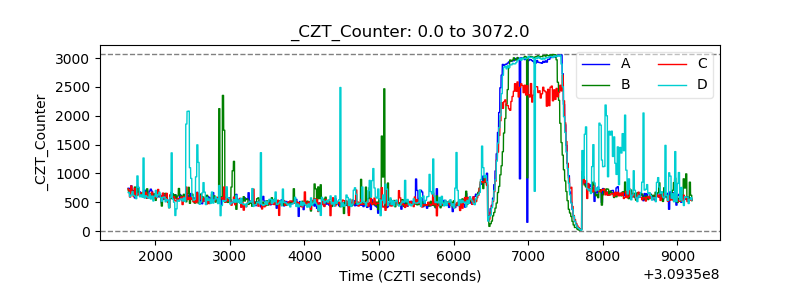 |
| +2.5 Volts monitor |  |
| +5 Volts monitor |  |
| _ROLL_ROT | 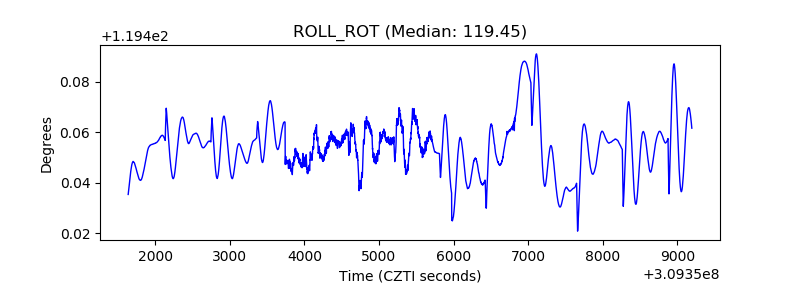 |
| _Roll_DEC | 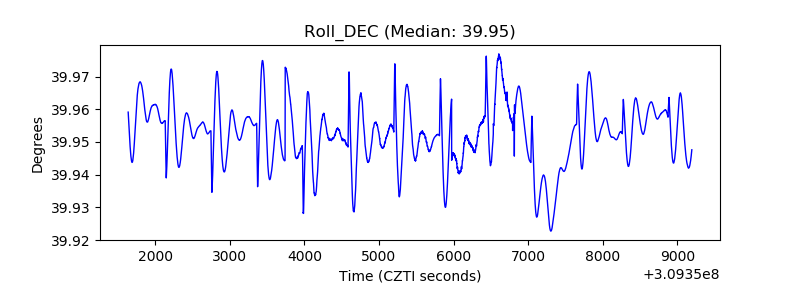 |
| _Roll_RA | 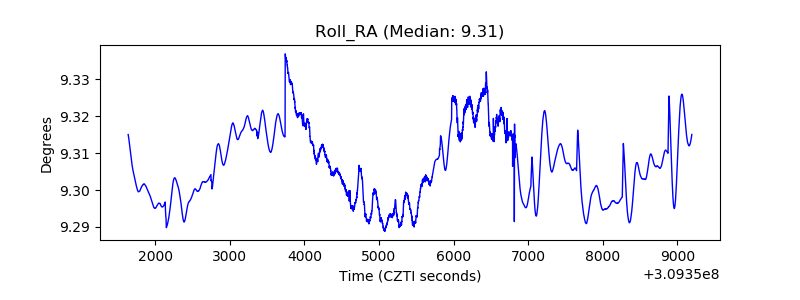 |
| Veto Counter | 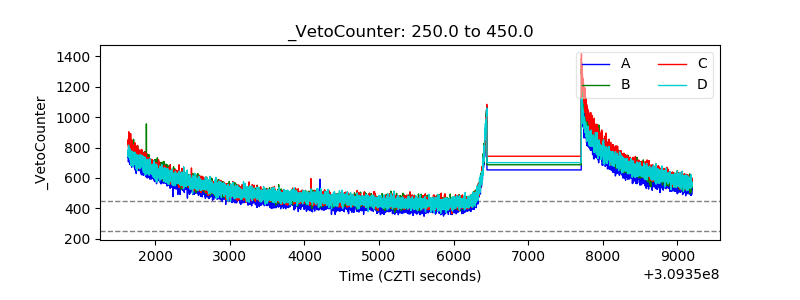 |