| Param | Original file | Final file |
|---|---|---|
| Filename | modeM0/AS1A07_094T01_9000003248_21973cztM0_level2.evt | modeM0/AS1A07_094T01_9000003248_21973cztM0_level2_quad_clean.evt |
| Size (bytes) | 518,901,120 | 122,428,800 |
| Size | 494.9 MB | 116.8 MB |
| Events in quadrant A | 3,678,730 | 839,188 |
| Events in quadrant B | 4,015,610 | 836,202 |
| Events in quadrant C | 3,596,787 | 787,662 |
| Events in quadrant D | 3,973,965 | 782,986 |
| Mode SS | |||
|---|---|---|---|
| Quadrant | BADHDUFLAG | Total packets | Discarded packets |
| A | 0 | 136 | 0 |
| B | 0 | 136 | 0 |
| C | 0 | 136 | 0 |
| D | 0 | 136 | 0 |
| Mode M0 | |||
|---|---|---|---|
| Quadrant | BADHDUFLAG | Total packets | Discarded packets |
| A | 0 | 15149 | 2 |
| B | 0 | 16334 | 2 |
| C | 0 | 14757 | 2 |
| D | 0 | 15991 | 2 |
| Mode M9 | |||
|---|---|---|---|
| Quadrant | BADHDUFLAG | Total packets | Discarded packets |
| A | 0 | 27 | 0 |
| B | 0 | 27 | 0 |
| C | 0 | 27 | 0 |
| D | 0 | 27 | 0 |
| Quadrant | Total seconds | Saturated seconds | Saturation percentage |
|---|---|---|---|
| A | 6630 | 179 | 2.699849% |
| B | 6631 | 231 | 3.483637% |
| C | 6631 | 222 | 3.347911% |
| D | 6631 | 176 | 2.654200% |
Noise dominated data is calculated using 1-second bins in cleaned event files. If a bin has >2000 counts, and if more than 50% of those come from <1% of pixels, then it is considered to be noise-dominated and hence unusable.
| Quadrant | # 1 sec bins | Bins with >0 counts | Bins with >2000 counts | High rate bins dominated by noise | Noise dominated (total time) | Noise dominated (detector-on time) | Marked lightcurve |
|---|---|---|---|---|---|---|---|
| A | 9310 | 6630 | 0 | 0 | 0.00% | 0.00% | 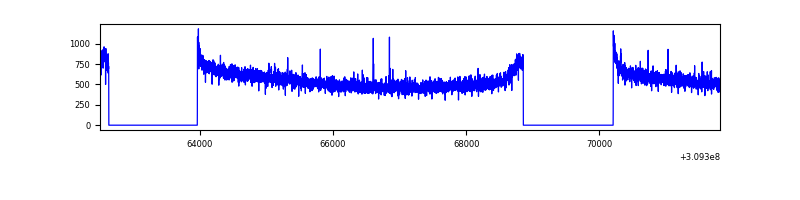 |
| B | 9311 | 6631 | 20 | 20 | 0.21% | 0.30% | 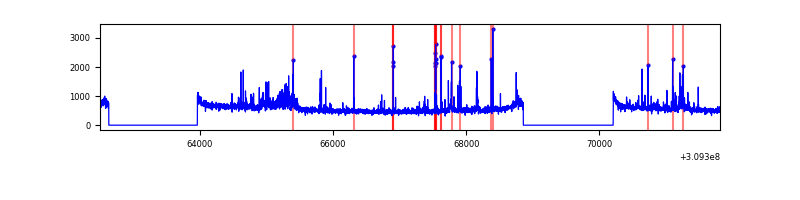 |
| C | 9311 | 6631 | 0 | 0 | 0.00% | 0.00% |  |
| D | 9311 | 6632 | 31 | 31 | 0.33% | 0.47% | 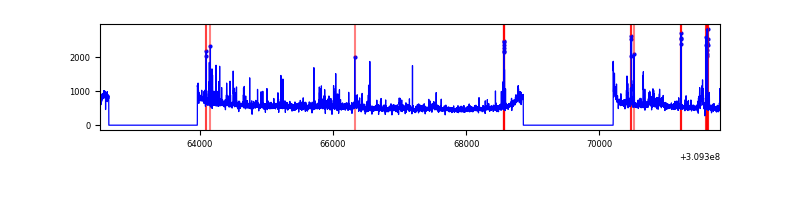 |
Top three noisy pixels from each quadrant. If the there are fewer than three noisy pixels in the level2.evt file, extra rows are filled as -1
| Pixel properties | Quadrant properties | ||||||
|---|---|---|---|---|---|---|---|
| Quadrant | DetID | PixID | Counts | Sigma | Mean | Median | Sigma |
| A | 13 | 254 | 11353 | 55.57 | 951 | 935 | 187.5 |
| A | 0 | 226 | 8384 | 39.73 | 951 | 935 | 187.5 |
| A | 3 | 137 | 7348 | 34.21 | 951 | 935 | 187.5 |
| B | 0 | 230 | 149434 | 858.64 | 924 | 904 | 173.0 |
| B | 3 | 64 | 122148 | 700.9 | 924 | 904 | 173.0 |
| B | 0 | 197 | 63116 | 359.64 | 924 | 904 | 173.0 |
| C | 14 | 238 | 143125 | 697.67 | 885 | 891 | 203.9 |
| C | 13 | 61 | 6220 | 26.14 | 885 | 891 | 203.9 |
| C | 0 | 10 | 2686 | 8.8 | 885 | 891 | 203.9 |
| D | 1 | 52 | 161202 | 728.93 | 919 | 895 | 219.9 |
| D | 13 | 172 | 89546 | 403.11 | 919 | 895 | 219.9 |
| D | 2 | 136 | 77377 | 347.77 | 919 | 895 | 219.9 |
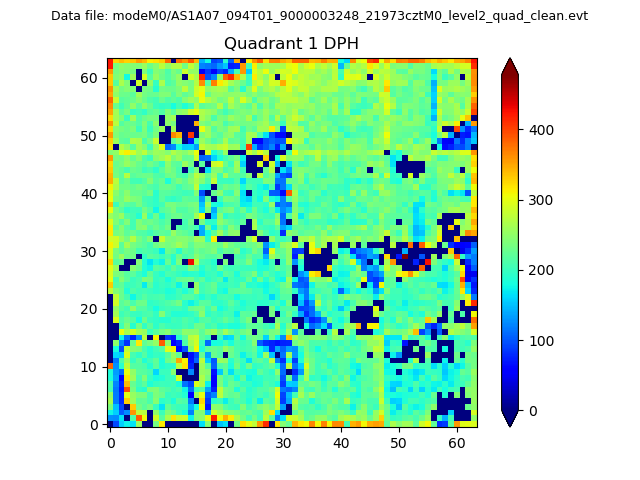
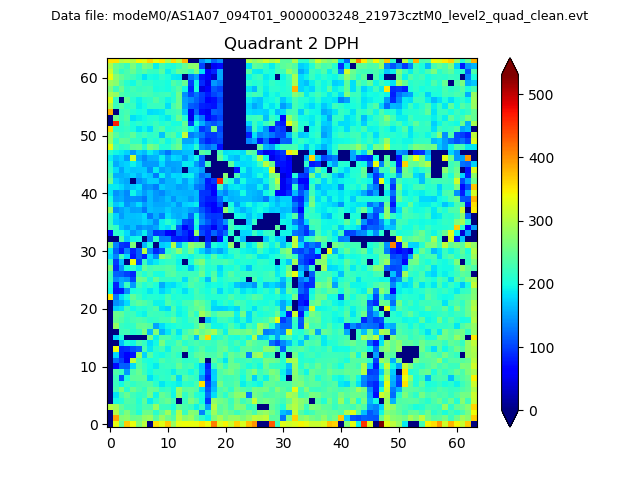
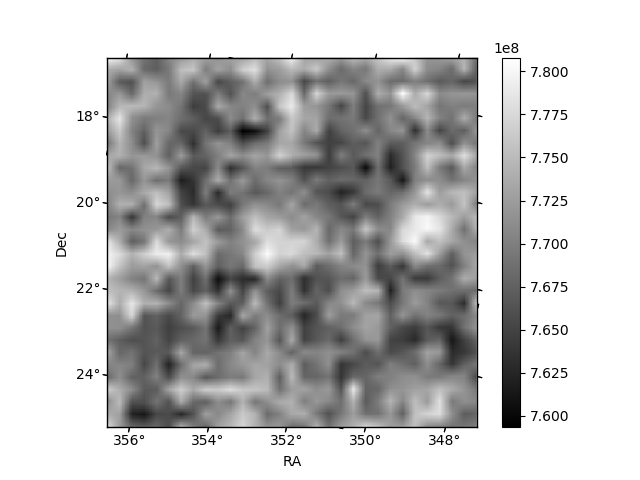
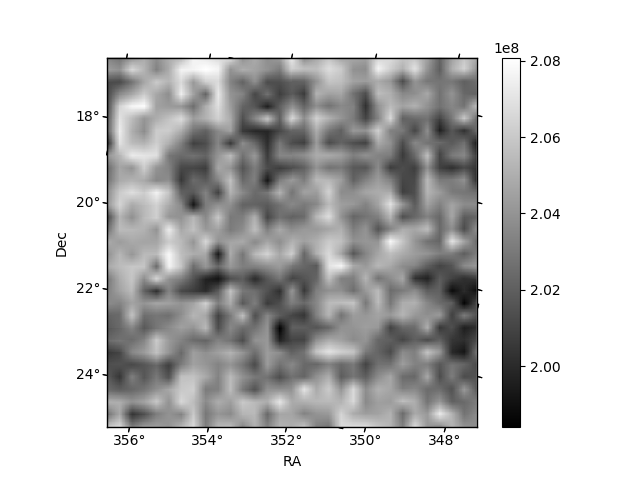
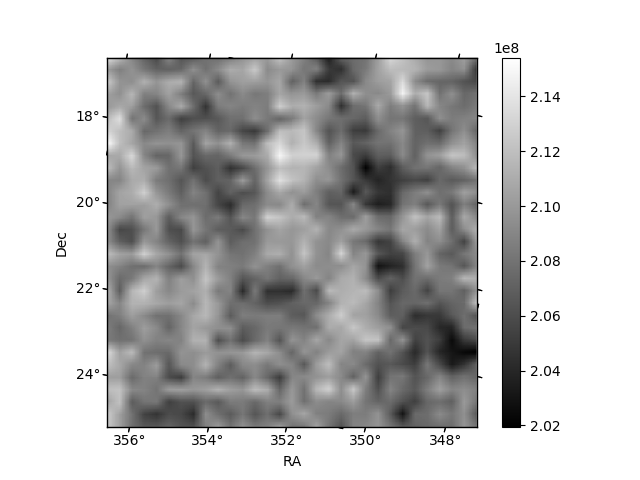
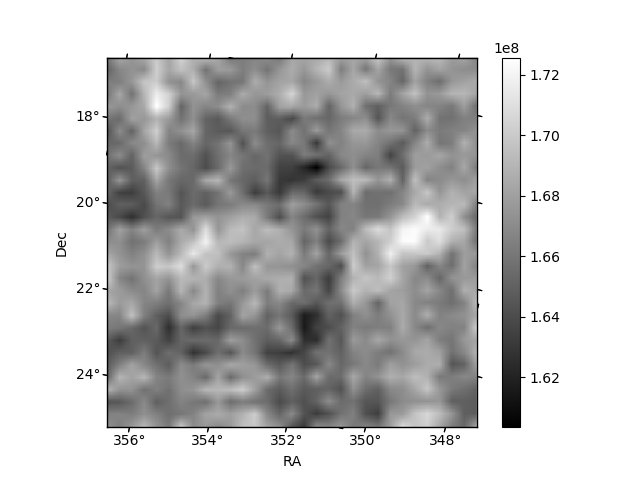
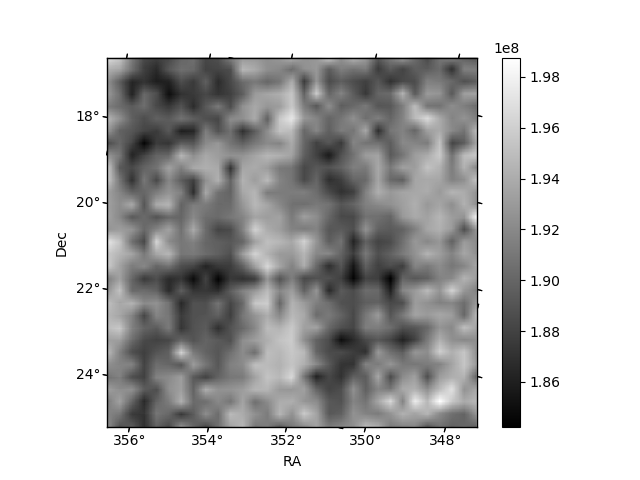
Histogram calculated using DETX and DETY for each event in the final _common_clean file
| Quadrant A | 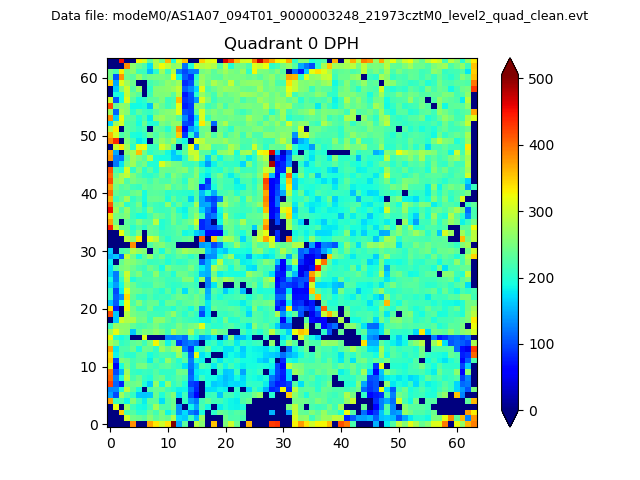 |
 |
Quadrant B |
|---|---|---|---|
| Quadrant D | 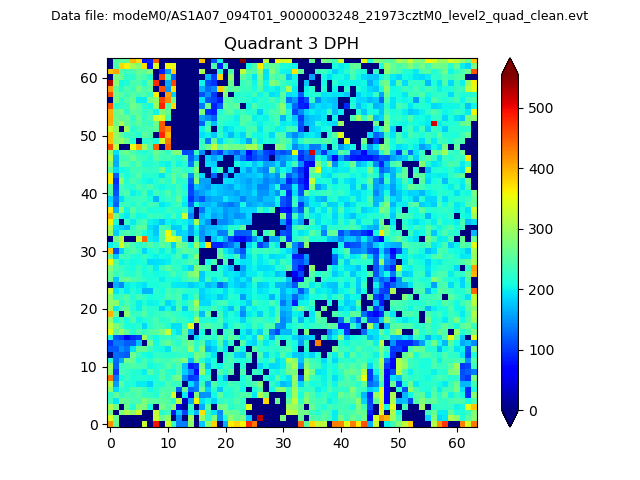 |
 |
Quadrant C |
| Plot type | Count rate plots | Images |
|---|---|---|
| Comparison with Poisson distribution Blue bars denote a histogram of data divided into 1 sec bins. Red curve is a Poisson curve with rate = median count rate of data. |
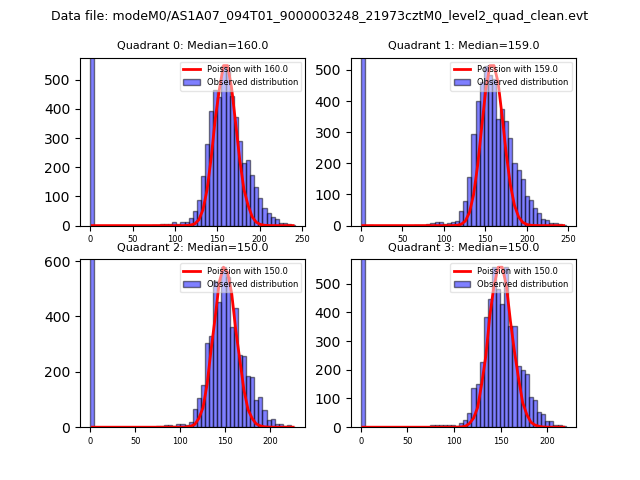 |
 |
| Quadrant-wise count rates Data is divided into 100 sec bins |
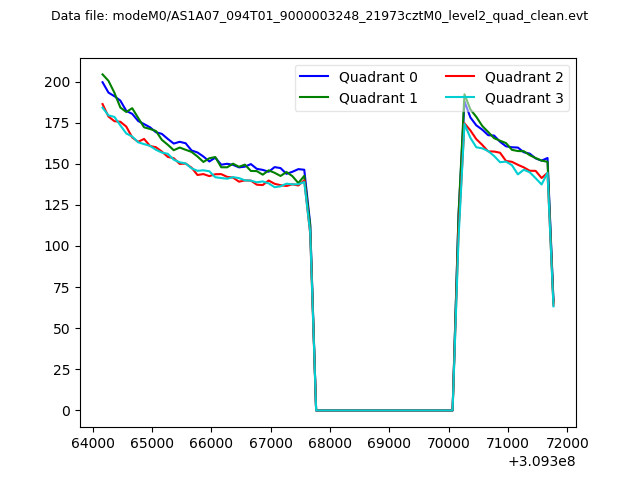 |
|
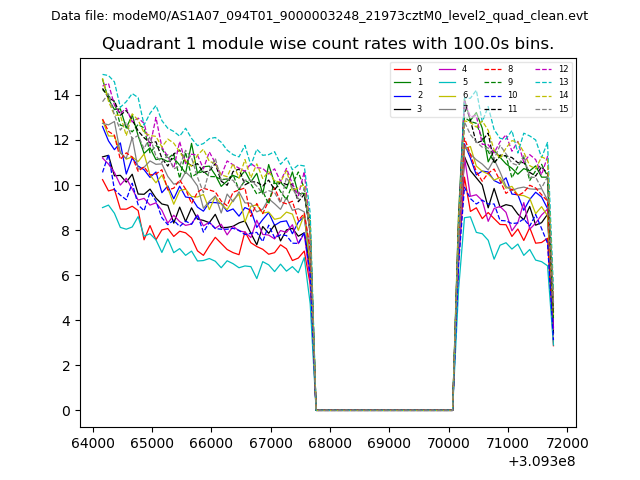
| Module-wise count rates for Quadrant A Data is divided into 100 sec bins |
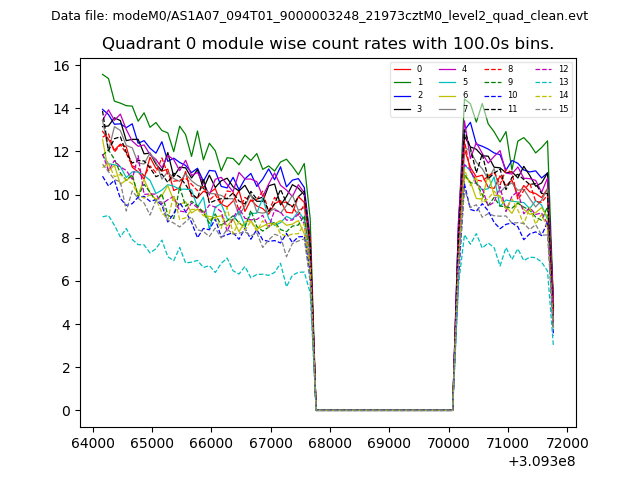 |
 |
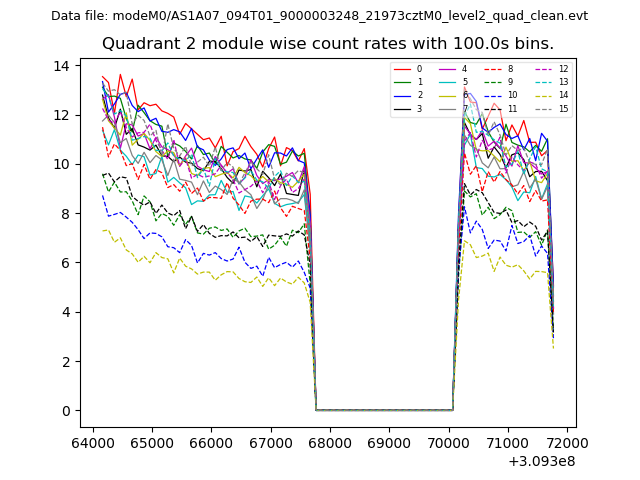
| Module-wise count rates for Quadrant B Data is divided into 100 sec bins |
 |
 |
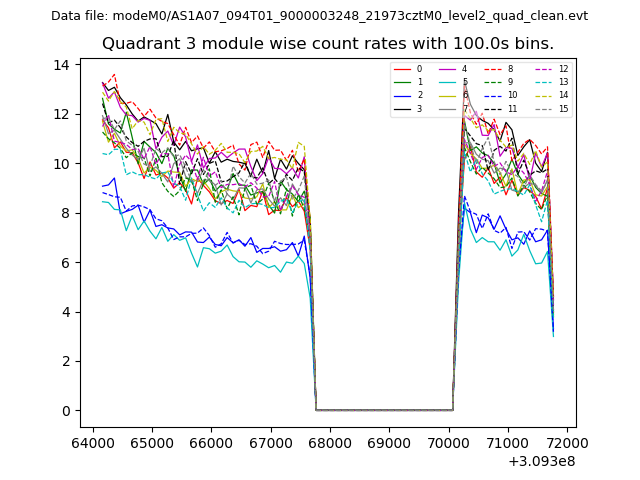
| Module-wise count rates for Quadrant C Data is divided into 100 sec bins |
 |
 |
| Module-wise count rates for Quadrant D Data is divided into 100 sec bins |
 |
 |
| Parameter | Plot |
|---|---|
| CZT HV Monitor | 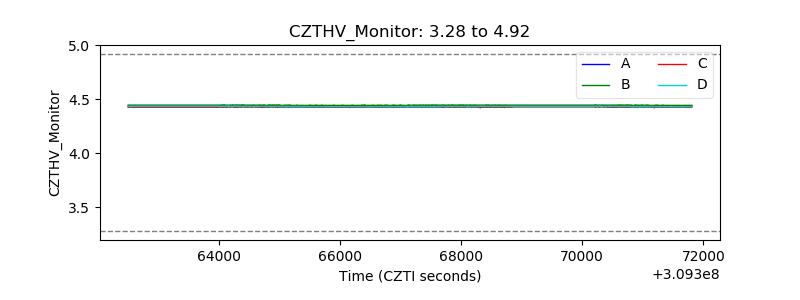 |
| D_VDD | 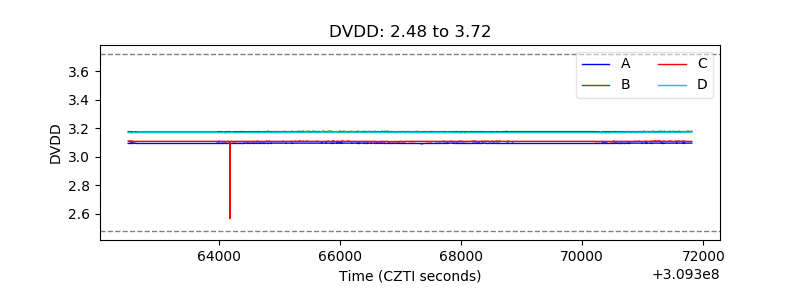 |
| Temperature 1 | 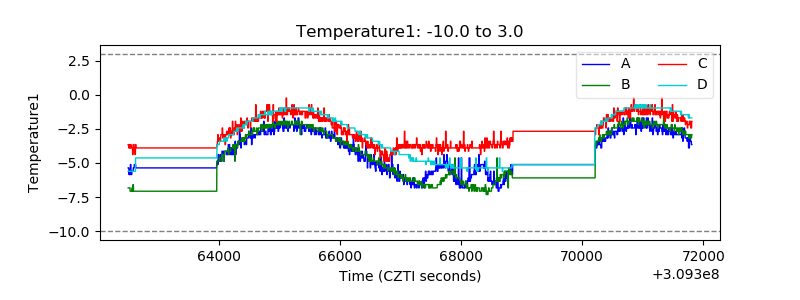 |
| Veto HV Monitor | 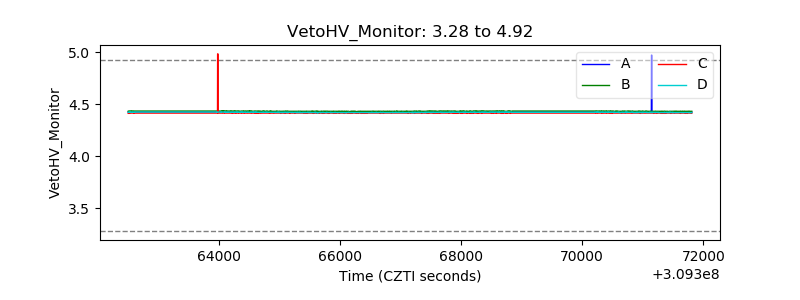 |
| Veto LLD | 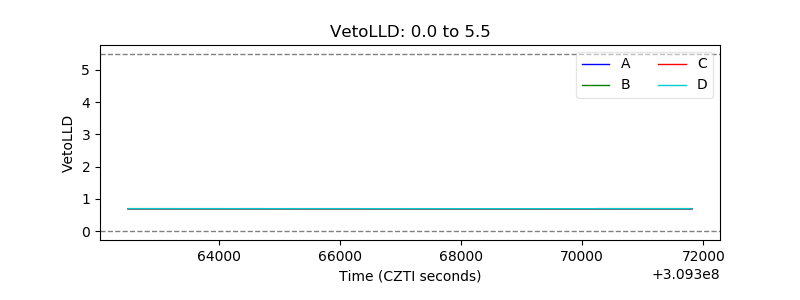 |
| Alpha Counter | 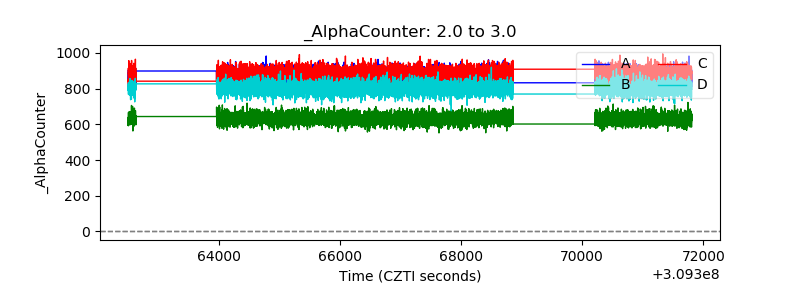 |
| _CPM_Rate | 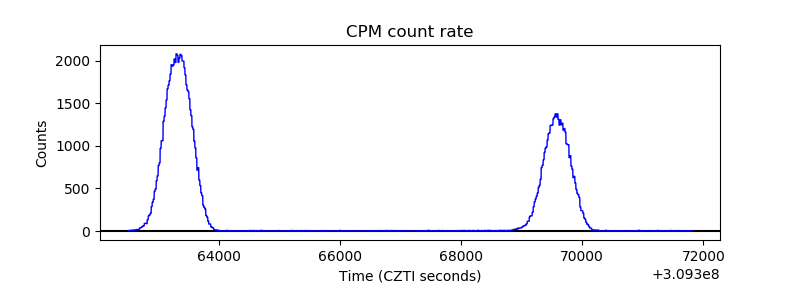 |
| CZT Counter | 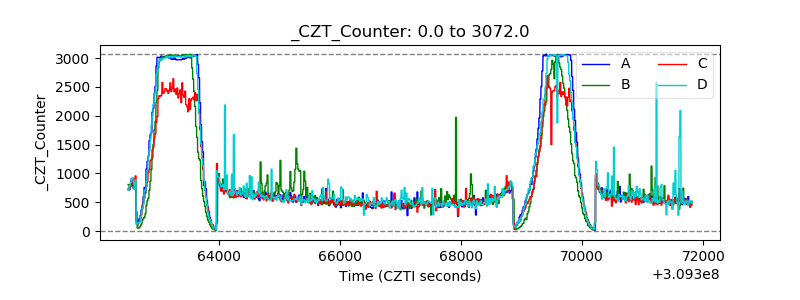 |
| +2.5 Volts monitor |  |
| +5 Volts monitor | 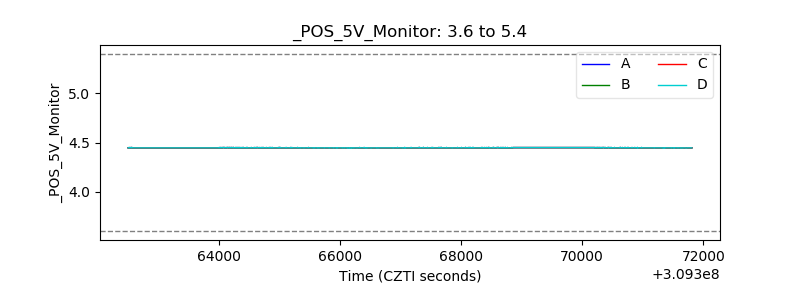 |
| _ROLL_ROT | 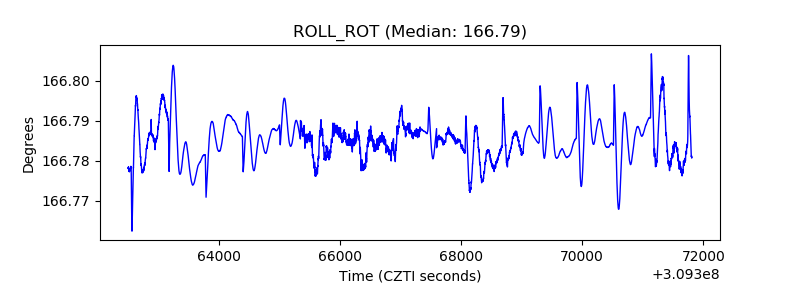 |
| _Roll_DEC | 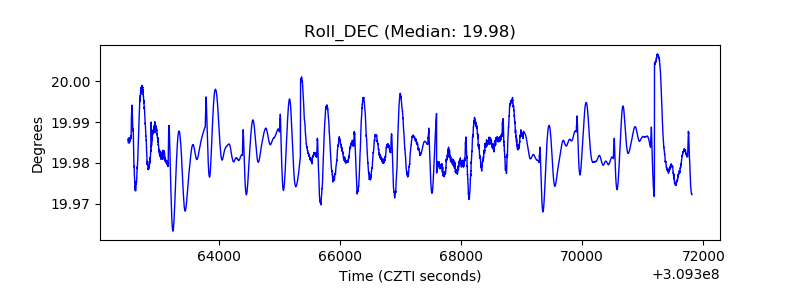 |
| _Roll_RA | 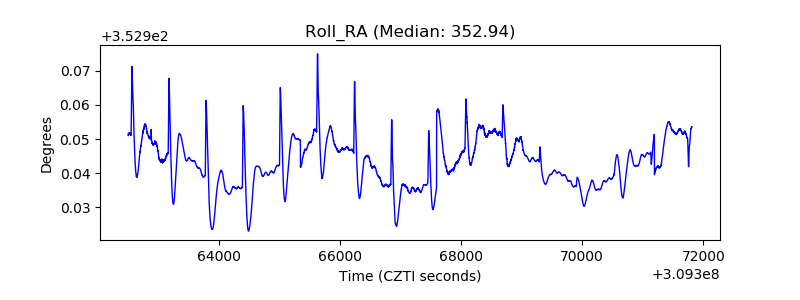 |
| Veto Counter | 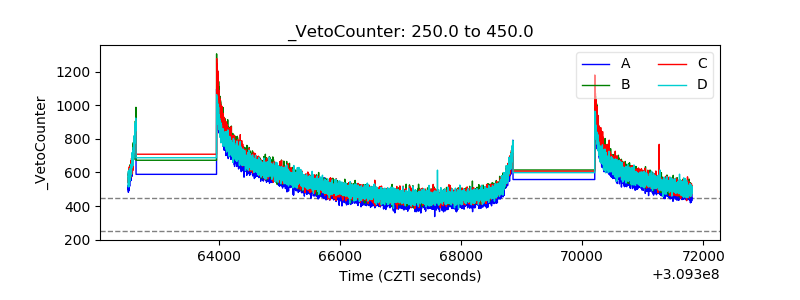 |