| Param | Original file | Final file |
|---|---|---|
| Filename | modeM0/AS1A07_094T01_9000003248_21974cztM0_level2.evt | modeM0/AS1A07_094T01_9000003248_21974cztM0_level2_quad_clean.evt |
| Size (bytes) | 520,853,760 | 102,888,000 |
| Size | 496.7 MB | 98.1 MB |
| Events in quadrant A | 3,280,937 | 698,856 |
| Events in quadrant B | 3,505,635 | 697,292 |
| Events in quadrant C | 3,241,310 | 662,961 |
| Events in quadrant D | 5,315,400 | 613,717 |
| Mode SS | |||
|---|---|---|---|
| Quadrant | BADHDUFLAG | Total packets | Discarded packets |
| A | 0 | 130 | 0 |
| B | 0 | 130 | 0 |
| C | 0 | 130 | 0 |
| D | 0 | 130 | 0 |
| Mode M0 | |||
|---|---|---|---|
| Quadrant | BADHDUFLAG | Total packets | Discarded packets |
| A | 0 | 13653 | 1 |
| B | 0 | 14370 | 1 |
| C | 0 | 13447 | 1 |
| D | 0 | 20079 | 1 |
| Mode M9 | |||
|---|---|---|---|
| Quadrant | BADHDUFLAG | Total packets | Discarded packets |
| A | 0 | 12 | 0 |
| B | 0 | 12 | 0 |
| C | 0 | 12 | 0 |
| D | 0 | 12 | 0 |
| Quadrant | Total seconds | Saturated seconds | Saturation percentage |
|---|---|---|---|
| A | 6345 | 83 | 1.308117% |
| B | 6346 | 129 | 2.032777% |
| C | 6346 | 116 | 1.827923% |
| D | 6346 | 602 | 9.486291% |
Noise dominated data is calculated using 1-second bins in cleaned event files. If a bin has >2000 counts, and if more than 50% of those come from <1% of pixels, then it is considered to be noise-dominated and hence unusable.
| Quadrant | # 1 sec bins | Bins with >0 counts | Bins with >2000 counts | High rate bins dominated by noise | Noise dominated (total time) | Noise dominated (detector-on time) | Marked lightcurve |
|---|---|---|---|---|---|---|---|
| A | 7540 | 6345 | 0 | 0 | 0.00% | 0.00% | 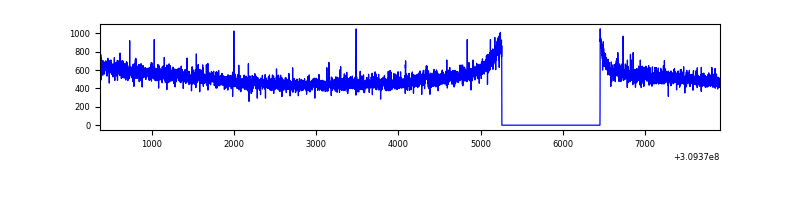 |
| B | 7541 | 6346 | 17 | 17 | 0.23% | 0.27% | 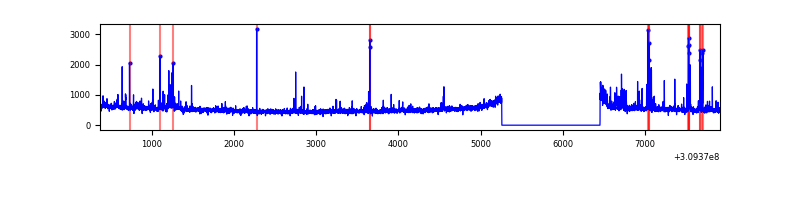 |
| C | 7541 | 6346 | 0 | 0 | 0.00% | 0.00% | 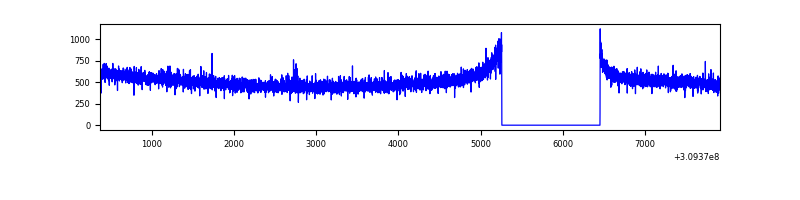 |
| D | 7541 | 6346 | 518 | 518 | 6.87% | 8.16% | 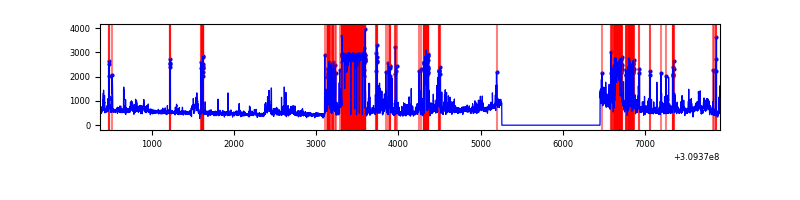 |
Top three noisy pixels from each quadrant. If the there are fewer than three noisy pixels in the level2.evt file, extra rows are filled as -1
| Pixel properties | Quadrant properties | ||||||
|---|---|---|---|---|---|---|---|
| Quadrant | DetID | PixID | Counts | Sigma | Mean | Median | Sigma |
| A | 2 | 79 | 15813 | 88.58 | 846 | 831 | 169.1 |
| A | 13 | 254 | 11016 | 60.22 | 846 | 831 | 169.1 |
| A | 0 | 226 | 7292 | 38.2 | 846 | 831 | 169.1 |
| B | 3 | 64 | 99282 | 626.71 | 829 | 810 | 157.1 |
| B | 0 | 230 | 88114 | 555.64 | 829 | 810 | 157.1 |
| B | 0 | 190 | 41261 | 257.45 | 829 | 810 | 157.1 |
| C | 14 | 238 | 127127 | 682.35 | 798 | 806 | 185.1 |
| C | 13 | 61 | 5562 | 25.69 | 798 | 806 | 185.1 |
| C | 10 | 22 | 3740 | 15.85 | 798 | 806 | 185.1 |
| D | 7 | 238 | 1106843 | 5801.35 | 784 | 761 | 190.7 |
| D | 1 | 52 | 889912 | 4663.56 | 784 | 761 | 190.7 |
| D | 12 | 227 | 178899 | 934.33 | 784 | 761 | 190.7 |
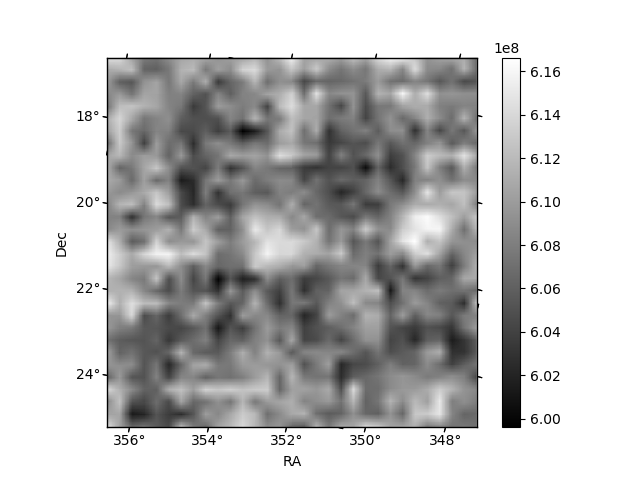
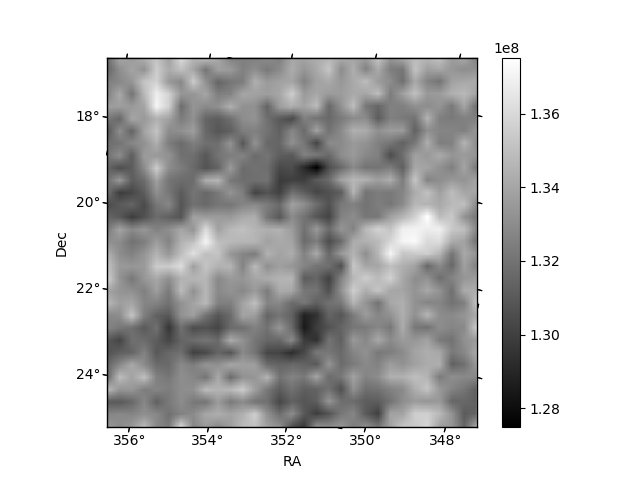
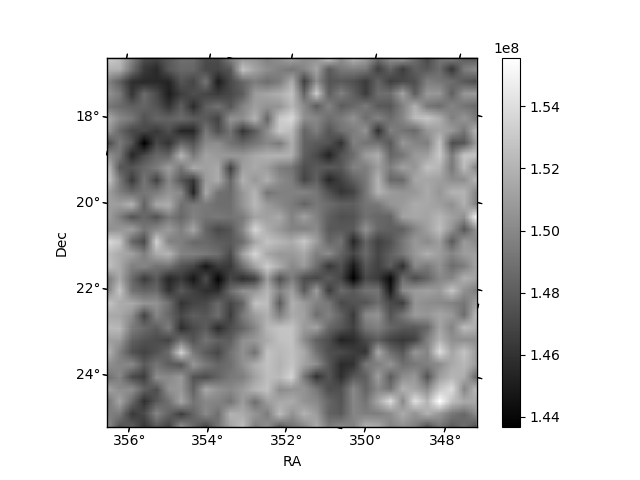
Histogram calculated using DETX and DETY for each event in the final _common_clean file
| Quadrant A | 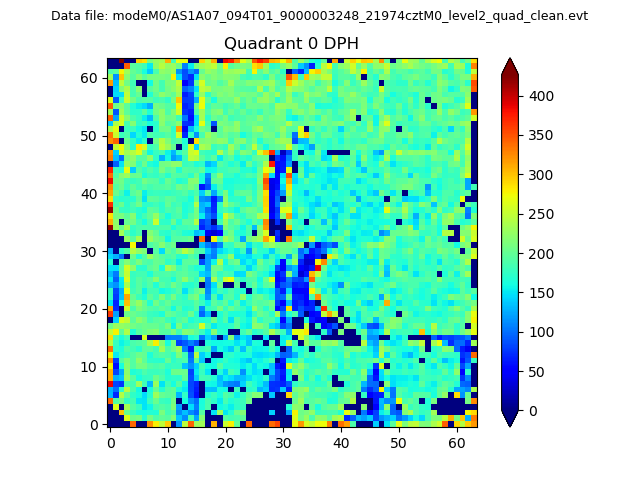 |
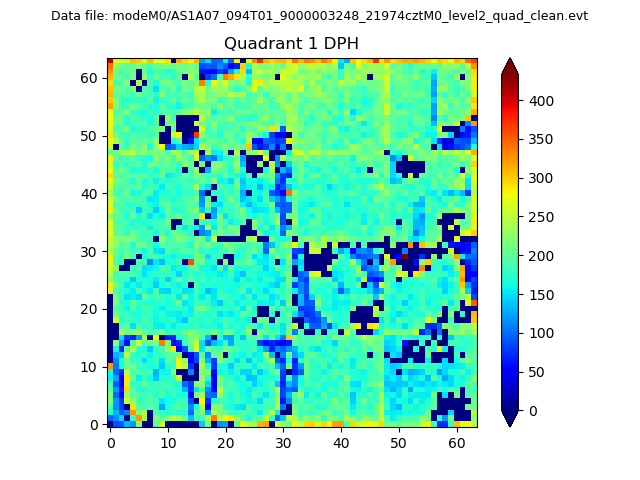 |
Quadrant B |
|---|---|---|---|
| Quadrant D | 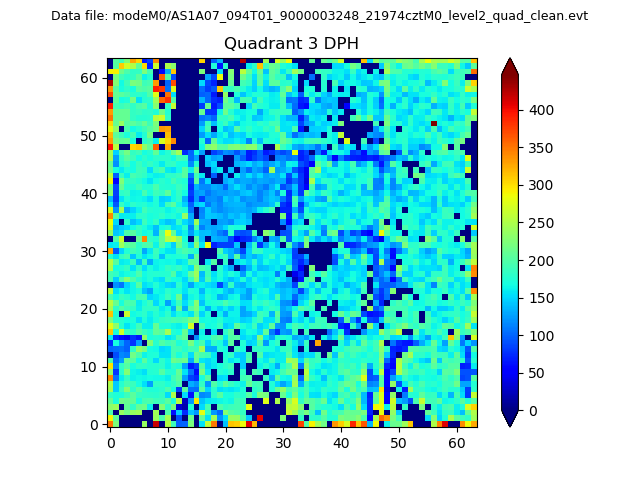 |
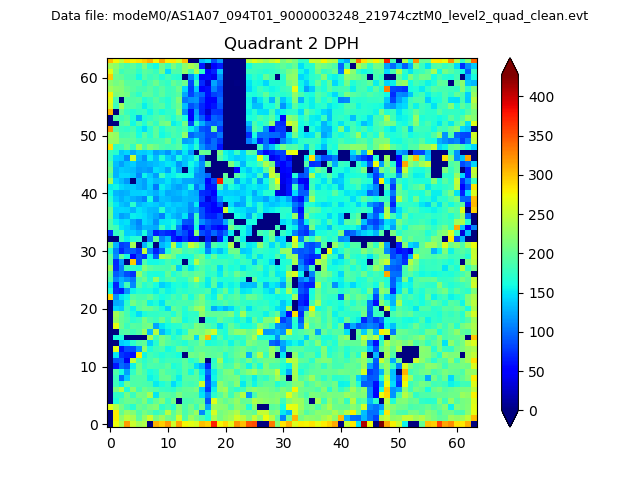 |
Quadrant C |
| Plot type | Count rate plots | Images |
|---|---|---|
| Comparison with Poisson distribution Blue bars denote a histogram of data divided into 1 sec bins. Red curve is a Poisson curve with rate = median count rate of data. |
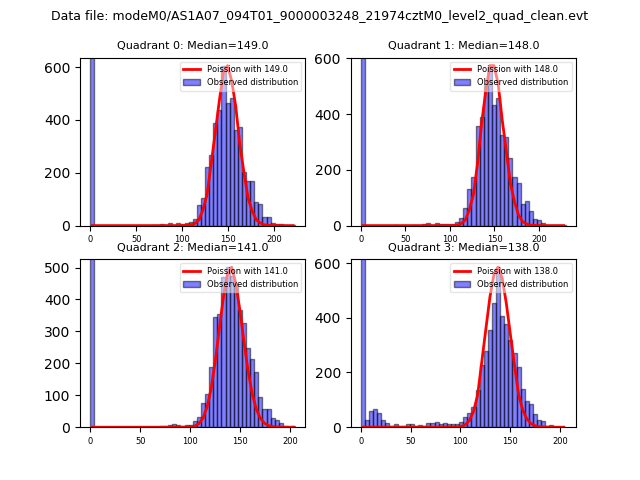 |
 |
| Quadrant-wise count rates Data is divided into 100 sec bins |
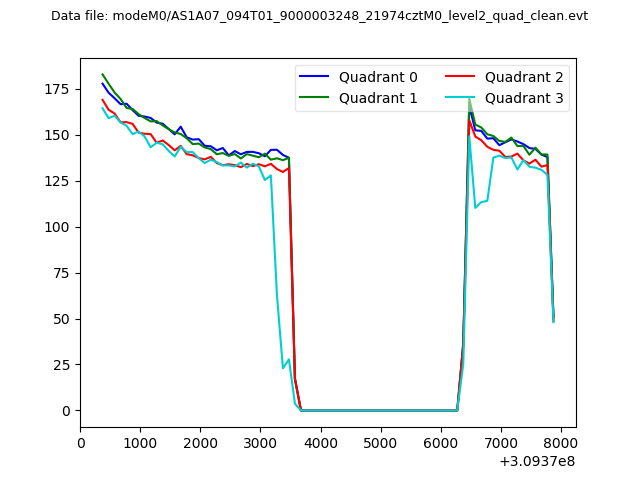 |
|
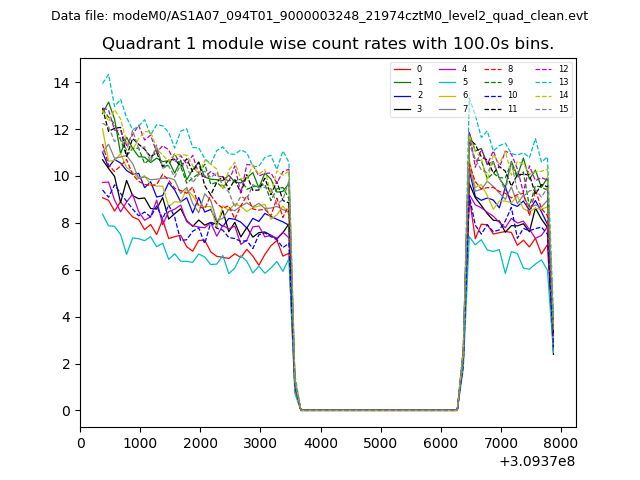
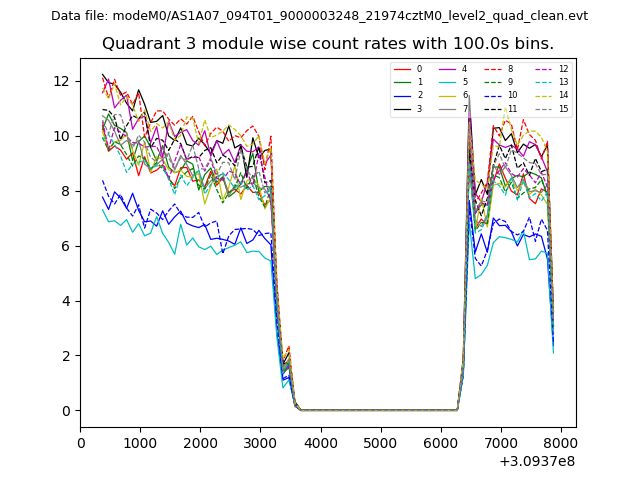
| Module-wise count rates for Quadrant A Data is divided into 100 sec bins |
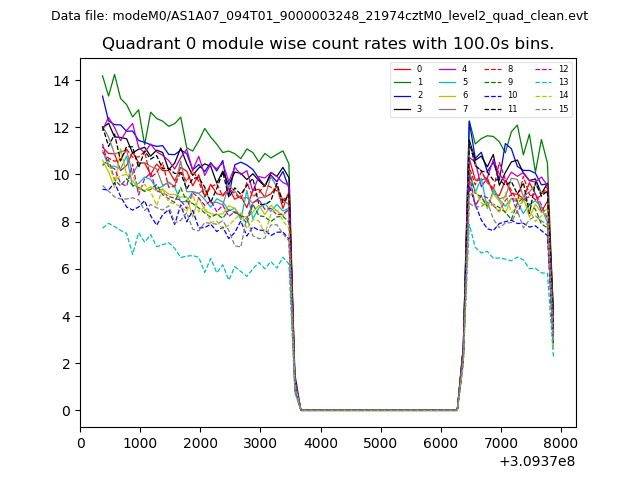 |
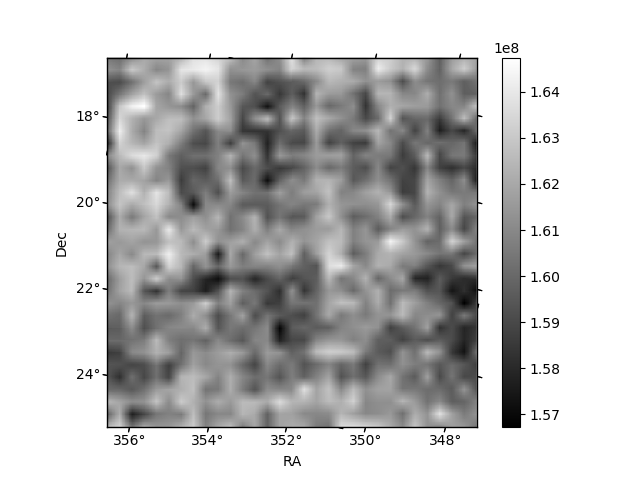 |
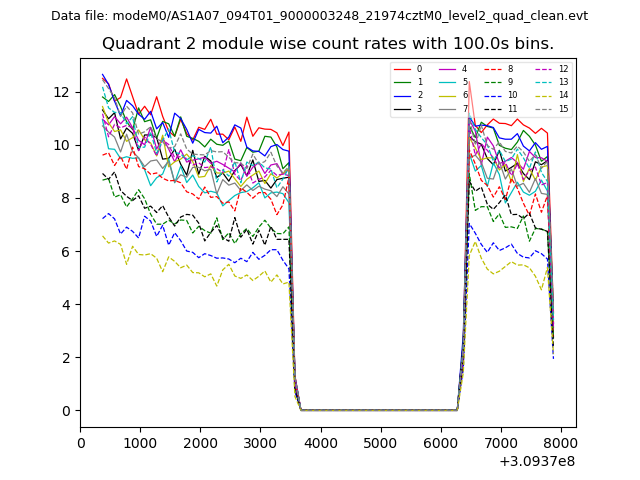
| Module-wise count rates for Quadrant B Data is divided into 100 sec bins |
 |
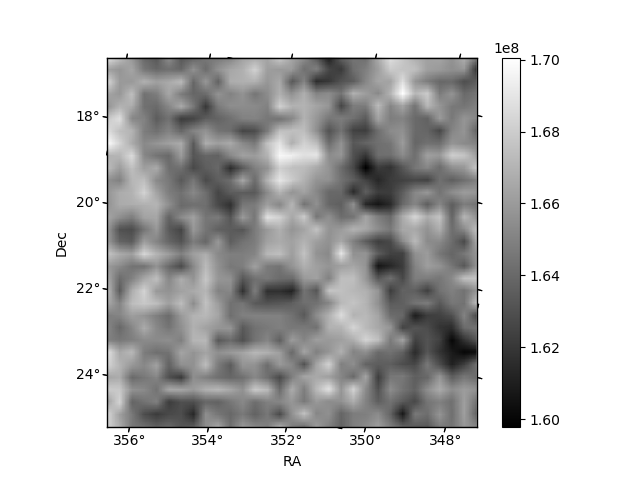 |
| Module-wise count rates for Quadrant C Data is divided into 100 sec bins |
 |
 |
| Module-wise count rates for Quadrant D Data is divided into 100 sec bins |
 |
 |
| Parameter | Plot |
|---|---|
| CZT HV Monitor | 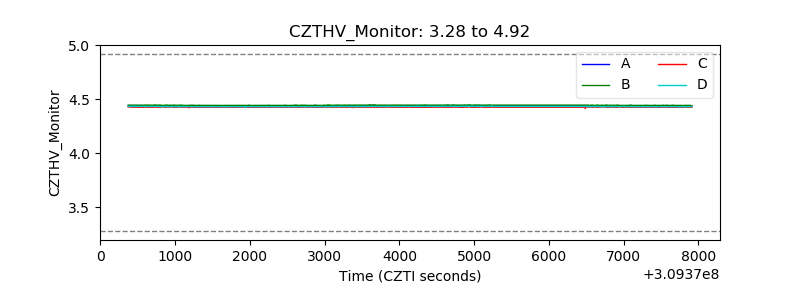 |
| D_VDD | 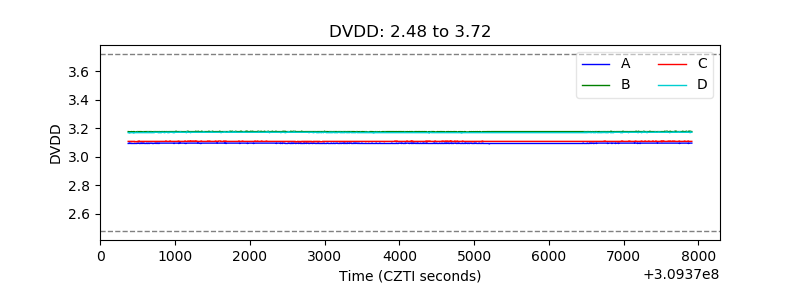 |
| Temperature 1 | 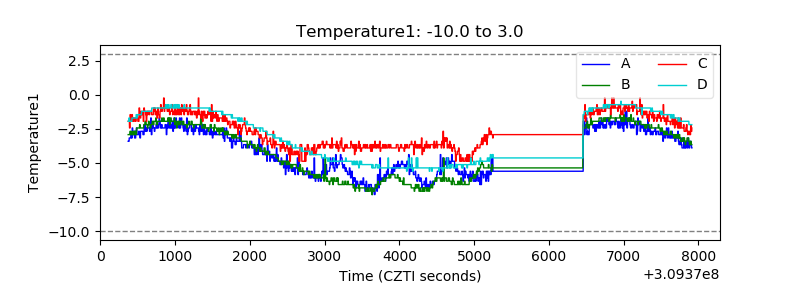 |
| Veto HV Monitor | 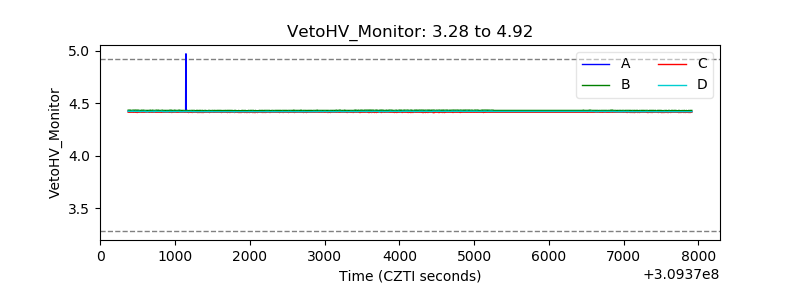 |
| Veto LLD | 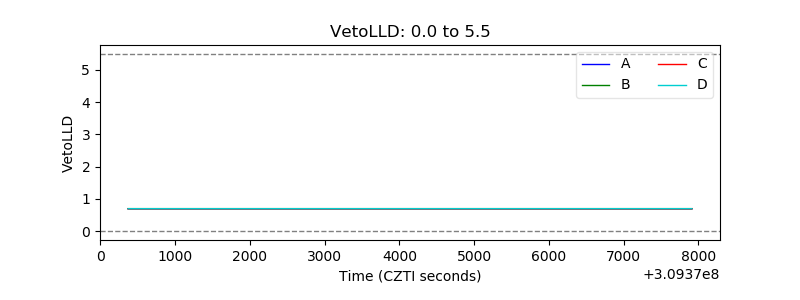 |
| Alpha Counter | 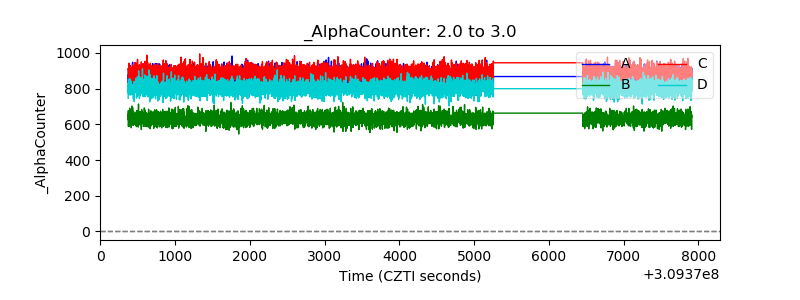 |
| _CPM_Rate | 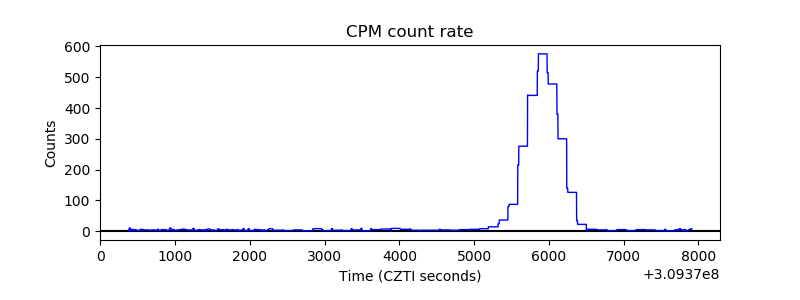 |
| CZT Counter | 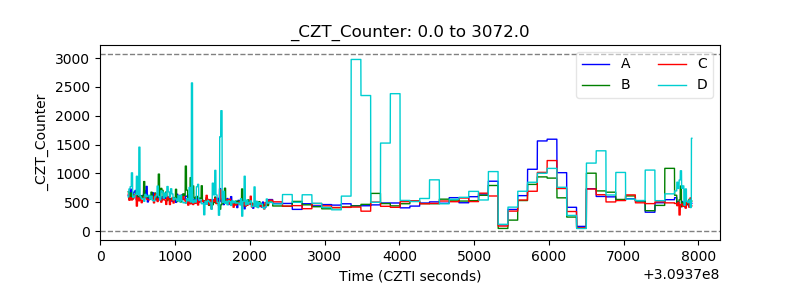 |
| +2.5 Volts monitor | 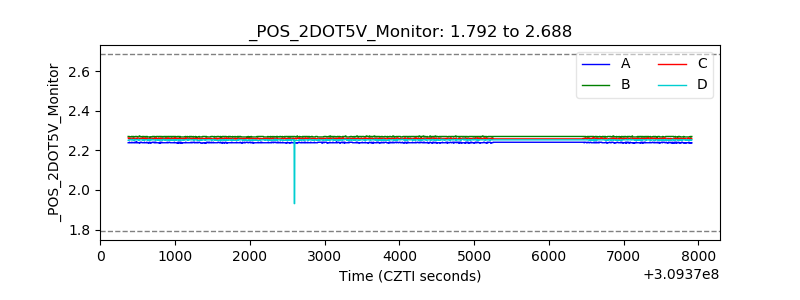 |
| +5 Volts monitor |  |
| _ROLL_ROT | 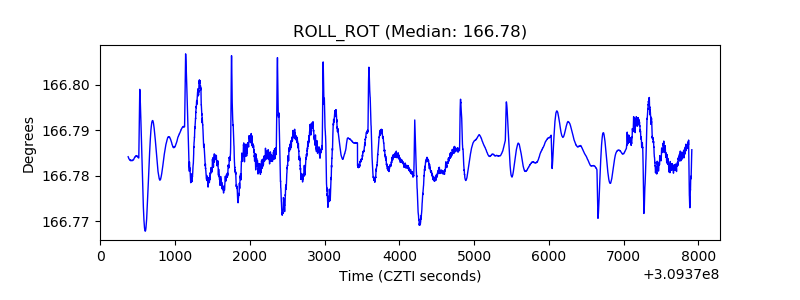 |
| _Roll_DEC | 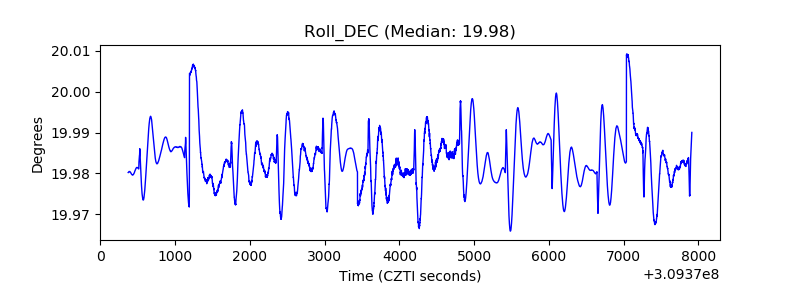 |
| _Roll_RA | 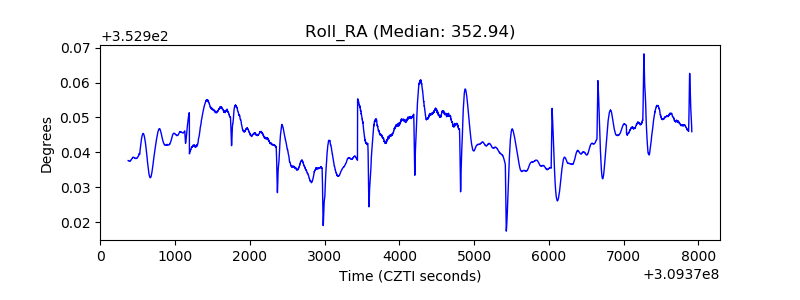 |
| Veto Counter | 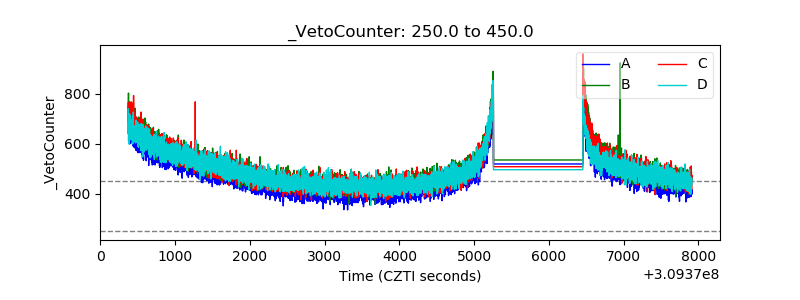 |