| Param | Original file | Final file |
|---|---|---|
| Filename | modeM0/AS1A07_094T01_9000003248_21975cztM0_level2.evt | modeM0/AS1A07_094T01_9000003248_21975cztM0_level2_quad_clean.evt |
| Size (bytes) | 564,857,280 | 95,780,160 |
| Size | 538.7 MB | 91.3 MB |
| Events in quadrant A | 3,387,301 | 630,550 |
| Events in quadrant B | 3,652,531 | 631,353 |
| Events in quadrant C | 3,359,779 | 605,407 |
| Events in quadrant D | 6,245,173 | 558,162 |
| Mode SS | |||
|---|---|---|---|
| Quadrant | BADHDUFLAG | Total packets | Discarded packets |
| A | 0 | 138 | 0 |
| B | 0 | 138 | 0 |
| C | 0 | 138 | 0 |
| D | 0 | 138 | 0 |
| Mode M0 | |||
|---|---|---|---|
| Quadrant | BADHDUFLAG | Total packets | Discarded packets |
| A | 0 | 14331 | 2 |
| B | 0 | 15116 | 2 |
| C | 0 | 14203 | 2 |
| D | 0 | 23299 | 4 |
| Mode M9 | |||
|---|---|---|---|
| Quadrant | BADHDUFLAG | Total packets | Discarded packets |
| A | 0 | 12 | 0 |
| B | 0 | 13 | 0 |
| C | 0 | 13 | 0 |
| D | 0 | 13 | 0 |
| Quadrant | Total seconds | Saturated seconds | Saturation percentage |
|---|---|---|---|
| A | 6816 | 75 | 1.100352% |
| B | 6816 | 129 | 1.892606% |
| C | 6816 | 123 | 1.804577% |
| D | 6815 | 675 | 9.904622% |
Noise dominated data is calculated using 1-second bins in cleaned event files. If a bin has >2000 counts, and if more than 50% of those come from <1% of pixels, then it is considered to be noise-dominated and hence unusable.
| Quadrant | # 1 sec bins | Bins with >0 counts | Bins with >2000 counts | High rate bins dominated by noise | Noise dominated (total time) | Noise dominated (detector-on time) | Marked lightcurve |
|---|---|---|---|---|---|---|---|
| A | 7686 | 6816 | 1 | 1 | 0.01% | 0.01% | 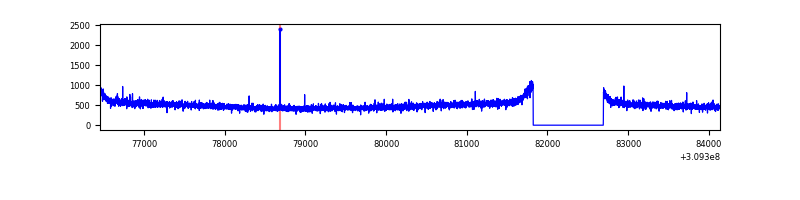 |
| B | 7686 | 6816 | 28 | 28 | 0.36% | 0.41% | 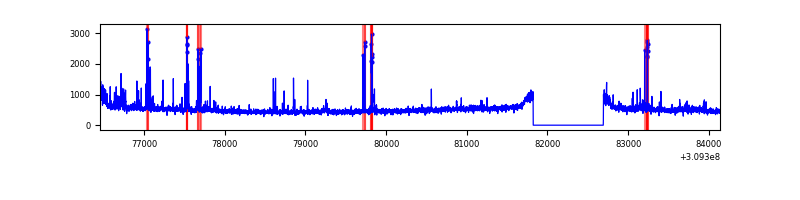 |
| C | 7686 | 6816 | 0 | 0 | 0.00% | 0.00% | 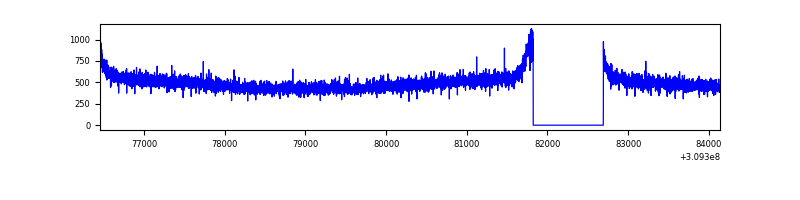 |
| D | 7685 | 6815 | 570 | 570 | 7.42% | 8.36% | 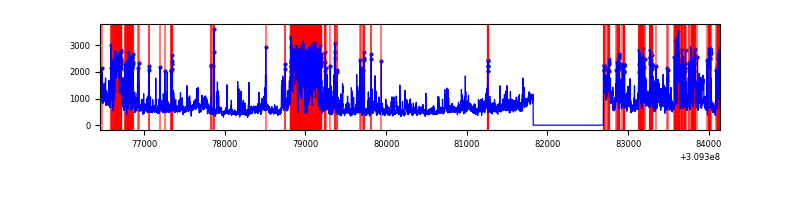 |
Top three noisy pixels from each quadrant. If the there are fewer than three noisy pixels in the level2.evt file, extra rows are filled as -1
| Pixel properties | Quadrant properties | ||||||
|---|---|---|---|---|---|---|---|
| Quadrant | DetID | PixID | Counts | Sigma | Mean | Median | Sigma |
| A | 2 | 79 | 16507 | 88.91 | 872 | 855 | 176.0 |
| A | 13 | 254 | 12660 | 67.06 | 872 | 855 | 176.0 |
| A | 0 | 226 | 7532 | 37.93 | 872 | 855 | 176.0 |
| B | 3 | 64 | 150514 | 909.87 | 860 | 839 | 164.5 |
| B | 0 | 230 | 77687 | 467.16 | 860 | 839 | 164.5 |
| B | 0 | 190 | 28999 | 171.18 | 860 | 839 | 164.5 |
| C | 14 | 238 | 130800 | 671.32 | 827 | 833 | 193.6 |
| C | 13 | 61 | 5850 | 25.91 | 827 | 833 | 193.6 |
| C | 0 | 10 | 2951 | 10.94 | 827 | 833 | 193.6 |
| D | 7 | 238 | 2249217 | 11341.27 | 819 | 795 | 198.3 |
| D | 12 | 227 | 297839 | 1498.32 | 819 | 795 | 198.3 |
| D | 1 | 52 | 244964 | 1231.61 | 819 | 795 | 198.3 |
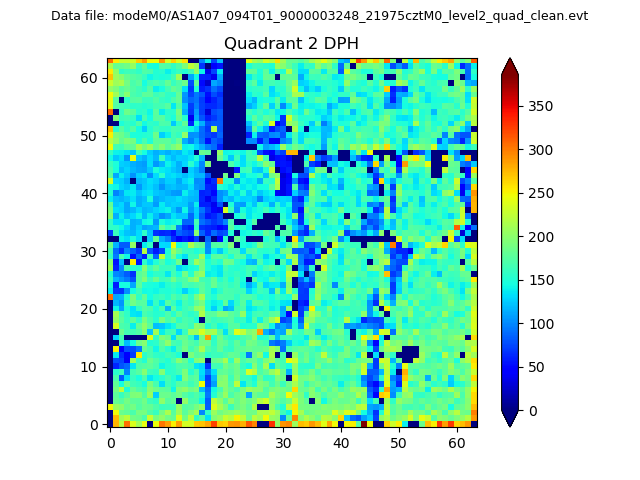
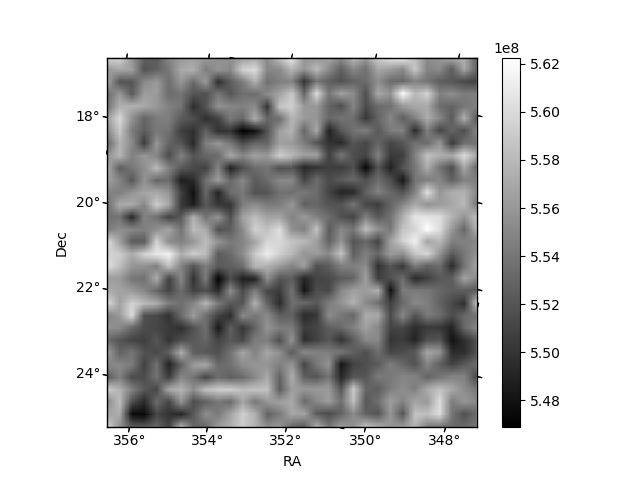
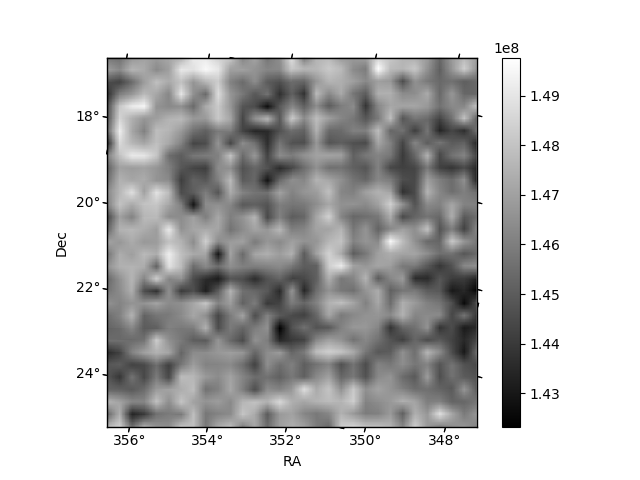
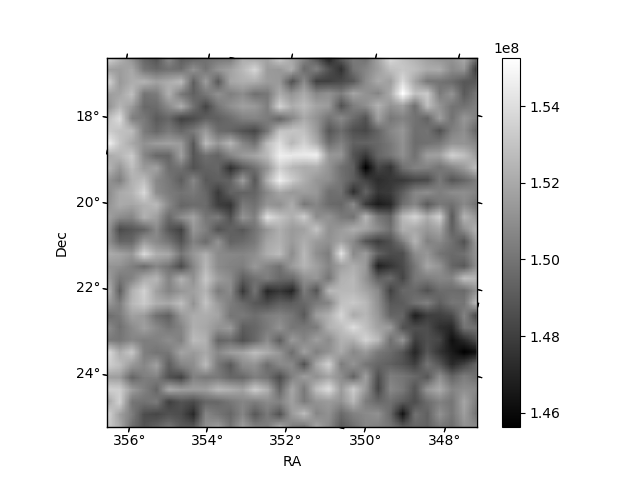
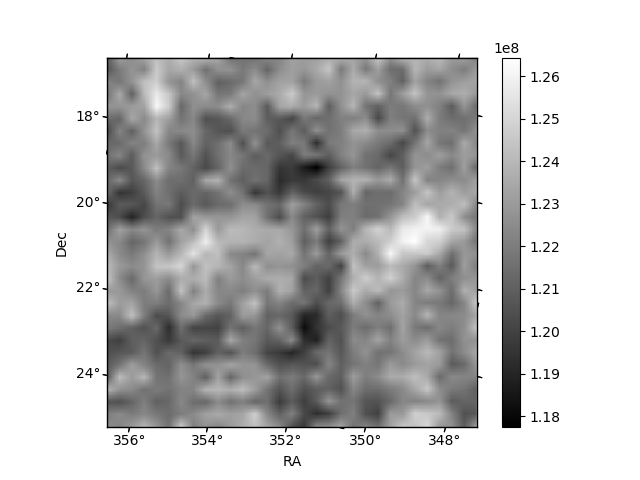
Histogram calculated using DETX and DETY for each event in the final _common_clean file
| Quadrant A | 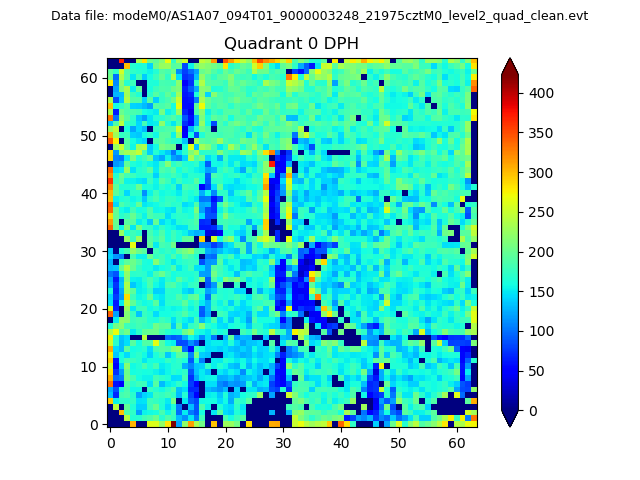 |
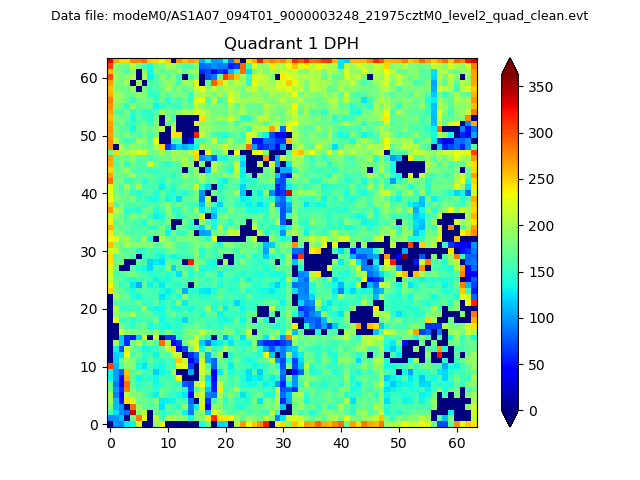 |
Quadrant B |
|---|---|---|---|
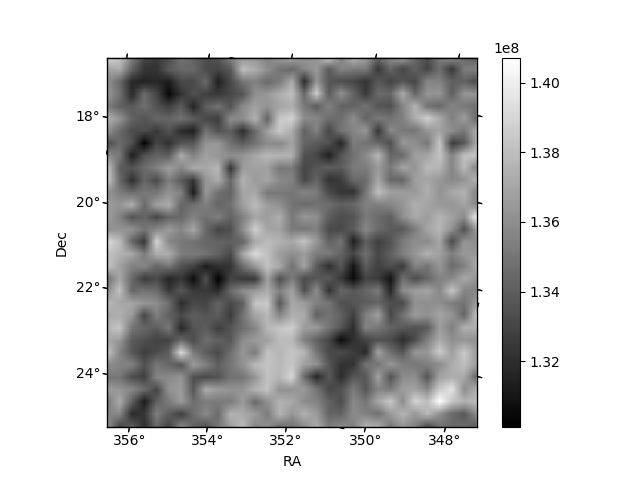
| Quadrant D | 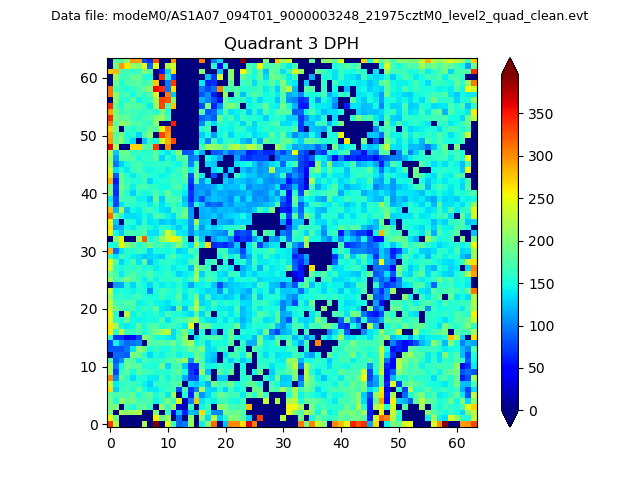 |
 |
Quadrant C |
| Plot type | Count rate plots | Images |
|---|---|---|
| Comparison with Poisson distribution Blue bars denote a histogram of data divided into 1 sec bins. Red curve is a Poisson curve with rate = median count rate of data. |
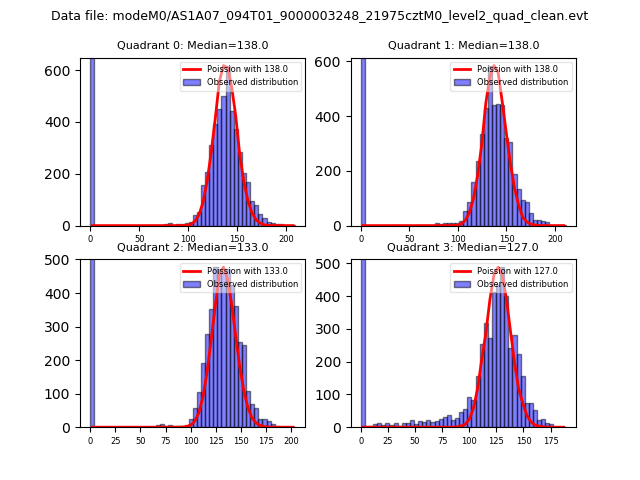 |
 |
| Quadrant-wise count rates Data is divided into 100 sec bins |
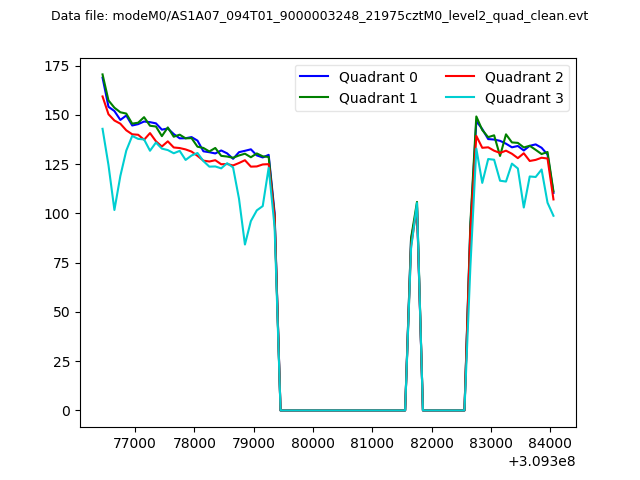 |
|
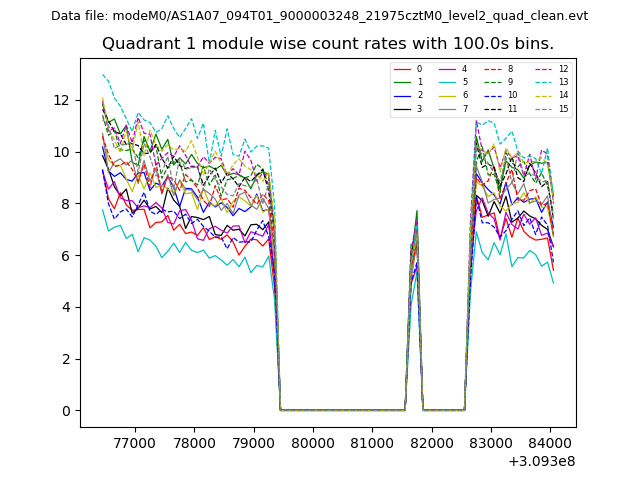
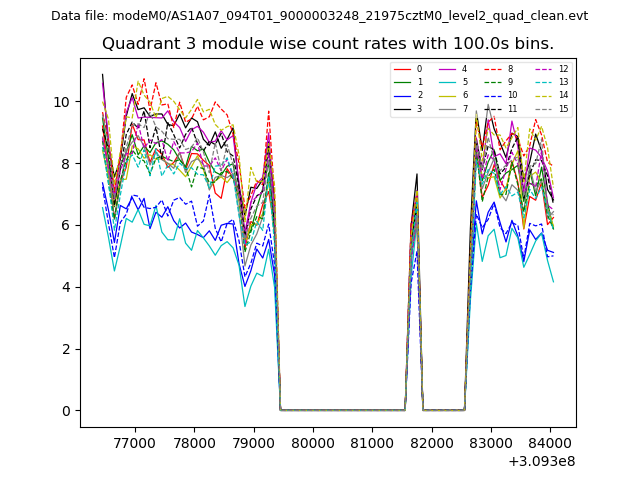
| Module-wise count rates for Quadrant A Data is divided into 100 sec bins |
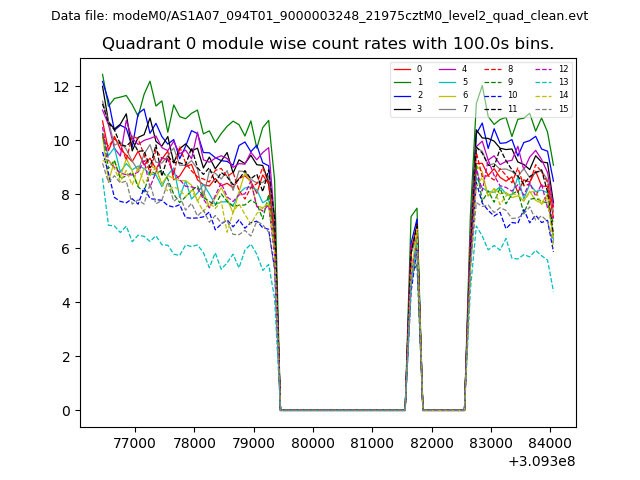 |
 |
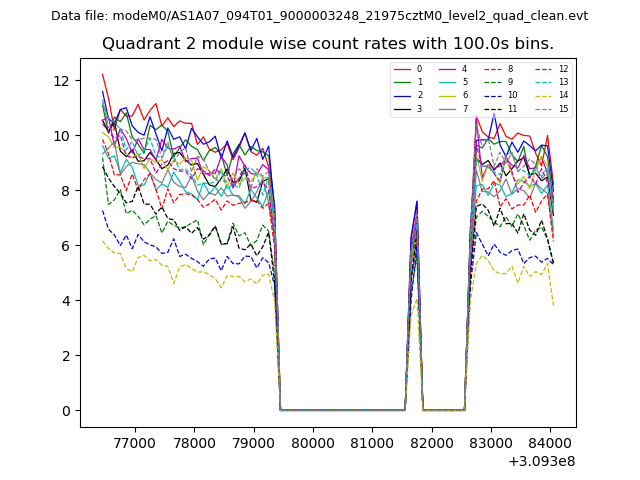
| Module-wise count rates for Quadrant B Data is divided into 100 sec bins |
 |
 |
| Module-wise count rates for Quadrant C Data is divided into 100 sec bins |
 |
 |
| Module-wise count rates for Quadrant D Data is divided into 100 sec bins |
 |
 |
| Parameter | Plot |
|---|---|
| CZT HV Monitor | 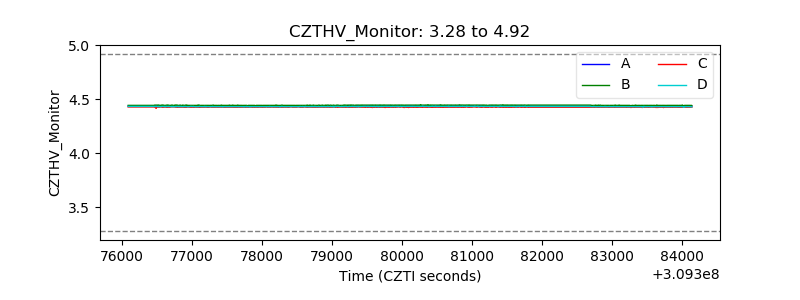 |
| D_VDD | 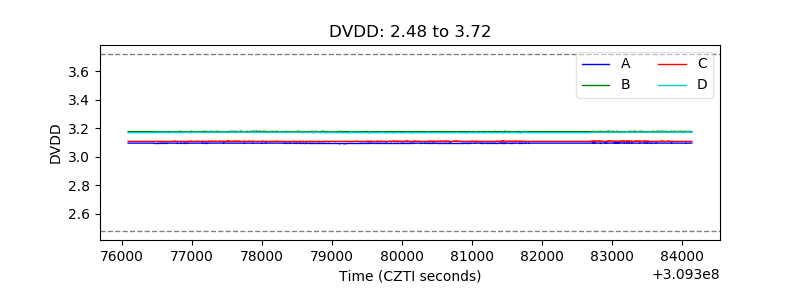 |
| Temperature 1 | 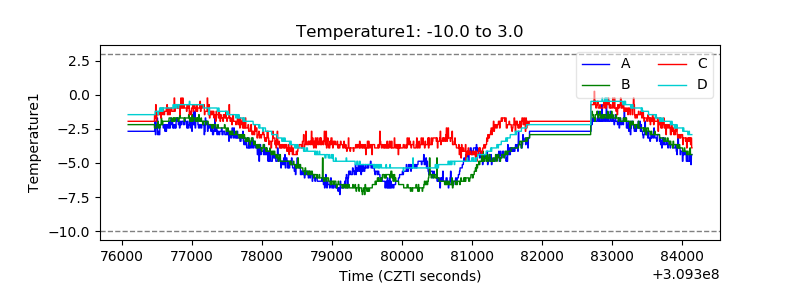 |
| Veto HV Monitor |  |
| Veto LLD | 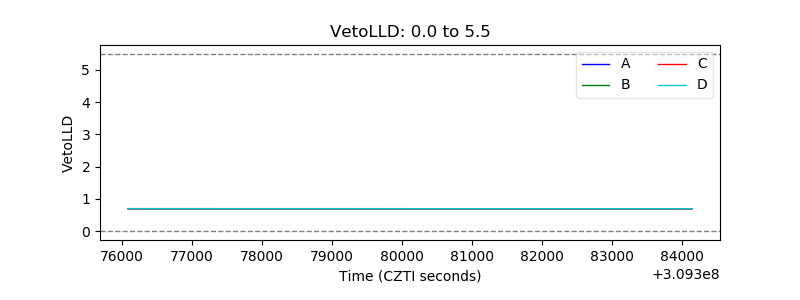 |
| Alpha Counter | 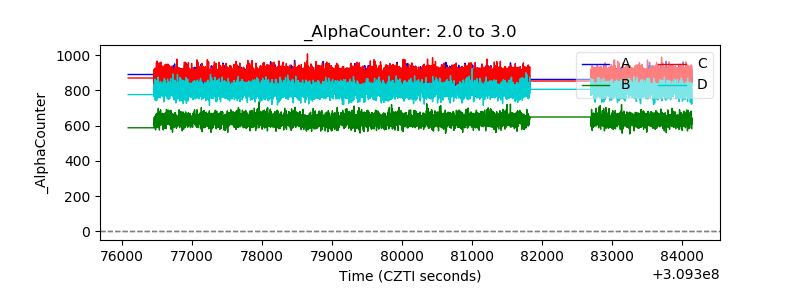 |
| _CPM_Rate | 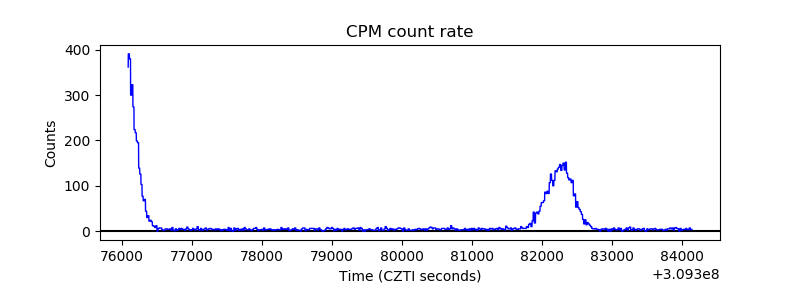 |
| CZT Counter | 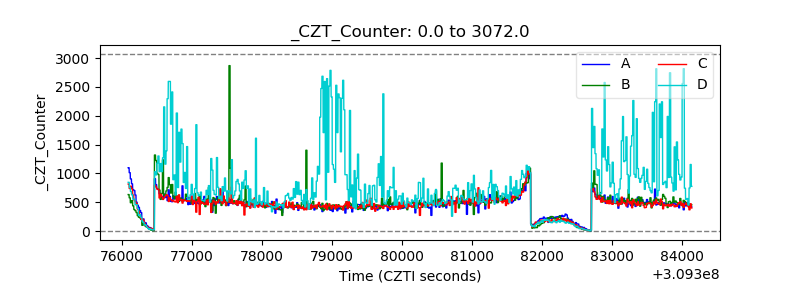 |
| +2.5 Volts monitor |  |
| +5 Volts monitor |  |
| _ROLL_ROT | 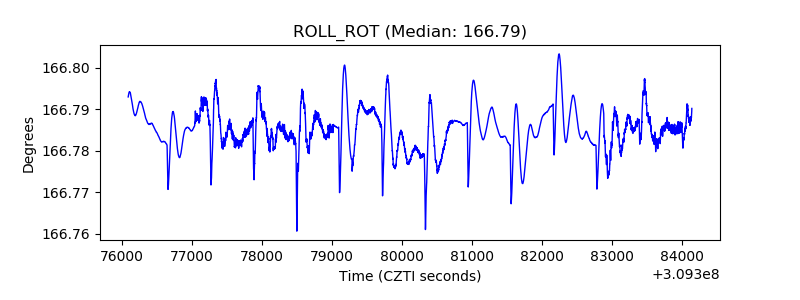 |
| _Roll_DEC | 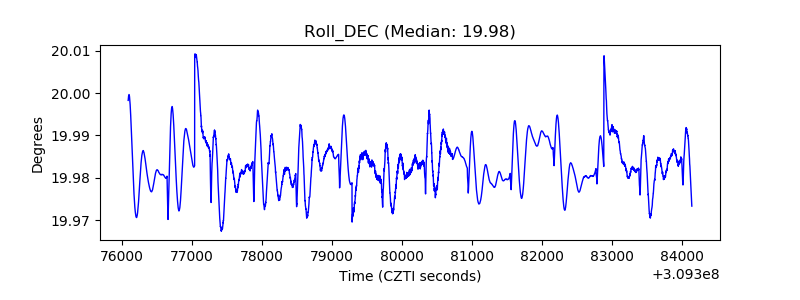 |
| _Roll_RA | 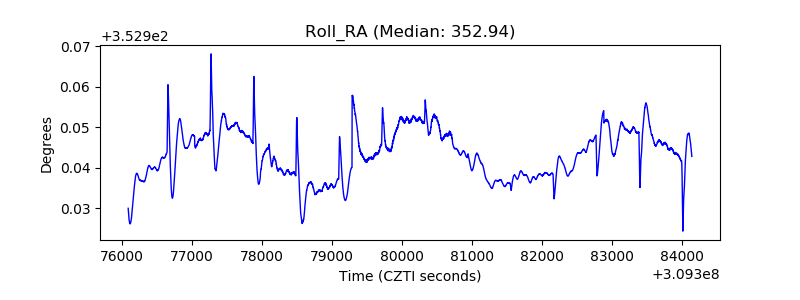 |
| Veto Counter | 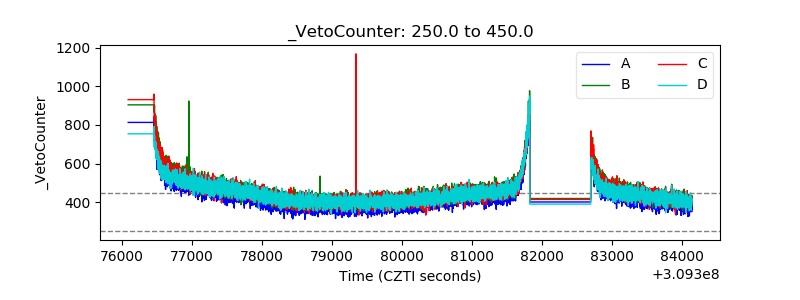 |