| Param | Original file | Final file |
|---|---|---|
| Filename | modeM0/AS1A07_094T01_9000003248_21977cztM0_level2.evt | modeM0/AS1A07_094T01_9000003248_21977cztM0_level2_quad_clean.evt |
| Size (bytes) | 704,096,640 | 112,368,960 |
| Size | 671.5 MB | 107.2 MB |
| Events in quadrant A | 3,977,747 | 742,627 |
| Events in quadrant B | 4,096,764 | 747,442 |
| Events in quadrant C | 3,855,136 | 721,322 |
| Events in quadrant D | 8,856,552 | 639,053 |
| Mode SS | |||
|---|---|---|---|
| Quadrant | BADHDUFLAG | Total packets | Discarded packets |
| A | 0 | 166 | 0 |
| B | 0 | 166 | 0 |
| C | 0 | 166 | 0 |
| D | 0 | 166 | 0 |
| Mode M0 | |||
|---|---|---|---|
| Quadrant | BADHDUFLAG | Total packets | Discarded packets |
| A | 0 | 17055 | 2 |
| B | 0 | 17398 | 2 |
| C | 0 | 16638 | 2 |
| D | 0 | 31831 | 2 |
| Mode M9 | |||
|---|---|---|---|
| Quadrant | BADHDUFLAG | Total packets | Discarded packets |
| A | 0 | 5 | 0 |
| B | 0 | 5 | 0 |
| C | 0 | 5 | 0 |
| D | 0 | 5 | 0 |
| Quadrant | Total seconds | Saturated seconds | Saturation percentage |
|---|---|---|---|
| A | 7927 | 108 | 1.362432% |
| B | 7928 | 170 | 2.144299% |
| C | 7928 | 135 | 1.702825% |
| D | 7927 | 1284 | 16.197805% |
Noise dominated data is calculated using 1-second bins in cleaned event files. If a bin has >2000 counts, and if more than 50% of those come from <1% of pixels, then it is considered to be noise-dominated and hence unusable.
| Quadrant | # 1 sec bins | Bins with >0 counts | Bins with >2000 counts | High rate bins dominated by noise | Noise dominated (total time) | Noise dominated (detector-on time) | Marked lightcurve |
|---|---|---|---|---|---|---|---|
| A | 8533 | 7930 | 0 | 0 | 0.00% | 0.00% | 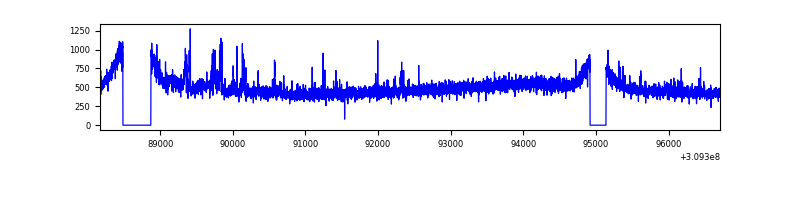 |
| B | 8534 | 7930 | 8 | 8 | 0.09% | 0.10% | 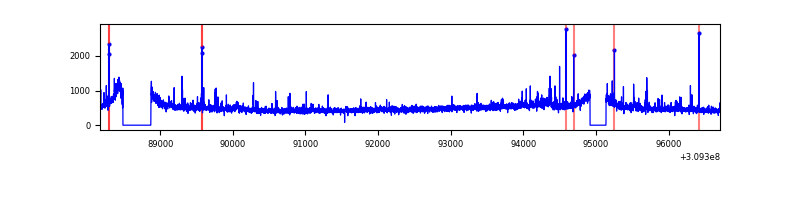 |
| C | 8534 | 7930 | 0 | 0 | 0.00% | 0.00% | 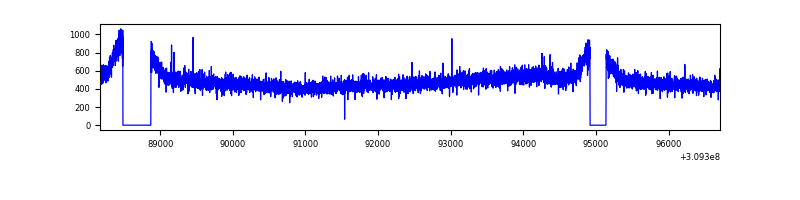 |
| D | 8533 | 7929 | 1070 | 1070 | 12.54% | 13.49% | 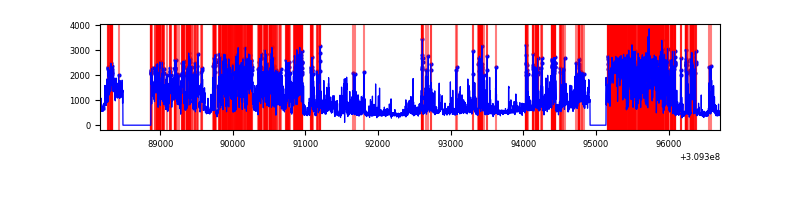 |
Top three noisy pixels from each quadrant. If the there are fewer than three noisy pixels in the level2.evt file, extra rows are filled as -1
| Pixel properties | Quadrant properties | ||||||
|---|---|---|---|---|---|---|---|
| Quadrant | DetID | PixID | Counts | Sigma | Mean | Median | Sigma |
| A | 2 | 79 | 137778 | 674.48 | 992 | 971 | 202.8 |
| A | 13 | 254 | 14544 | 66.91 | 992 | 971 | 202.8 |
| A | 3 | 137 | 8624 | 37.73 | 992 | 971 | 202.8 |
| B | 0 | 230 | 102522 | 533.92 | 983 | 957 | 190.2 |
| B | 3 | 64 | 74993 | 389.2 | 983 | 957 | 190.2 |
| B | 0 | 190 | 32246 | 164.49 | 983 | 957 | 190.2 |
| C | 14 | 238 | 149855 | 664.29 | 949 | 954 | 224.1 |
| C | 13 | 61 | 6685 | 25.57 | 949 | 954 | 224.1 |
| C | 14 | 220 | 3217 | 10.1 | 949 | 954 | 224.1 |
| D | 7 | 238 | 3692082 | 16701.36 | 911 | 885 | 221.0 |
| D | 13 | 104 | 894739 | 4044.37 | 911 | 885 | 221.0 |
| D | 12 | 227 | 539401 | 2436.59 | 911 | 885 | 221.0 |
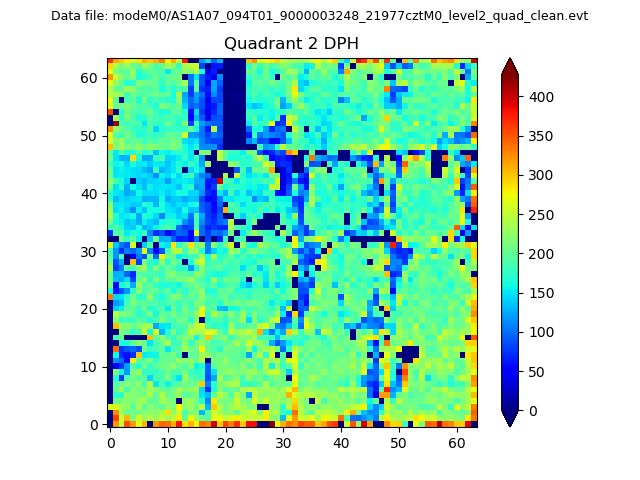
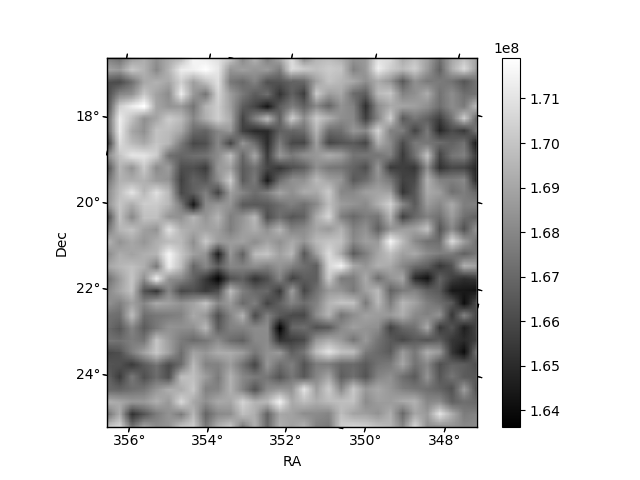
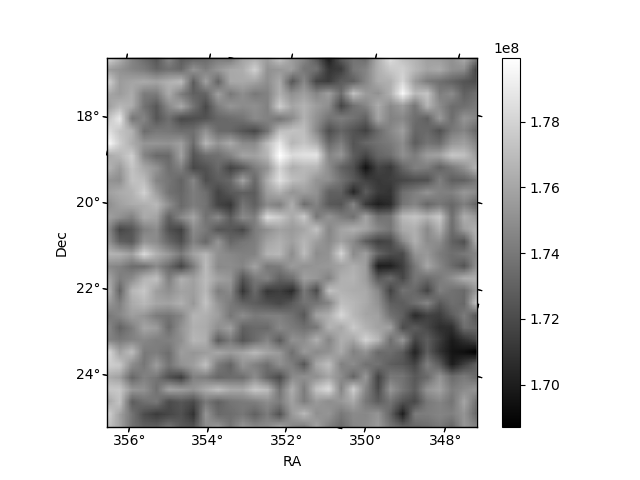
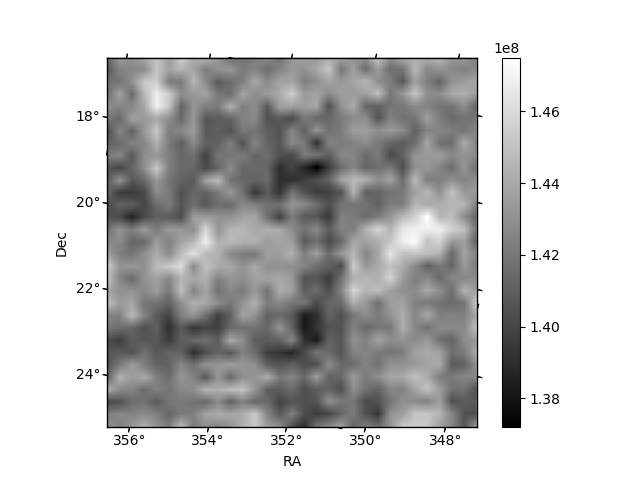
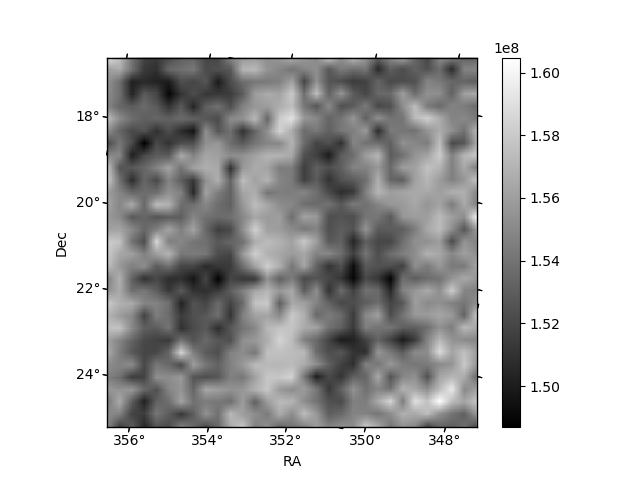
Histogram calculated using DETX and DETY for each event in the final _common_clean file
| Quadrant A | 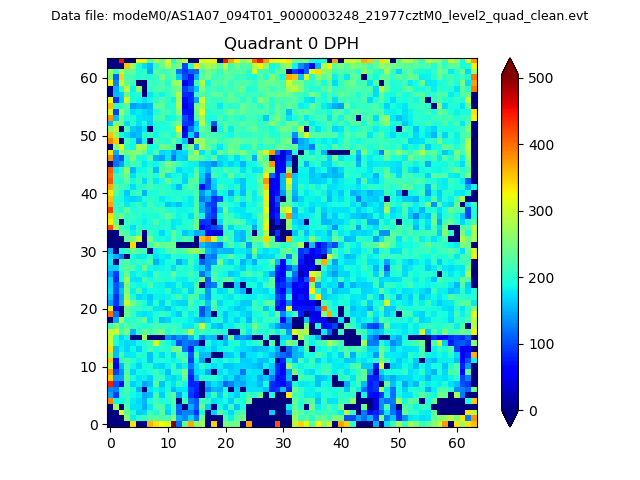 |
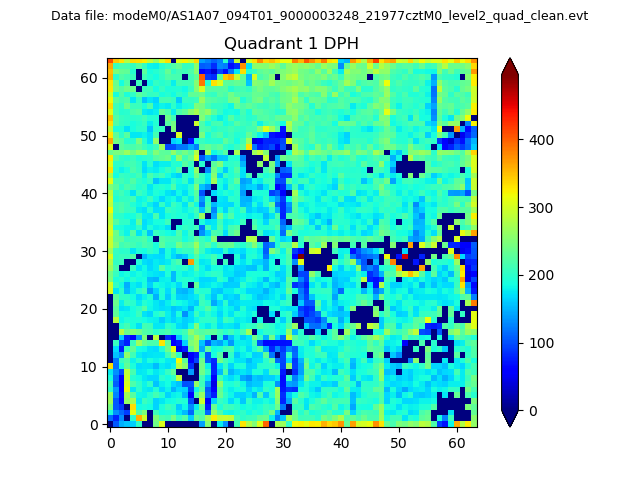 |
Quadrant B |
|---|---|---|---|
| Quadrant D | 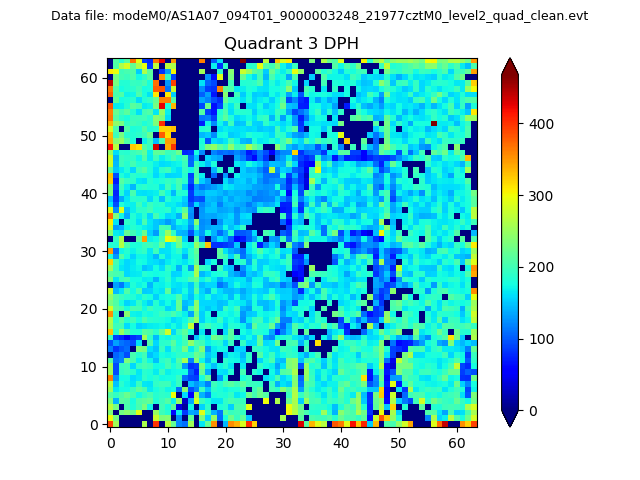 |
 |
Quadrant C |
| Plot type | Count rate plots | Images |
|---|---|---|
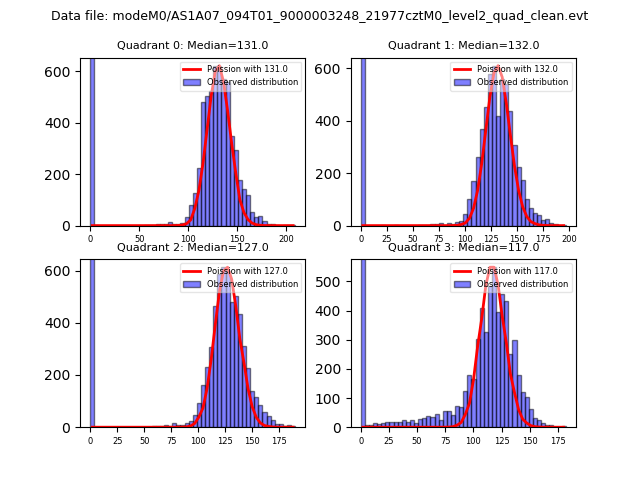
| Comparison with Poisson distribution Blue bars denote a histogram of data divided into 1 sec bins. Red curve is a Poisson curve with rate = median count rate of data. |
 |
 |
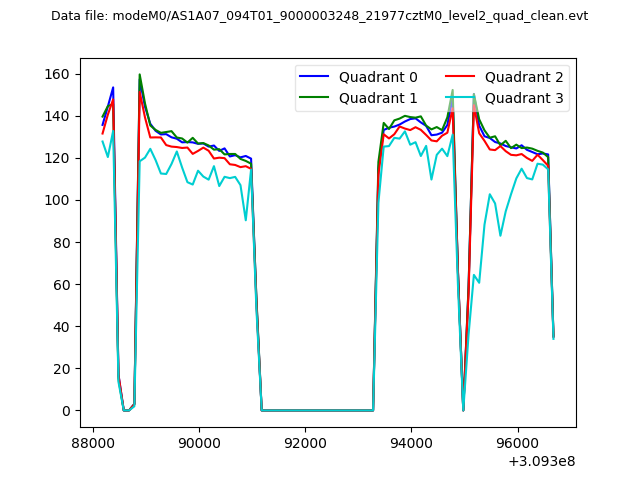
| Quadrant-wise count rates Data is divided into 100 sec bins |
 |
|
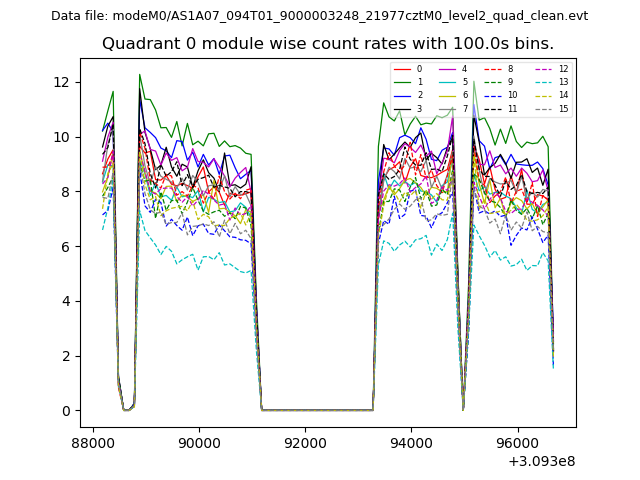
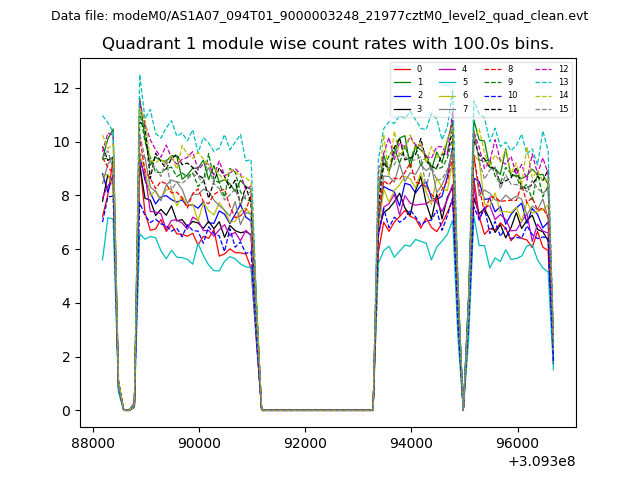
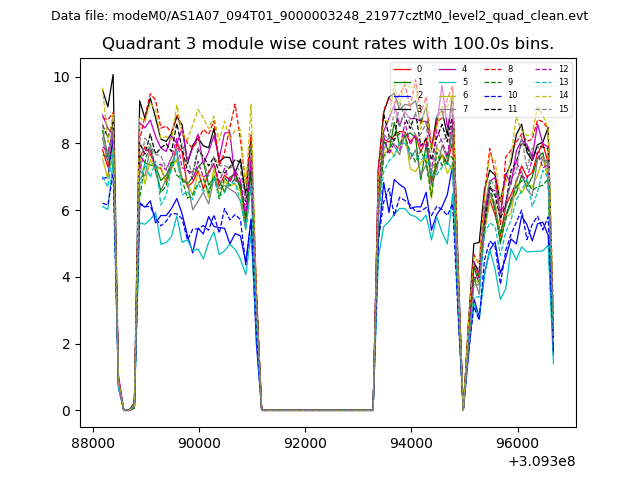
| Module-wise count rates for Quadrant A Data is divided into 100 sec bins |
 |
 |
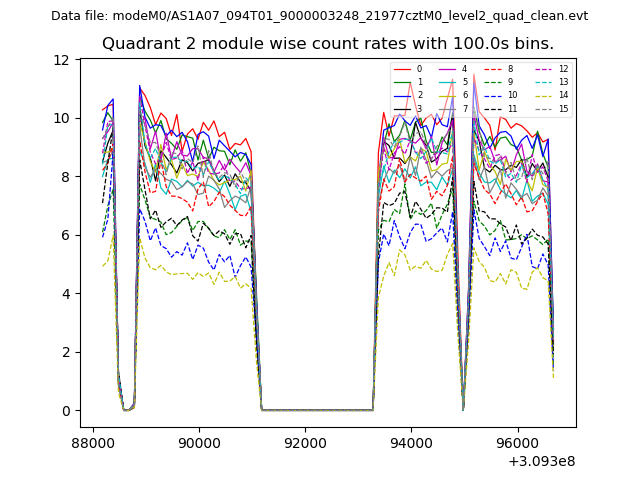
| Module-wise count rates for Quadrant B Data is divided into 100 sec bins |
 |
 |
| Module-wise count rates for Quadrant C Data is divided into 100 sec bins |
 |
 |
| Module-wise count rates for Quadrant D Data is divided into 100 sec bins |
 |
 |
| Parameter | Plot |
|---|---|
| CZT HV Monitor | 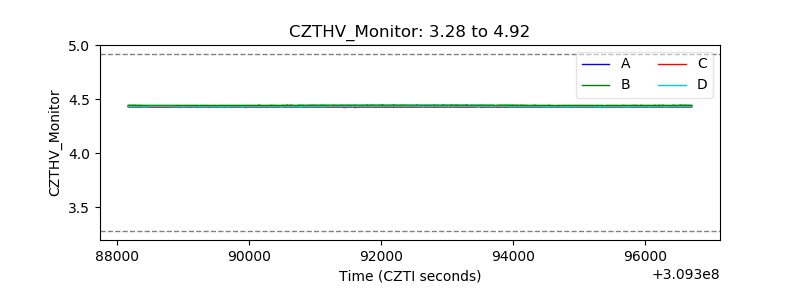 |
| D_VDD | 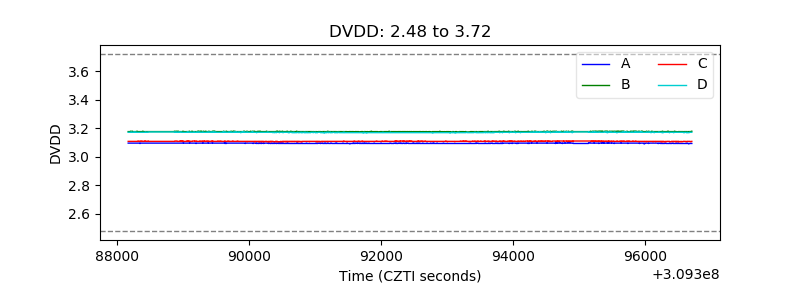 |
| Temperature 1 | 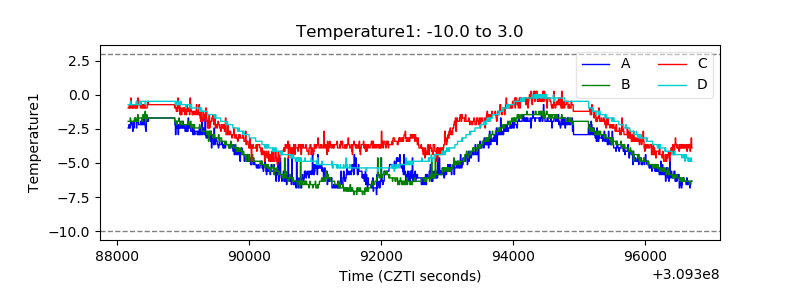 |
| Veto HV Monitor | 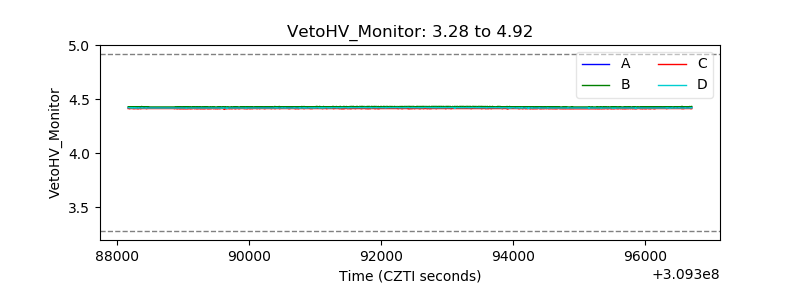 |
| Veto LLD | 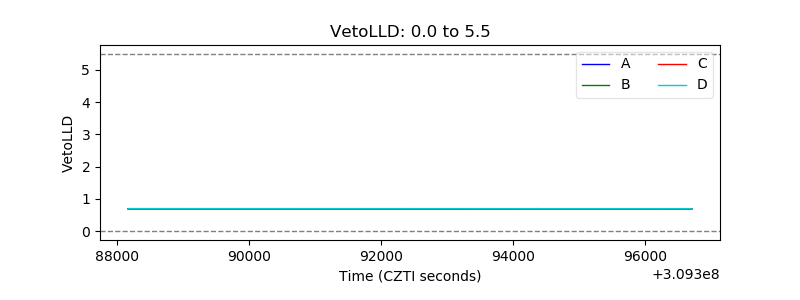 |
| Alpha Counter | 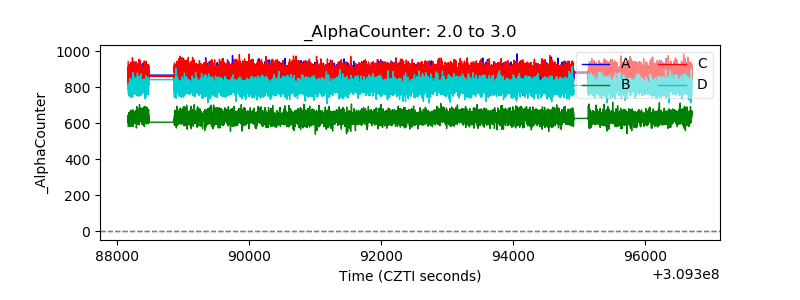 |
| _CPM_Rate | 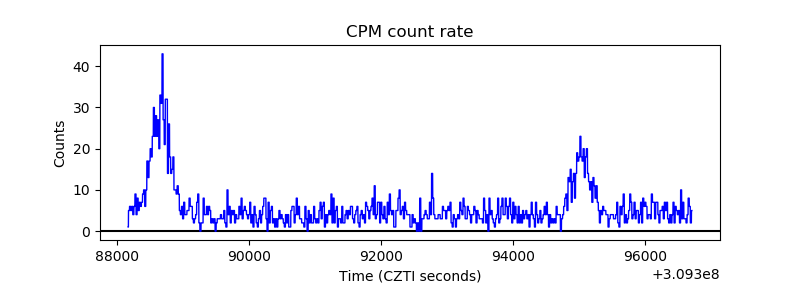 |
| CZT Counter | 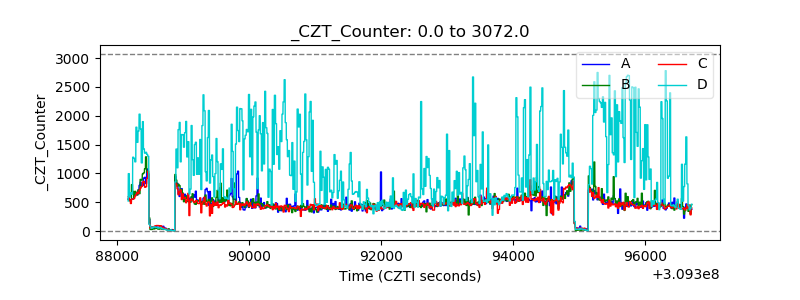 |
| +2.5 Volts monitor | 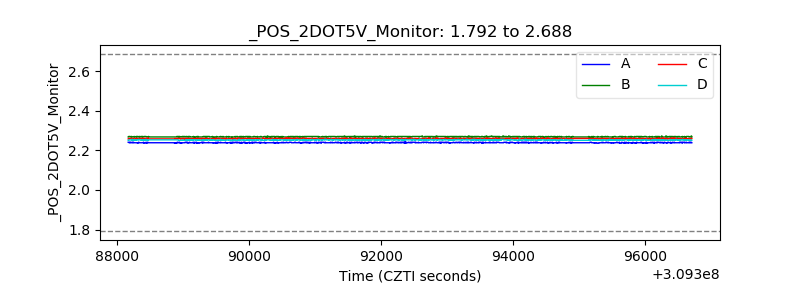 |
| +5 Volts monitor |  |
| _ROLL_ROT | 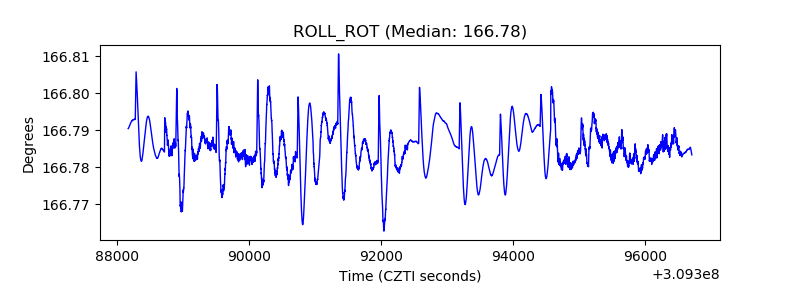 |
| _Roll_DEC |  |
| _Roll_RA | 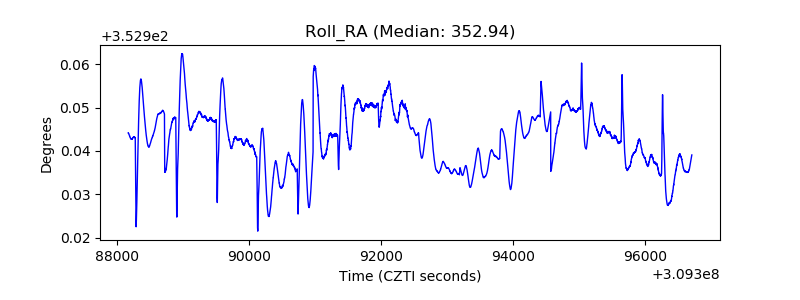 |
| Veto Counter | 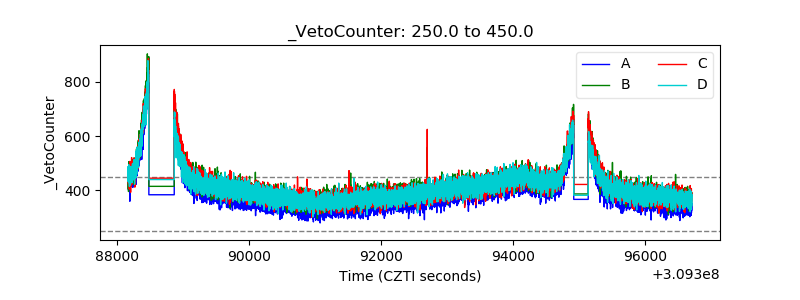 |