| Param | Original file | Final file |
|---|---|---|
| Filename | modeM0/AS1A07_094T01_9000003248_21980cztM0_level2.evt | modeM0/AS1A07_094T01_9000003248_21980cztM0_level2_quad_clean.evt |
| Size (bytes) | 855,357,120 | 144,627,840 |
| Size | 815.7 MB | 137.9 MB |
| Events in quadrant A | 5,410,178 | 915,966 |
| Events in quadrant B | 6,218,574 | 920,702 |
| Events in quadrant C | 5,451,388 | 887,840 |
| Events in quadrant D | 8,039,314 | 852,781 |
| Mode SS | |||
|---|---|---|---|
| Quadrant | BADHDUFLAG | Total packets | Discarded packets |
| A | 0 | 234 | 0 |
| B | 0 | 234 | 0 |
| C | 0 | 234 | 0 |
| D | 0 | 234 | 0 |
| Mode M0 | |||
|---|---|---|---|
| Quadrant | BADHDUFLAG | Total packets | Discarded packets |
| A | 0 | 23619 | 2 |
| B | 0 | 25867 | 2 |
| C | 0 | 23625 | 2 |
| D | 0 | 31887 | 2 |
| Mode M9 | |||
|---|---|---|---|
| Quadrant | BADHDUFLAG | Total packets | Discarded packets |
| A | 0 | 13 | 0 |
| B | 0 | 13 | 0 |
| C | 0 | 13 | 0 |
| D | 0 | 13 | 0 |
| Quadrant | Total seconds | Saturated seconds | Saturation percentage |
|---|---|---|---|
| A | 11612 | 39 | 0.335859% |
| B | 11612 | 216 | 1.860145% |
| C | 11611 | 89 | 0.766515% |
| D | 11611 | 406 | 3.496684% |
Noise dominated data is calculated using 1-second bins in cleaned event files. If a bin has >2000 counts, and if more than 50% of those come from <1% of pixels, then it is considered to be noise-dominated and hence unusable.
| Quadrant | # 1 sec bins | Bins with >0 counts | Bins with >2000 counts | High rate bins dominated by noise | Noise dominated (total time) | Noise dominated (detector-on time) | Marked lightcurve |
|---|---|---|---|---|---|---|---|
| A | 12832 | 11612 | 0 | 0 | 0.00% | 0.00% | 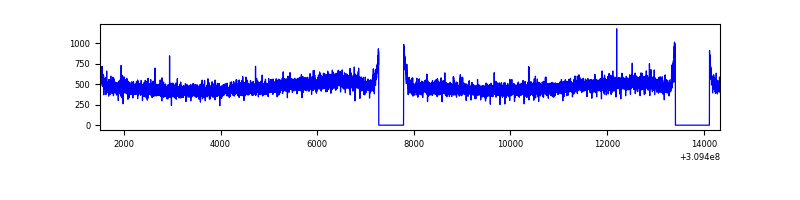 |
| B | 12832 | 11613 | 129 | 129 | 1.01% | 1.11% | 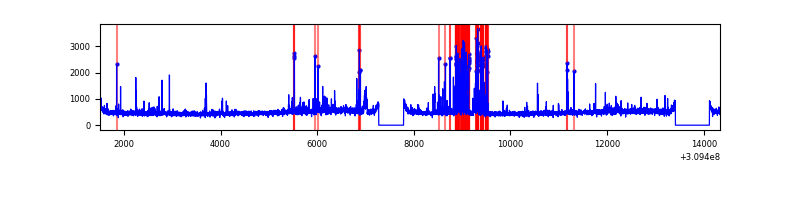 |
| C | 12831 | 11613 | 0 | 0 | 0.00% | 0.00% | 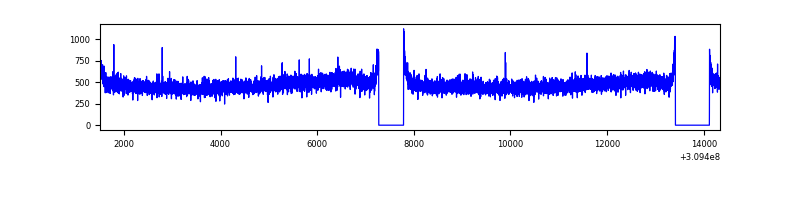 |
| D | 12831 | 11613 | 323 | 323 | 2.52% | 2.78% | 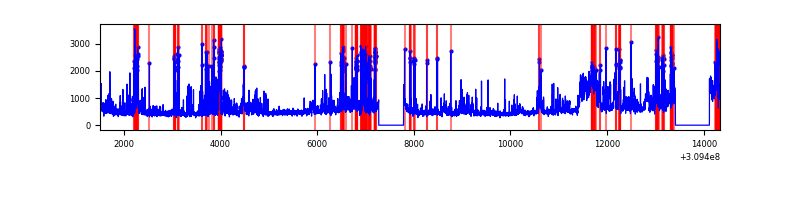 |
Top three noisy pixels from each quadrant. If the there are fewer than three noisy pixels in the level2.evt file, extra rows are filled as -1
| Pixel properties | Quadrant properties | ||||||
|---|---|---|---|---|---|---|---|
| Quadrant | DetID | PixID | Counts | Sigma | Mean | Median | Sigma |
| A | 13 | 254 | 20846 | 68.68 | 1398 | 1368 | 283.6 |
| A | 3 | 137 | 11899 | 37.14 | 1398 | 1368 | 283.6 |
| A | 0 | 226 | 11880 | 37.07 | 1398 | 1368 | 283.6 |
| B | 3 | 64 | 554438 | 2063.68 | 1387 | 1350 | 268.0 |
| B | 0 | 230 | 91146 | 335.05 | 1387 | 1350 | 268.0 |
| B | 0 | 190 | 72516 | 265.53 | 1387 | 1350 | 268.0 |
| C | 14 | 238 | 211927 | 666.42 | 1341 | 1343 | 316.0 |
| C | 13 | 61 | 9241 | 24.99 | 1341 | 1343 | 316.0 |
| C | 10 | 91 | 4849 | 11.09 | 1341 | 1343 | 316.0 |
| D | 7 | 238 | 2083492 | 6334.83 | 1345 | 1307 | 328.7 |
| D | 1 | 52 | 278585 | 843.59 | 1345 | 1307 | 328.7 |
| D | 13 | 172 | 165754 | 500.31 | 1345 | 1307 | 328.7 |
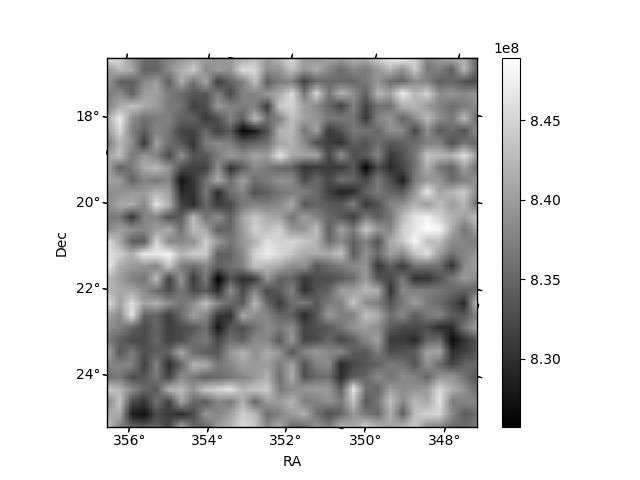
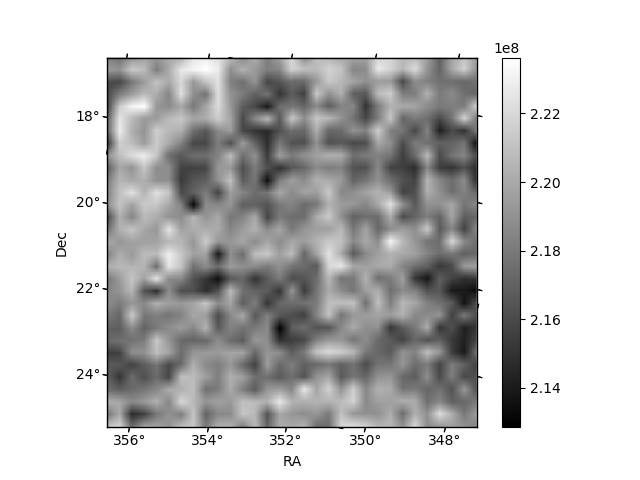
Histogram calculated using DETX and DETY for each event in the final _common_clean file
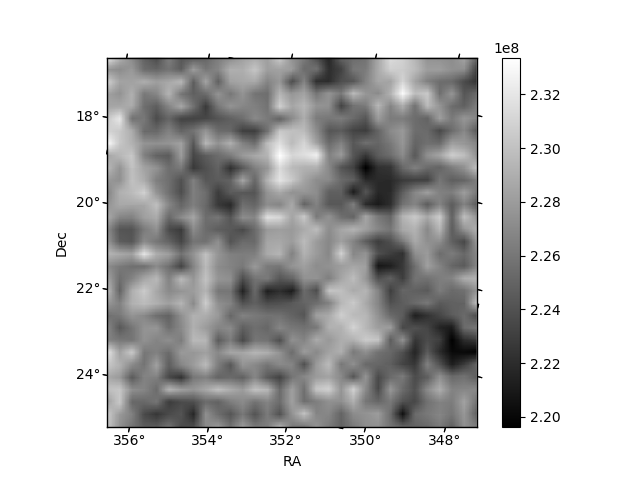
| Quadrant A | 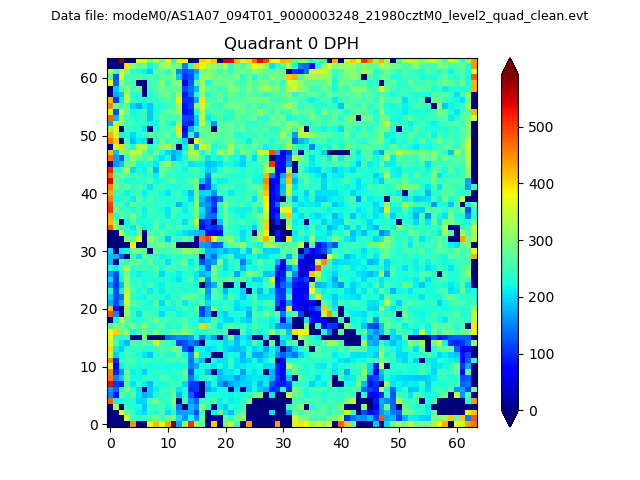 |
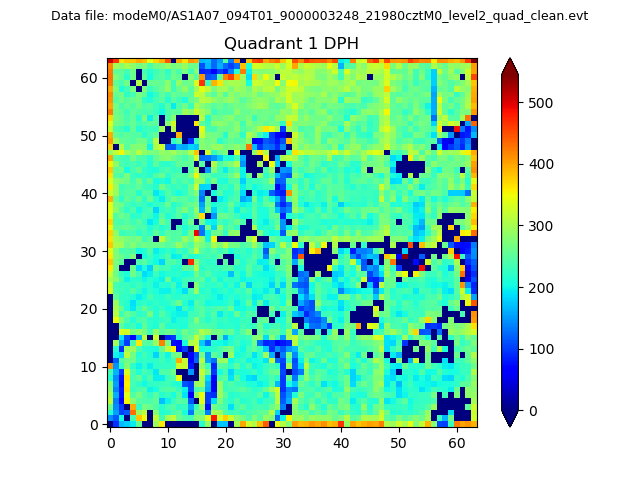 |
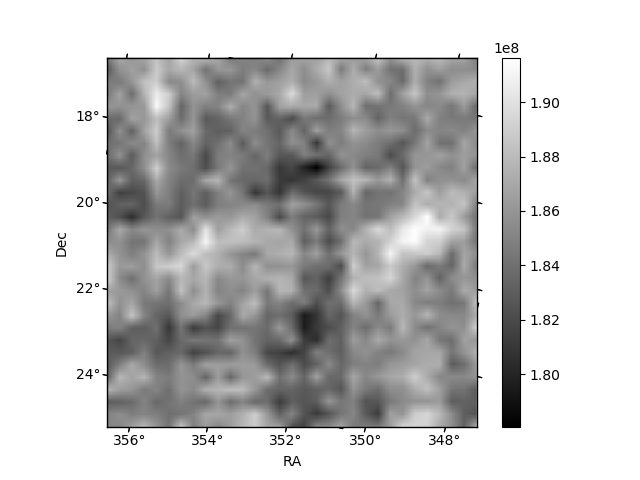
Quadrant B |
|---|---|---|---|
| Quadrant D | 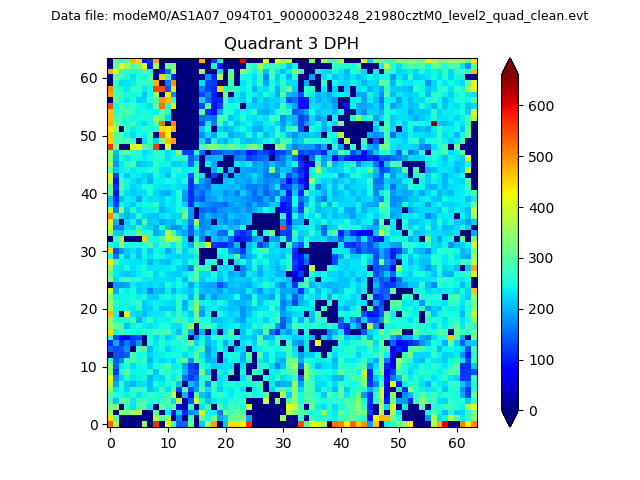 |
 |
Quadrant C |
| Plot type | Count rate plots | Images |
|---|---|---|
| Comparison with Poisson distribution Blue bars denote a histogram of data divided into 1 sec bins. Red curve is a Poisson curve with rate = median count rate of data. |
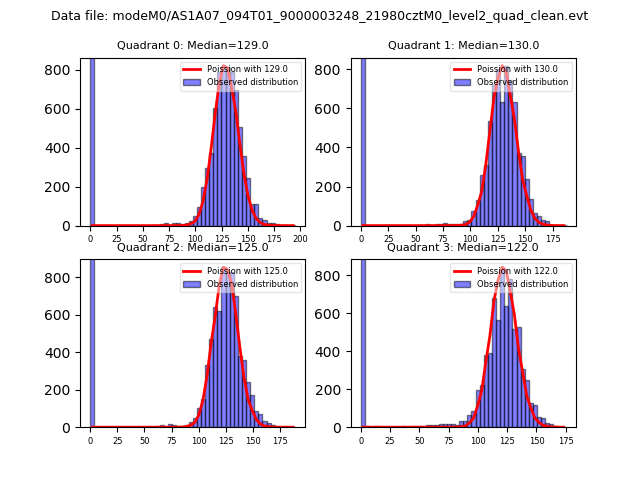 |
 |
| Quadrant-wise count rates Data is divided into 100 sec bins |
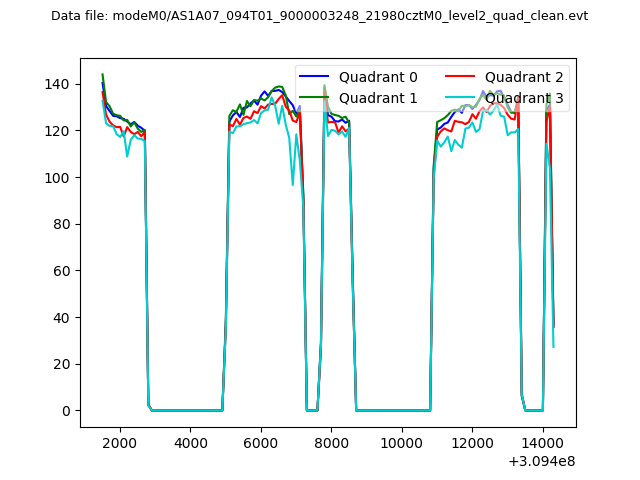 |
|
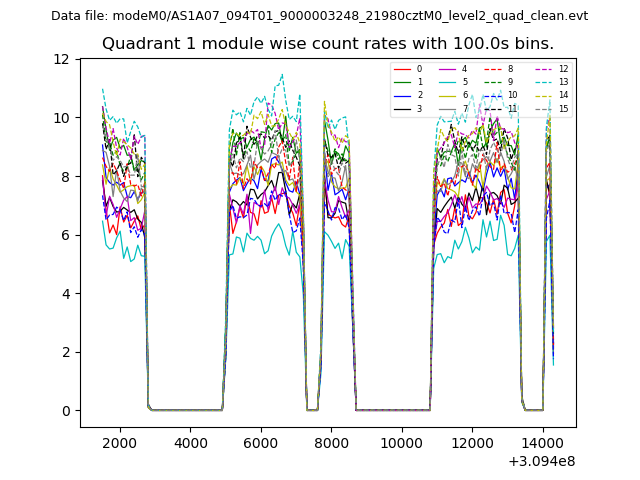
| Module-wise count rates for Quadrant A Data is divided into 100 sec bins |
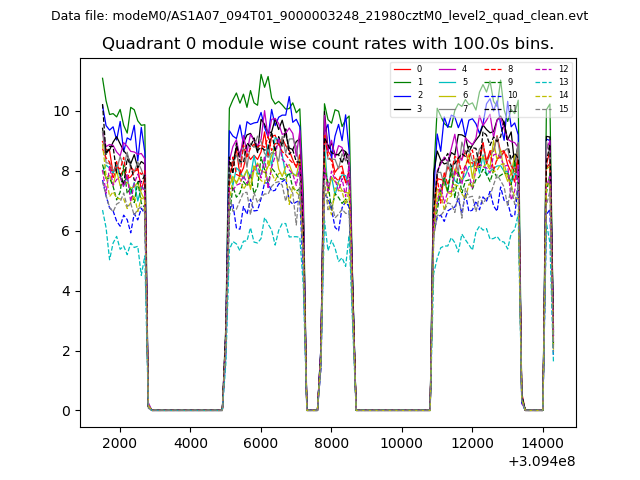 |
 |
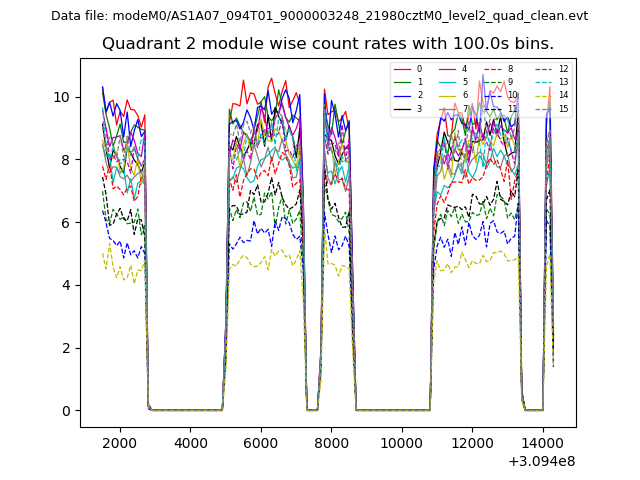
| Module-wise count rates for Quadrant B Data is divided into 100 sec bins |
 |
 |
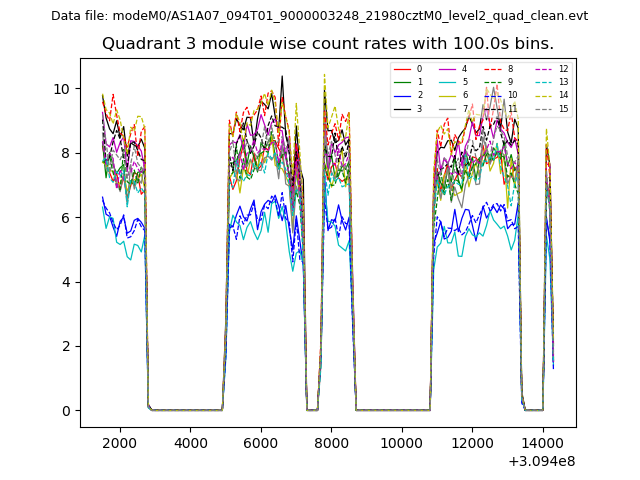
| Module-wise count rates for Quadrant C Data is divided into 100 sec bins |
 |
 |
| Module-wise count rates for Quadrant D Data is divided into 100 sec bins |
 |
 |
| Parameter | Plot |
|---|---|
| CZT HV Monitor |  |
| D_VDD | 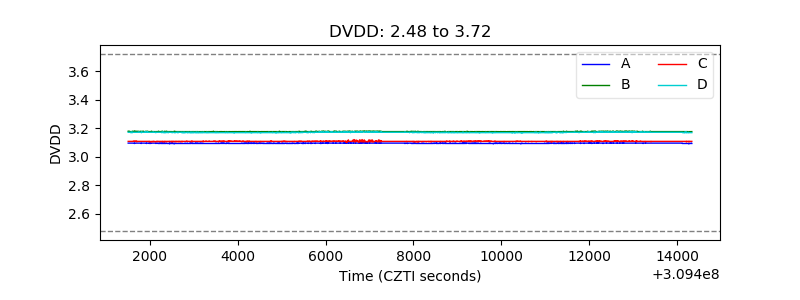 |
| Temperature 1 | 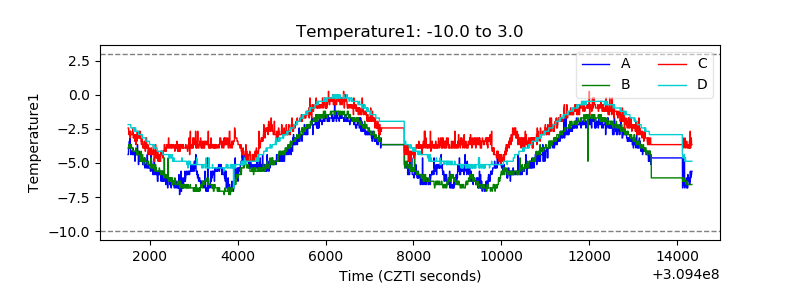 |
| Veto HV Monitor | 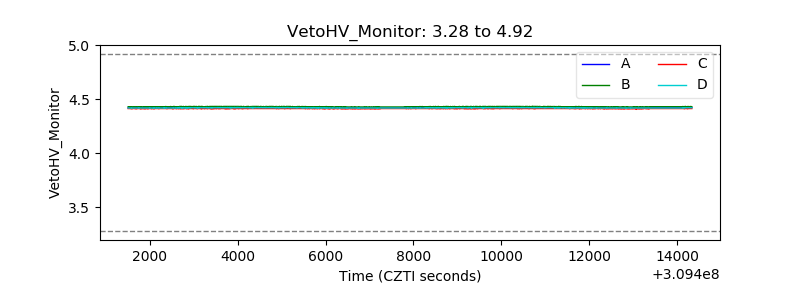 |
| Veto LLD | 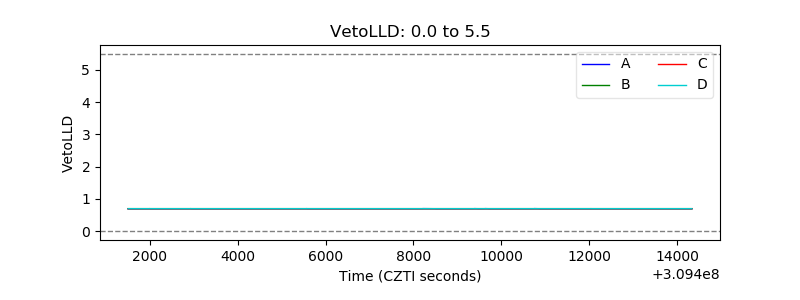 |
| Alpha Counter | 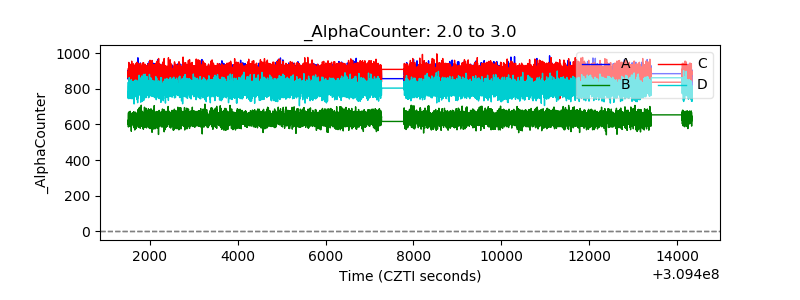 |
| _CPM_Rate | 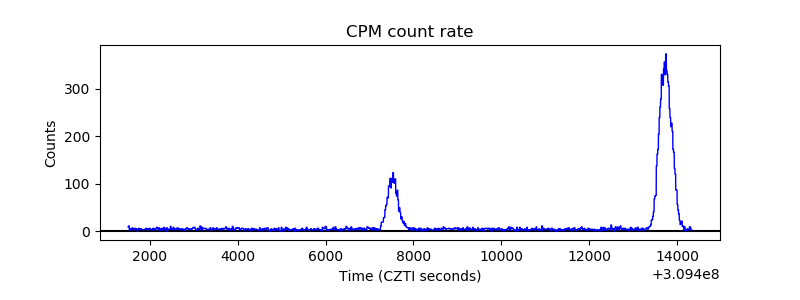 |
| CZT Counter | 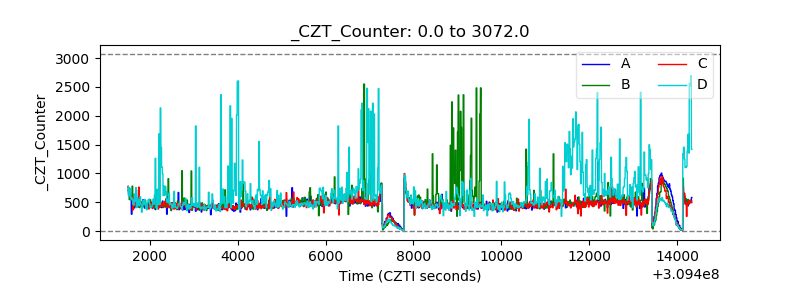 |
| +2.5 Volts monitor |  |
| +5 Volts monitor | 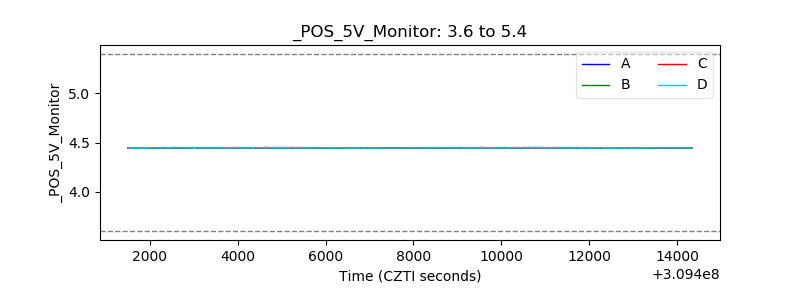 |
| _ROLL_ROT | 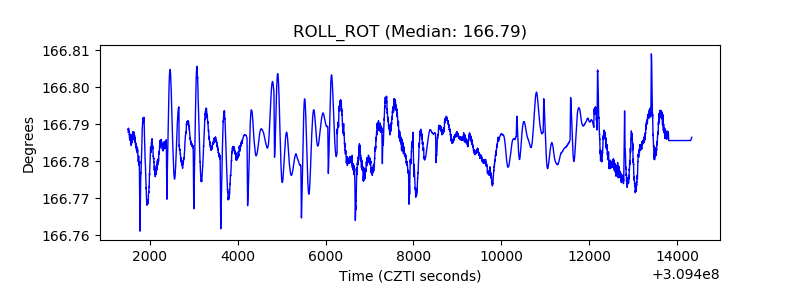 |
| _Roll_DEC | 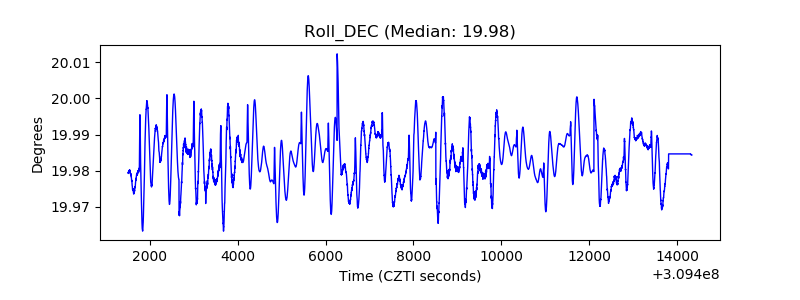 |
| _Roll_RA | 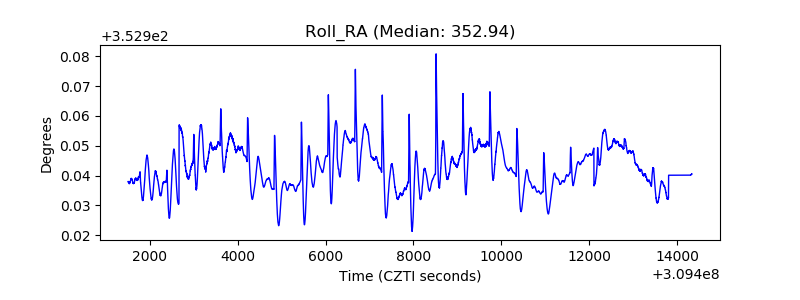 |
| Veto Counter | 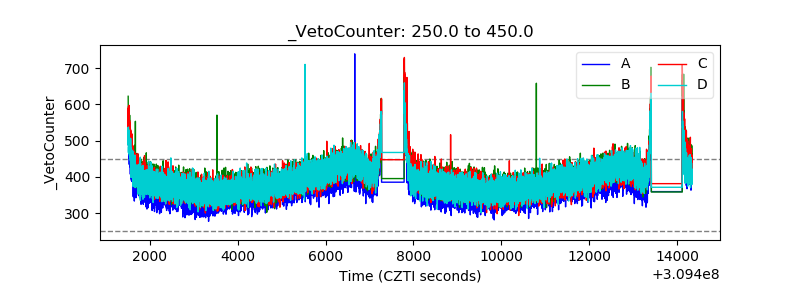 |