| Param | Original file | Final file |
|---|---|---|
| Filename | modeM0/AS1A07_094T01_9000003248_21984cztM0_level2.evt | modeM0/AS1A07_094T01_9000003248_21984cztM0_level2_quad_clean.evt |
| Size (bytes) | 567,362,880 | 72,538,560 |
| Size | 541.1 MB | 69.2 MB |
| Events in quadrant A | 3,349,766 | 452,222 |
| Events in quadrant B | 3,499,554 | 458,132 |
| Events in quadrant C | 3,308,587 | 434,290 |
| Events in quadrant D | 6,588,910 | 402,593 |
| Mode SS | |||
|---|---|---|---|
| Quadrant | BADHDUFLAG | Total packets | Discarded packets |
| A | 0 | 130 | 0 |
| B | 0 | 130 | 0 |
| C | 0 | 130 | 0 |
| D | 0 | 130 | 0 |
| Mode M0 | |||
|---|---|---|---|
| Quadrant | BADHDUFLAG | Total packets | Discarded packets |
| A | 0 | 13906 | 2 |
| B | 0 | 14394 | 2 |
| C | 0 | 13747 | 2 |
| D | 0 | 23949 | 2 |
| Mode M9 | |||
|---|---|---|---|
| Quadrant | BADHDUFLAG | Total packets | Discarded packets |
| A | 0 | 17 | 0 |
| B | 0 | 18 | 0 |
| C | 0 | 18 | 0 |
| D | 0 | 18 | 0 |
| Quadrant | Total seconds | Saturated seconds | Saturation percentage |
|---|---|---|---|
| A | 6437 | 70 | 1.087463% |
| B | 6437 | 105 | 1.631195% |
| C | 6437 | 93 | 1.444772% |
| D | 6437 | 743 | 11.542644% |
Noise dominated data is calculated using 1-second bins in cleaned event files. If a bin has >2000 counts, and if more than 50% of those come from <1% of pixels, then it is considered to be noise-dominated and hence unusable.
| Quadrant | # 1 sec bins | Bins with >0 counts | Bins with >2000 counts | High rate bins dominated by noise | Noise dominated (total time) | Noise dominated (detector-on time) | Marked lightcurve |
|---|---|---|---|---|---|---|---|
| A | 7602 | 6437 | 0 | 0 | 0.00% | 0.00% | 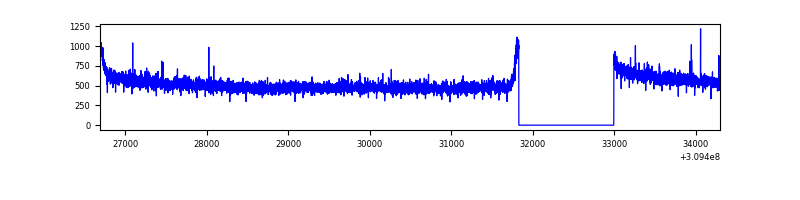 |
| B | 7602 | 6437 | 14 | 14 | 0.18% | 0.22% | 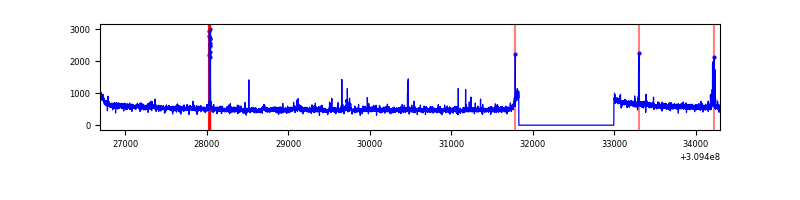 |
| C | 7602 | 6437 | 0 | 0 | 0.00% | 0.00% | 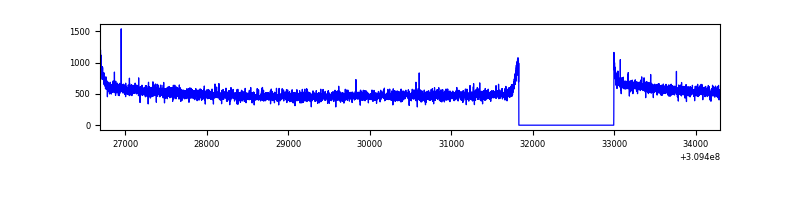 |
| D | 7602 | 6437 | 755 | 755 | 9.93% | 11.73% | 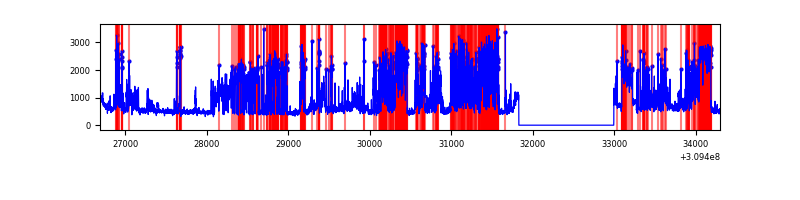 |
Top three noisy pixels from each quadrant. If the there are fewer than three noisy pixels in the level2.evt file, extra rows are filled as -1
| Pixel properties | Quadrant properties | ||||||
|---|---|---|---|---|---|---|---|
| Quadrant | DetID | PixID | Counts | Sigma | Mean | Median | Sigma |
| A | 13 | 254 | 11400 | 61.45 | 867 | 849 | 171.7 |
| A | 0 | 226 | 7668 | 39.72 | 867 | 849 | 171.7 |
| A | 3 | 137 | 7034 | 36.02 | 867 | 849 | 171.7 |
| B | 3 | 64 | 60708 | 370.67 | 858 | 840 | 161.5 |
| B | 0 | 230 | 29931 | 180.11 | 858 | 840 | 161.5 |
| B | 6 | 36 | 21508 | 127.96 | 858 | 840 | 161.5 |
| C | 14 | 238 | 129231 | 682.24 | 813 | 820 | 188.2 |
| C | 13 | 61 | 5786 | 26.38 | 813 | 820 | 188.2 |
| C | 0 | 10 | 4932 | 21.85 | 813 | 820 | 188.2 |
| D | 1 | 52 | 1881923 | 9675.94 | 800 | 776 | 194.4 |
| D | 7 | 238 | 1043635 | 5364.09 | 800 | 776 | 194.4 |
| D | 7 | 223 | 253384 | 1299.32 | 800 | 776 | 194.4 |
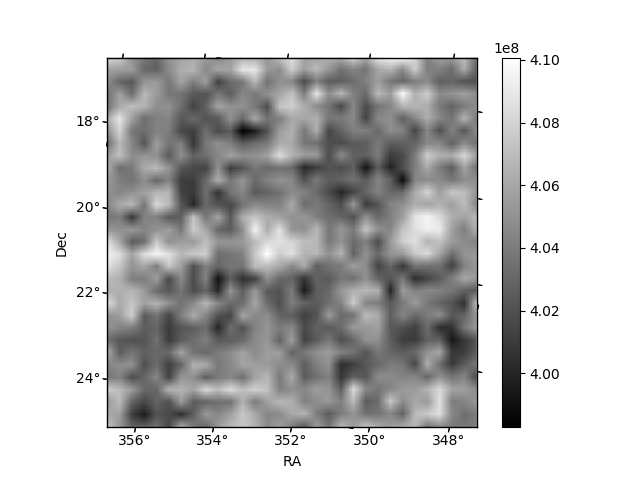
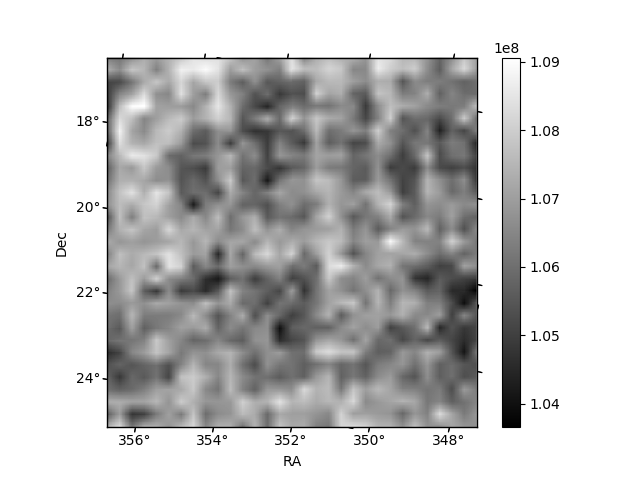
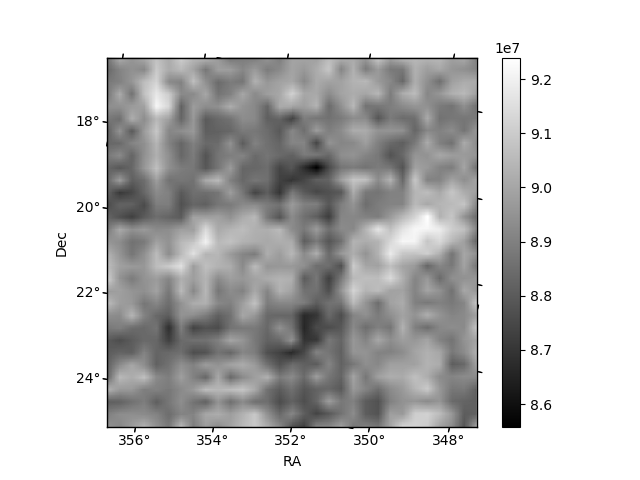
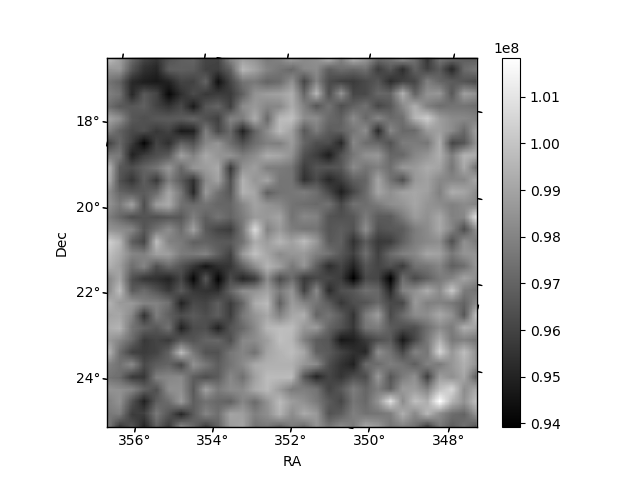
Histogram calculated using DETX and DETY for each event in the final _common_clean file
| Quadrant A | 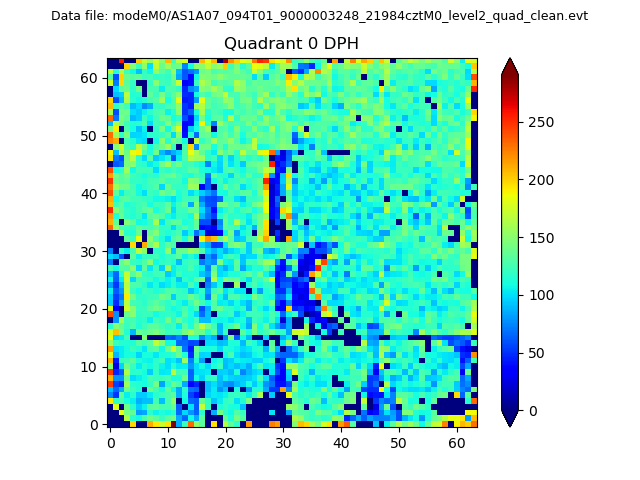 |
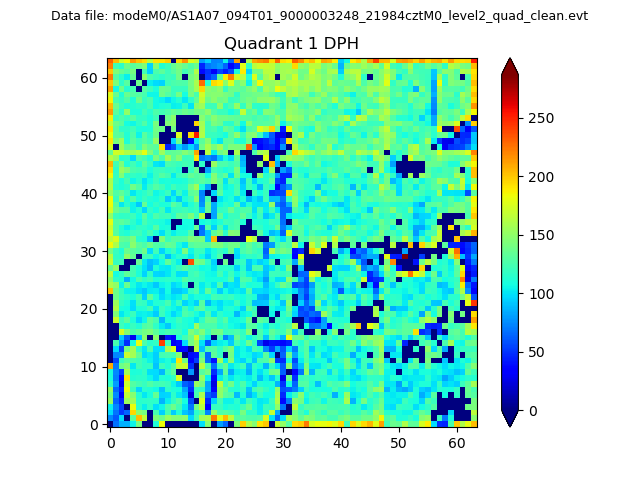 |
Quadrant B |
|---|---|---|---|
| Quadrant D |  |
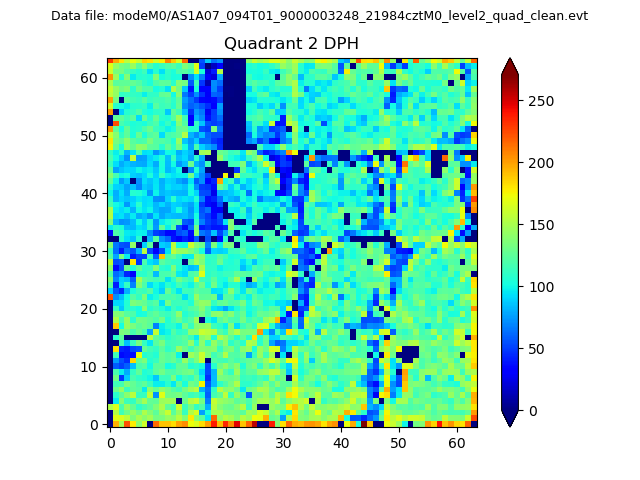 |
Quadrant C |
| Plot type | Count rate plots | Images |
|---|---|---|
| Comparison with Poisson distribution Blue bars denote a histogram of data divided into 1 sec bins. Red curve is a Poisson curve with rate = median count rate of data. |
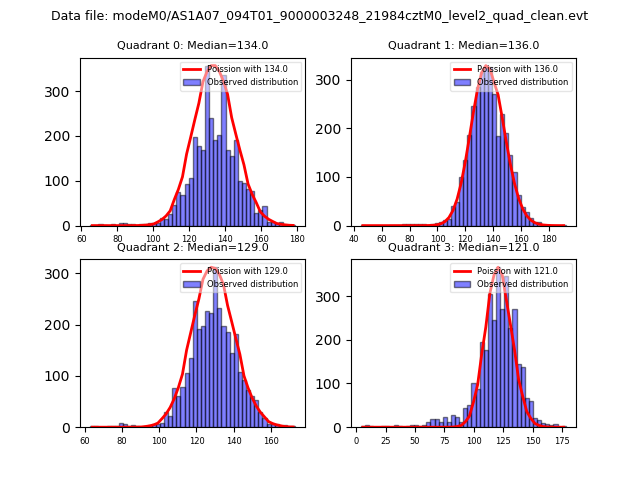 |
 |
| Quadrant-wise count rates Data is divided into 100 sec bins |
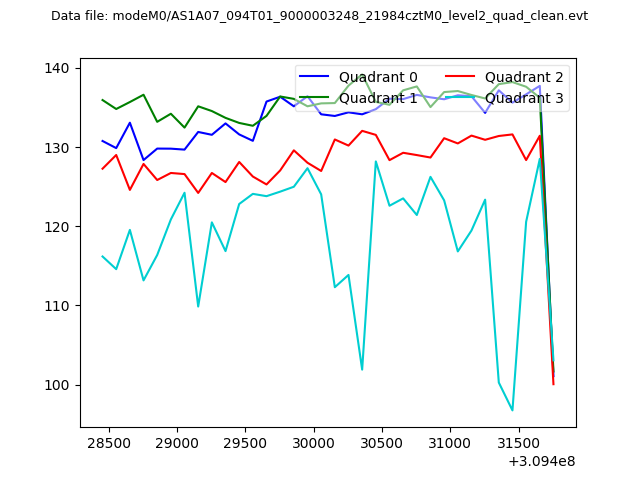 |
|
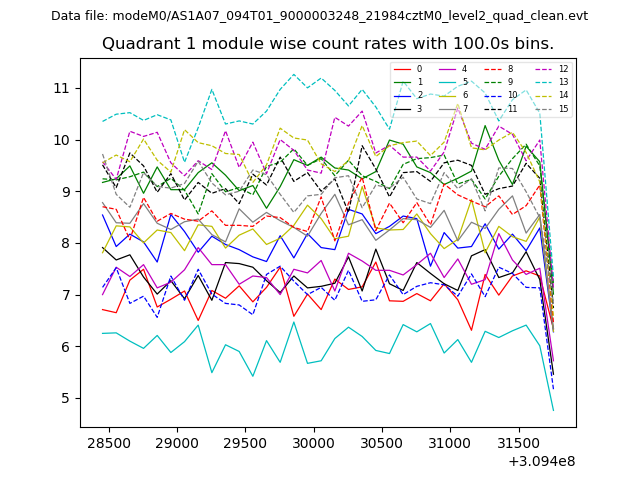
| Module-wise count rates for Quadrant A Data is divided into 100 sec bins |
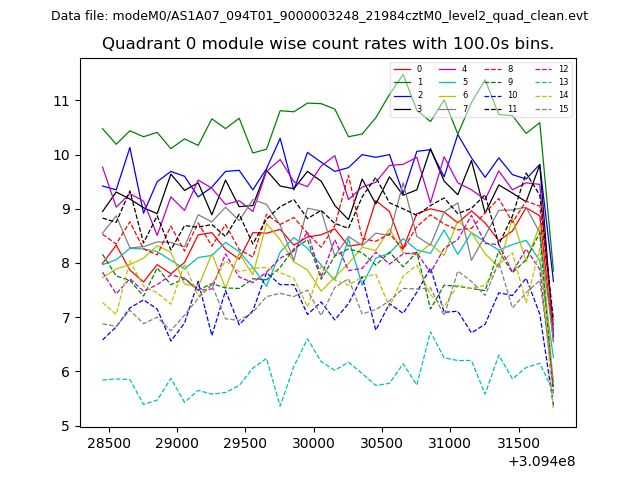 |
 |
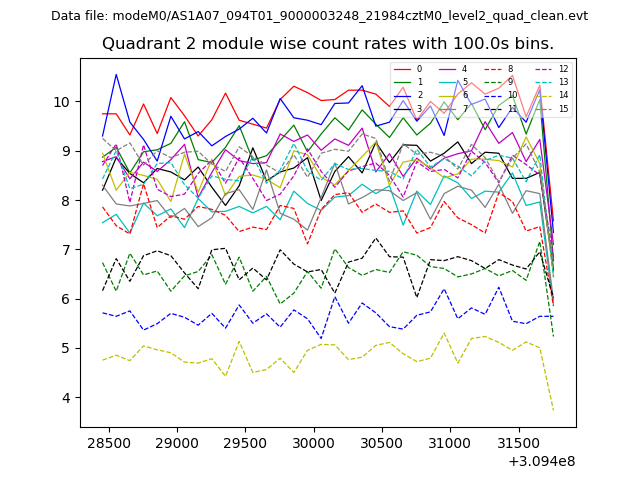
| Module-wise count rates for Quadrant B Data is divided into 100 sec bins |
 |
 |
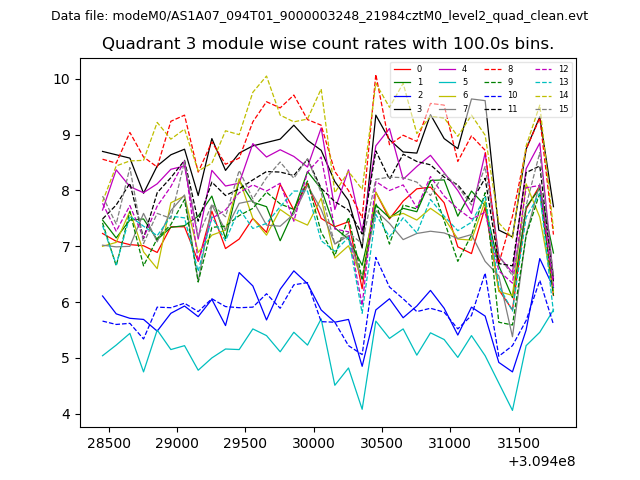
| Module-wise count rates for Quadrant C Data is divided into 100 sec bins |
 |
 |
| Module-wise count rates for Quadrant D Data is divided into 100 sec bins |
 |
 |
| Parameter | Plot |
|---|---|
| CZT HV Monitor | 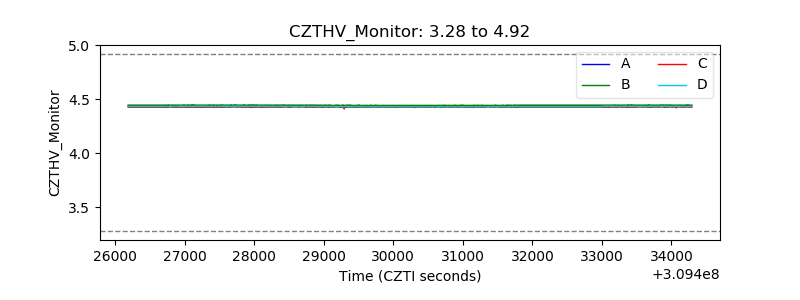 |
| D_VDD | 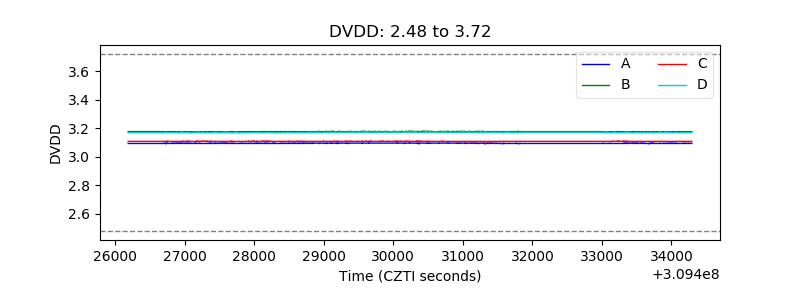 |
| Temperature 1 | 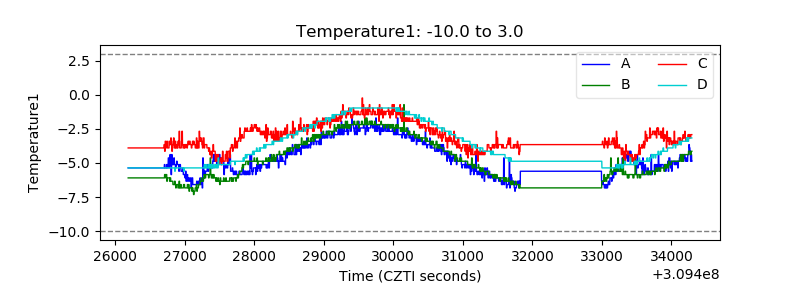 |
| Veto HV Monitor | 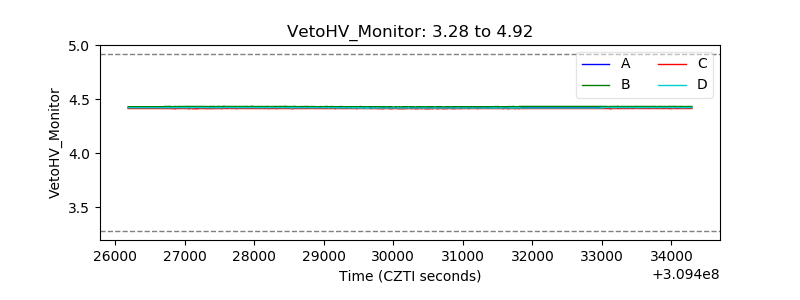 |
| Veto LLD | 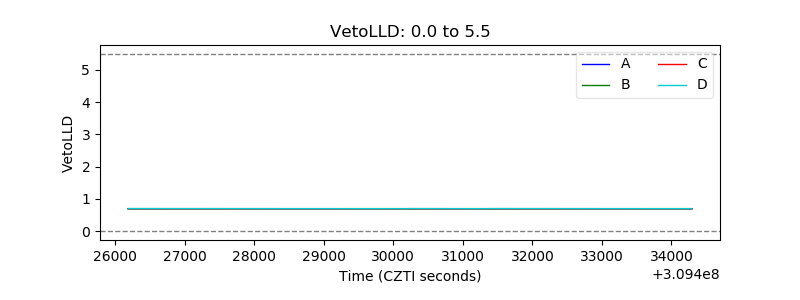 |
| Alpha Counter | 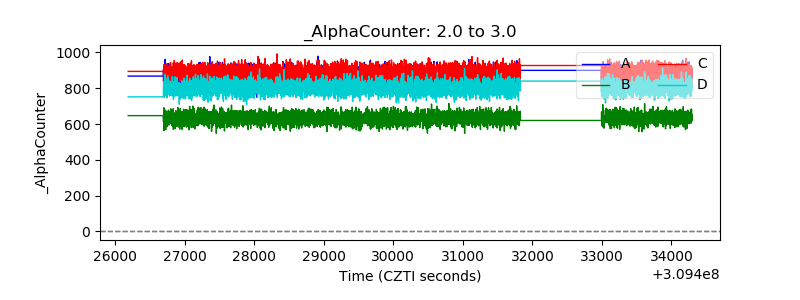 |
| _CPM_Rate | 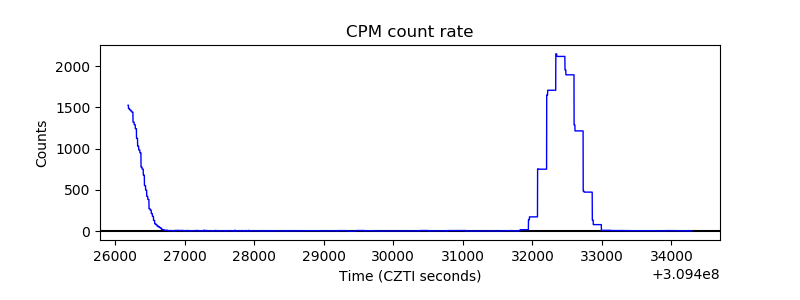 |
| CZT Counter | 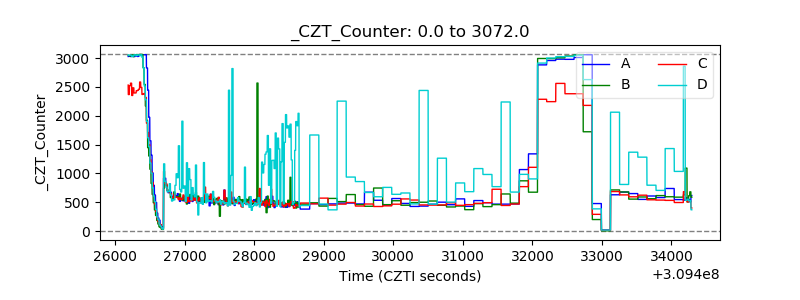 |
| +2.5 Volts monitor |  |
| +5 Volts monitor |  |
| _ROLL_ROT | 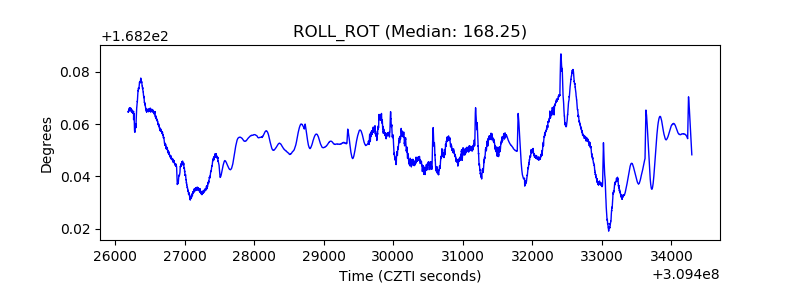 |
| _Roll_DEC | 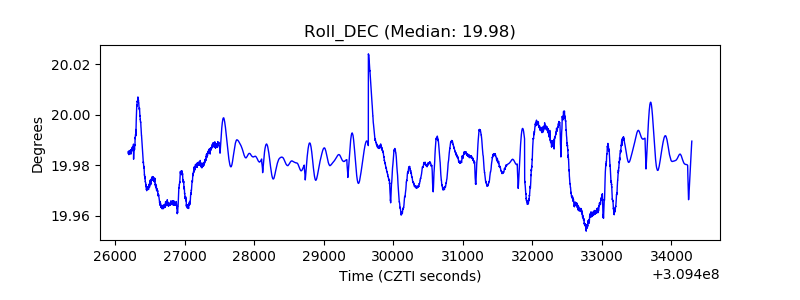 |
| _Roll_RA | 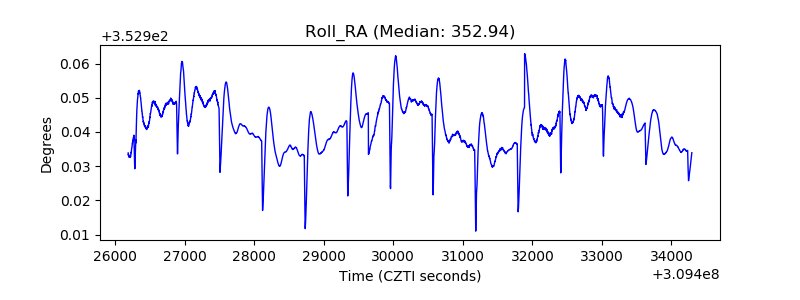 |
| Veto Counter | 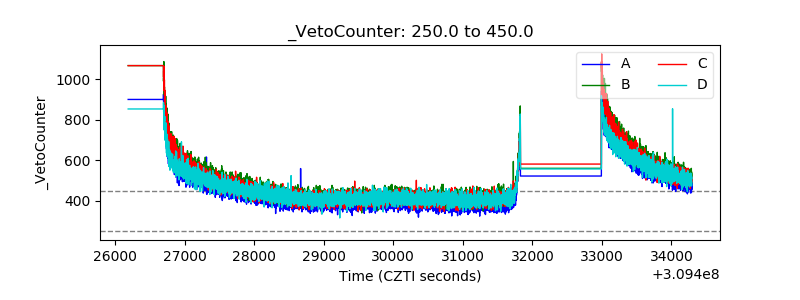 |