| Param | Original file | Final file |
|---|---|---|
| Filename | modeM0/AS1A07_094T01_9000003248_21985cztM0_level2.evt | modeM0/AS1A07_094T01_9000003248_21985cztM0_level2_quad_clean.evt |
| Size (bytes) | 578,710,080 | 100,244,160 |
| Size | 551.9 MB | 95.6 MB |
| Events in quadrant A | 3,841,681 | 659,762 |
| Events in quadrant B | 3,917,129 | 666,817 |
| Events in quadrant C | 3,702,160 | 626,759 |
| Events in quadrant D | 5,597,804 | 601,912 |
| Mode SS | |||
|---|---|---|---|
| Quadrant | BADHDUFLAG | Total packets | Discarded packets |
| A | 0 | 144 | 0 |
| B | 0 | 144 | 0 |
| C | 0 | 144 | 0 |
| D | 0 | 144 | 0 |
| Mode M0 | |||
|---|---|---|---|
| Quadrant | BADHDUFLAG | Total packets | Discarded packets |
| A | 0 | 15788 | 2 |
| B | 0 | 16074 | 2 |
| C | 0 | 15298 | 2 |
| D | 0 | 21138 | 2 |
| Mode M9 | |||
|---|---|---|---|
| Quadrant | BADHDUFLAG | Total packets | Discarded packets |
| A | 0 | 24 | 0 |
| B | 0 | 24 | 0 |
| C | 0 | 24 | 0 |
| D | 0 | 24 | 0 |
| Quadrant | Total seconds | Saturated seconds | Saturation percentage |
|---|---|---|---|
| A | 6891 | 133 | 1.930054% |
| B | 6892 | 143 | 2.074869% |
| C | 6892 | 120 | 1.741149% |
| D | 6892 | 611 | 8.865351% |
Noise dominated data is calculated using 1-second bins in cleaned event files. If a bin has >2000 counts, and if more than 50% of those come from <1% of pixels, then it is considered to be noise-dominated and hence unusable.
| Quadrant | # 1 sec bins | Bins with >0 counts | Bins with >2000 counts | High rate bins dominated by noise | Noise dominated (total time) | Noise dominated (detector-on time) | Marked lightcurve |
|---|---|---|---|---|---|---|---|
| A | 9306 | 6891 | 3 | 3 | 0.03% | 0.04% | 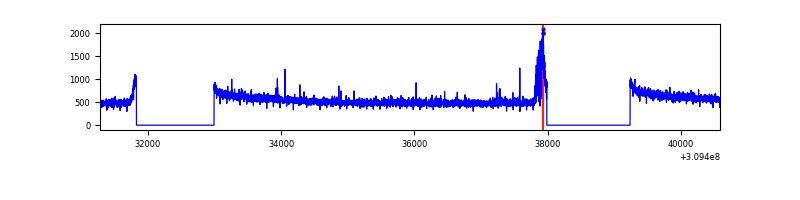 |
| B | 9307 | 6892 | 14 | 14 | 0.15% | 0.20% | 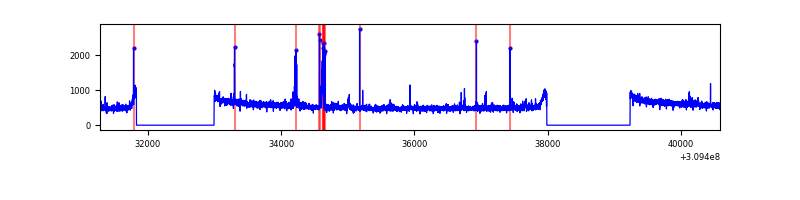 |
| C | 9307 | 6892 | 0 | 0 | 0.00% | 0.00% | 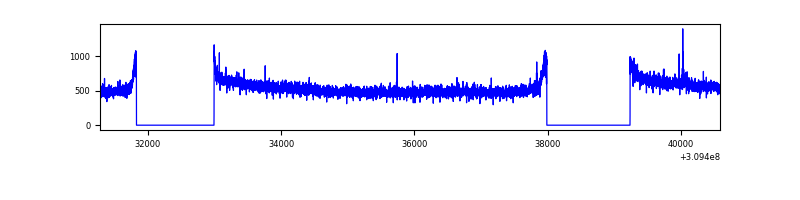 |
| D | 9307 | 6892 | 530 | 530 | 5.69% | 7.69% |  |
Top three noisy pixels from each quadrant. If the there are fewer than three noisy pixels in the level2.evt file, extra rows are filled as -1
| Pixel properties | Quadrant properties | ||||||
|---|---|---|---|---|---|---|---|
| Quadrant | DetID | PixID | Counts | Sigma | Mean | Median | Sigma |
| A | 14 | 235 | 70434 | 360.12 | 974 | 956 | 192.9 |
| A | 13 | 254 | 12445 | 59.55 | 974 | 956 | 192.9 |
| A | 2 | 79 | 9763 | 45.65 | 974 | 956 | 192.9 |
| B | 3 | 64 | 81744 | 451.17 | 963 | 943 | 179.1 |
| B | 0 | 230 | 31073 | 168.24 | 963 | 943 | 179.1 |
| B | 12 | 111 | 21309 | 113.72 | 963 | 943 | 179.1 |
| C | 14 | 238 | 144668 | 688.08 | 908 | 919 | 208.9 |
| C | 9 | 54 | 13277 | 59.15 | 908 | 919 | 208.9 |
| C | 13 | 61 | 6417 | 26.32 | 908 | 919 | 208.9 |
| D | 1 | 52 | 1232222 | 5578.32 | 906 | 881 | 220.7 |
| D | 7 | 223 | 420764 | 1902.19 | 906 | 881 | 220.7 |
| D | 7 | 238 | 189131 | 852.83 | 906 | 881 | 220.7 |
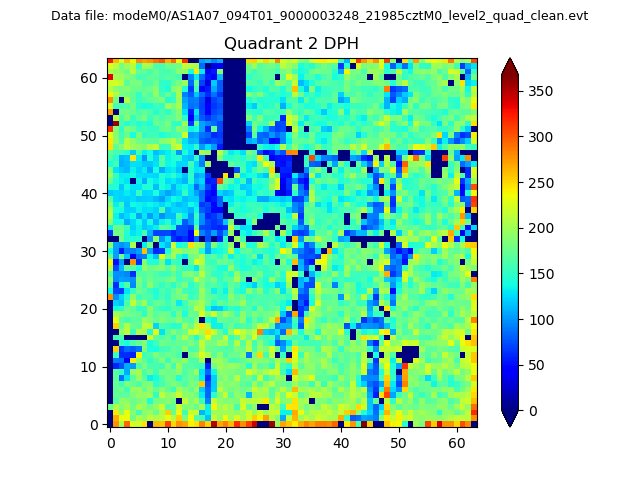
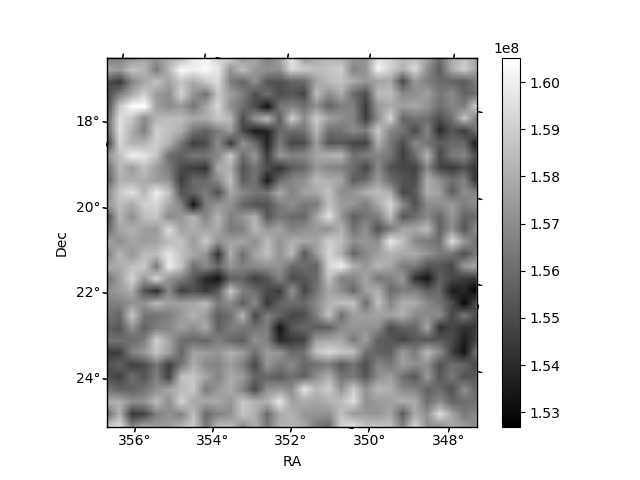
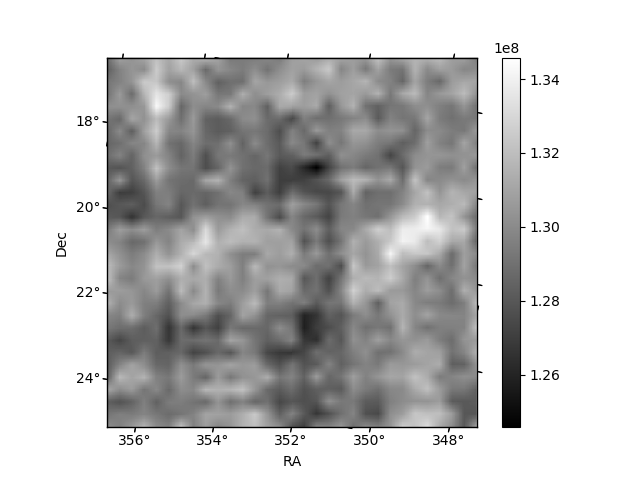
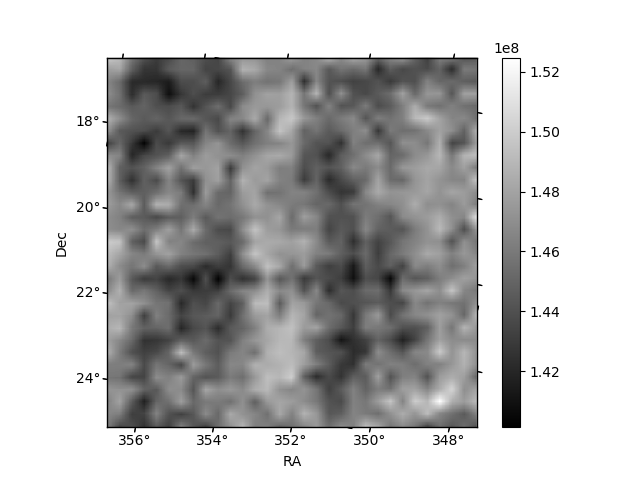
Histogram calculated using DETX and DETY for each event in the final _common_clean file
| Quadrant A |  |
 |
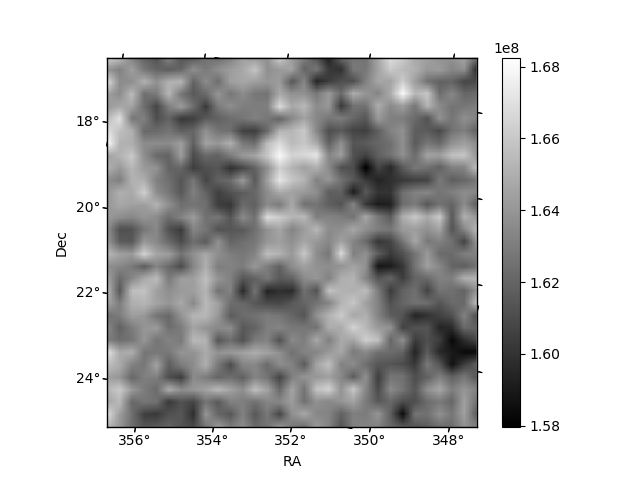
Quadrant B |
|---|---|---|---|
| Quadrant D | 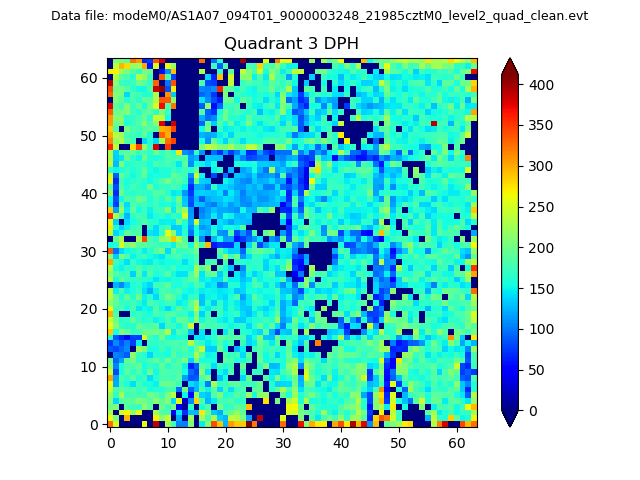 |
 |
Quadrant C |
| Plot type | Count rate plots | Images |
|---|---|---|
| Comparison with Poisson distribution Blue bars denote a histogram of data divided into 1 sec bins. Red curve is a Poisson curve with rate = median count rate of data. |
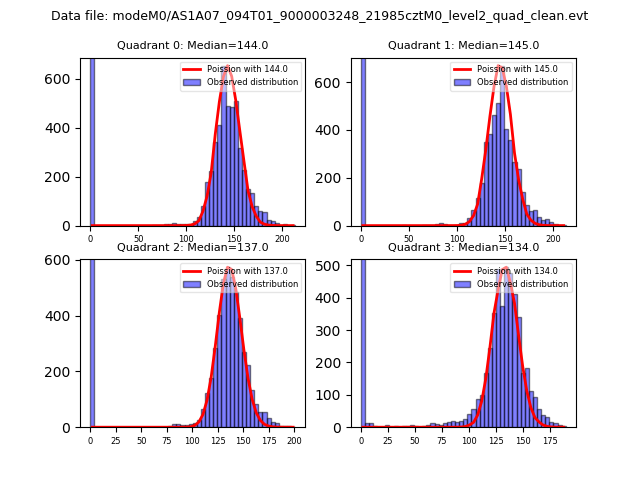 |
 |
| Quadrant-wise count rates Data is divided into 100 sec bins |
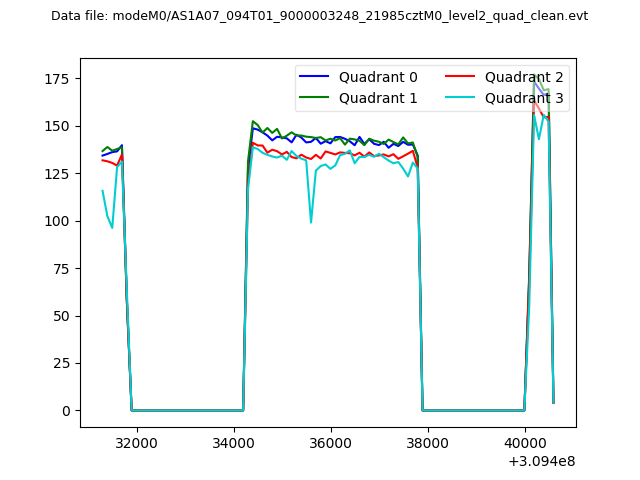 |
|
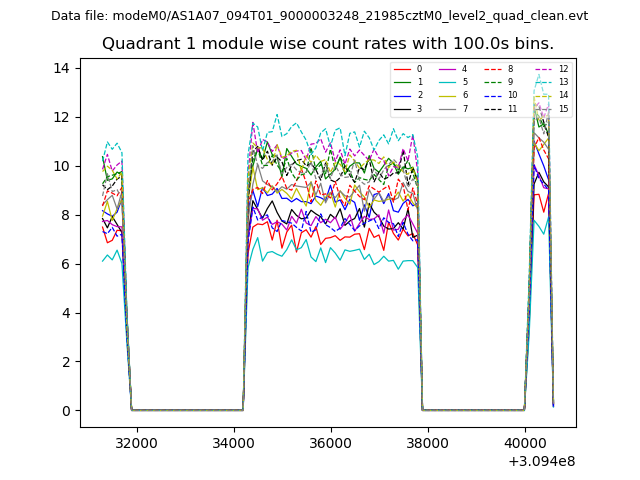
| Module-wise count rates for Quadrant A Data is divided into 100 sec bins |
 |
 |
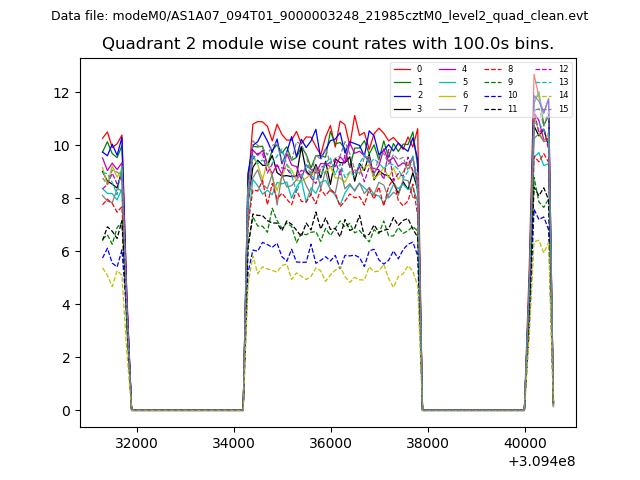
| Module-wise count rates for Quadrant B Data is divided into 100 sec bins |
 |
 |
| Module-wise count rates for Quadrant C Data is divided into 100 sec bins |
 |
 |
| Module-wise count rates for Quadrant D Data is divided into 100 sec bins |
 |
 |
| Parameter | Plot |
|---|---|
| CZT HV Monitor | 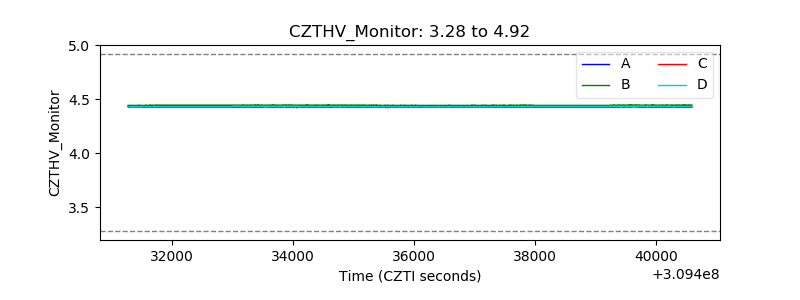 |
| D_VDD | 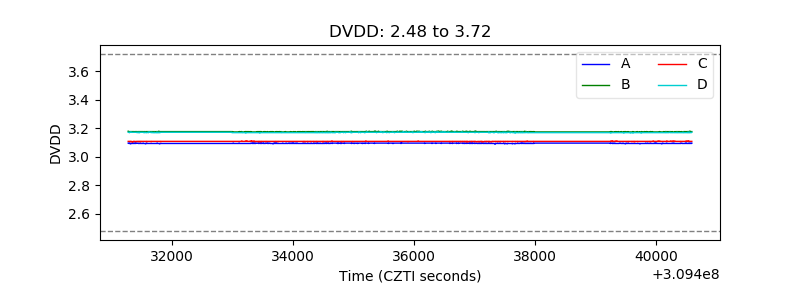 |
| Temperature 1 | 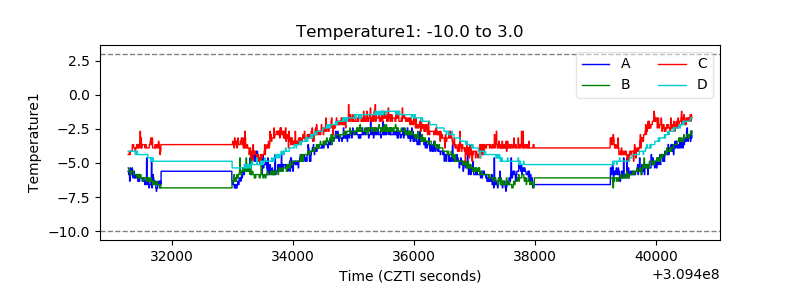 |
| Veto HV Monitor | 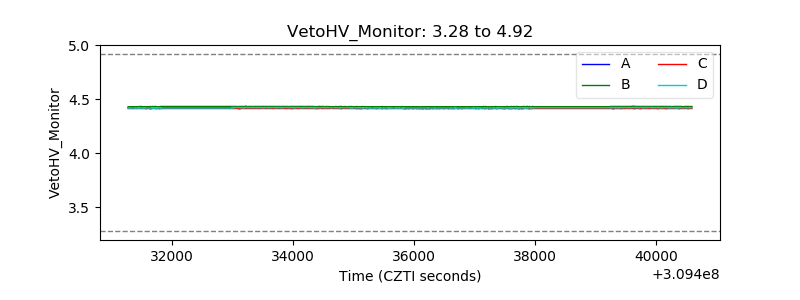 |
| Veto LLD | 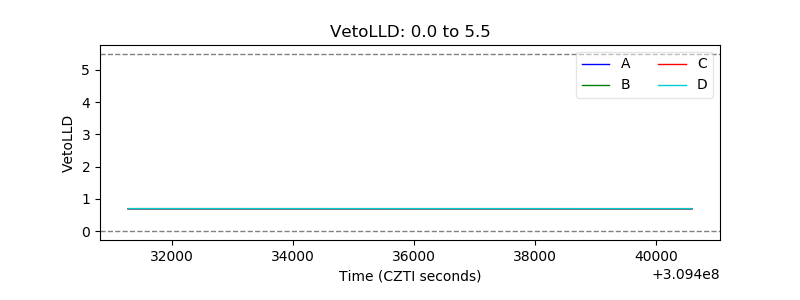 |
| Alpha Counter | 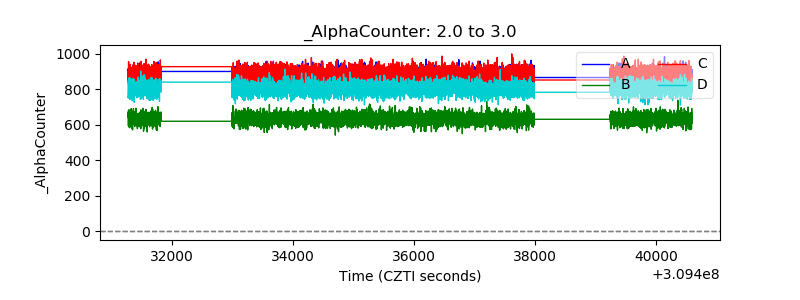 |
| _CPM_Rate | 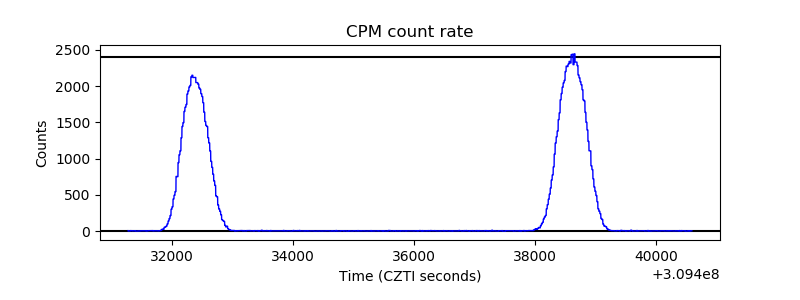 |
| CZT Counter | 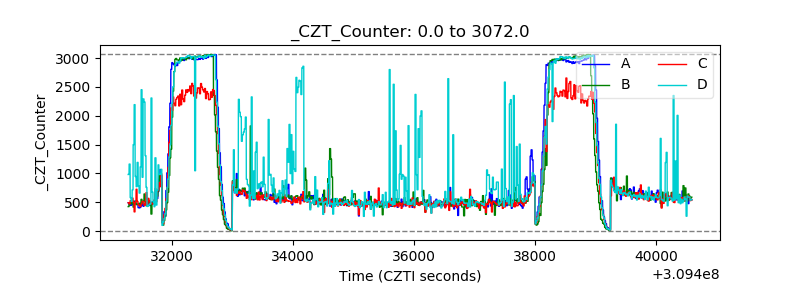 |
| +2.5 Volts monitor | 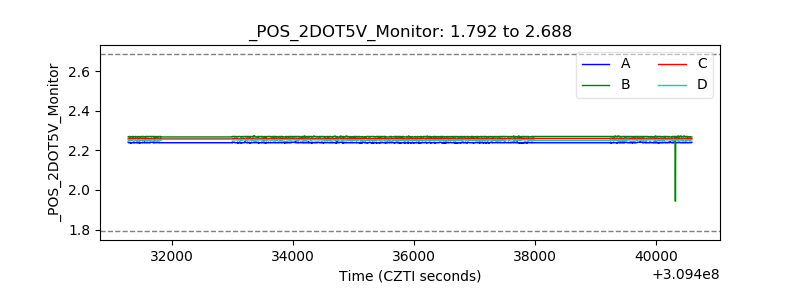 |
| +5 Volts monitor |  |
| _ROLL_ROT | 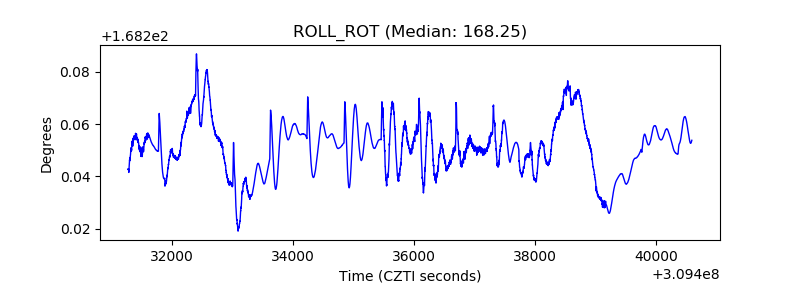 |
| _Roll_DEC | 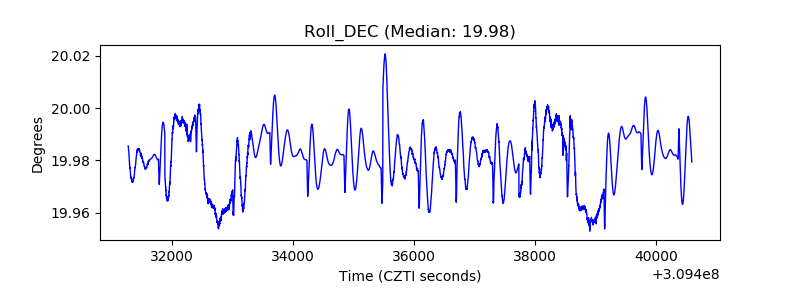 |
| _Roll_RA | 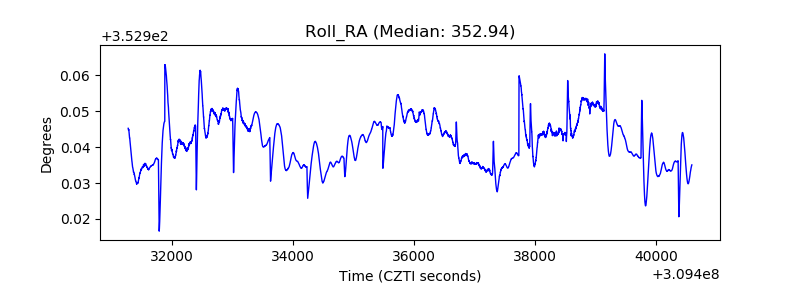 |
| Veto Counter | 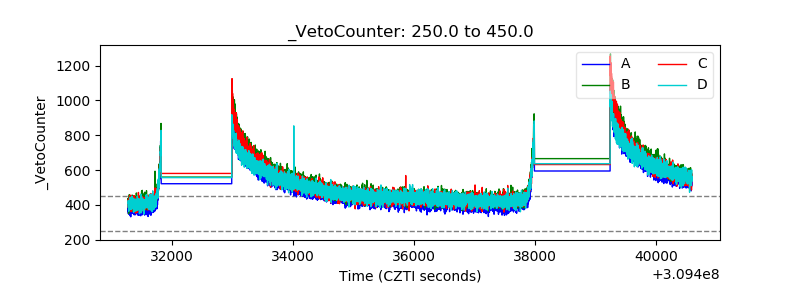 |