| Param | Original file | Final file |
|---|---|---|
| Filename | modeM0/AS1A07_094T01_9000003248_21986cztM0_level2.evt | modeM0/AS1A07_094T01_9000003248_21986cztM0_level2_quad_clean.evt |
| Size (bytes) | 500,425,920 | 103,968,000 |
| Size | 477.2 MB | 99.2 MB |
| Events in quadrant A | 3,663,749 | 700,053 |
| Events in quadrant B | 3,800,341 | 703,400 |
| Events in quadrant C | 3,499,558 | 652,809 |
| Events in quadrant D | 3,764,015 | 652,651 |
| Mode SS | |||
|---|---|---|---|
| Quadrant | BADHDUFLAG | Total packets | Discarded packets |
| A | 0 | 128 | 0 |
| B | 0 | 128 | 0 |
| C | 0 | 128 | 0 |
| D | 0 | 128 | 0 |
| Mode M0 | |||
|---|---|---|---|
| Quadrant | BADHDUFLAG | Total packets | Discarded packets |
| A | 0 | 15022 | 2 |
| B | 0 | 15514 | 2 |
| C | 0 | 14382 | 2 |
| D | 0 | 15162 | 4 |
| Mode M9 | |||
|---|---|---|---|
| Quadrant | BADHDUFLAG | Total packets | Discarded packets |
| A | 0 | 22 | 0 |
| B | 0 | 23 | 0 |
| C | 0 | 23 | 0 |
| D | 0 | 23 | 0 |
| Quadrant | Total seconds | Saturated seconds | Saturation percentage |
|---|---|---|---|
| A | 6302 | 129 | 2.046969% |
| B | 6302 | 148 | 2.348461% |
| C | 6302 | 145 | 2.300857% |
| D | 6301 | 202 | 3.205840% |
Noise dominated data is calculated using 1-second bins in cleaned event files. If a bin has >2000 counts, and if more than 50% of those come from <1% of pixels, then it is considered to be noise-dominated and hence unusable.
| Quadrant | # 1 sec bins | Bins with >0 counts | Bins with >2000 counts | High rate bins dominated by noise | Noise dominated (total time) | Noise dominated (detector-on time) | Marked lightcurve |
|---|---|---|---|---|---|---|---|
| A | 7612 | 6302 | 1 | 1 | 0.01% | 0.02% | 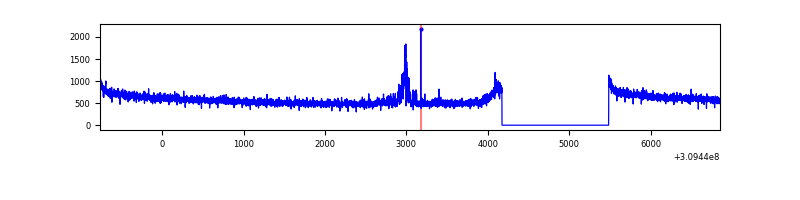 |
| B | 7612 | 6302 | 16 | 16 | 0.21% | 0.25% | 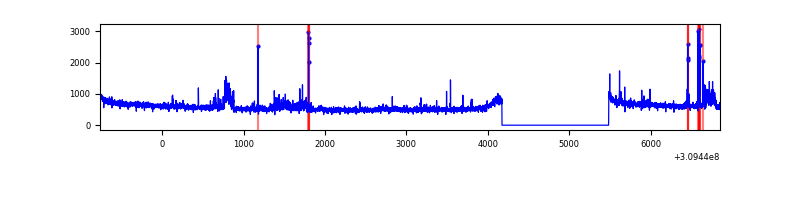 |
| C | 7612 | 6302 | 0 | 0 | 0.00% | 0.00% | 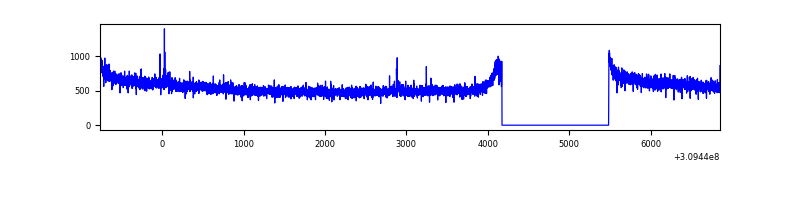 |
| D | 7611 | 6301 | 103 | 103 | 1.35% | 1.63% | 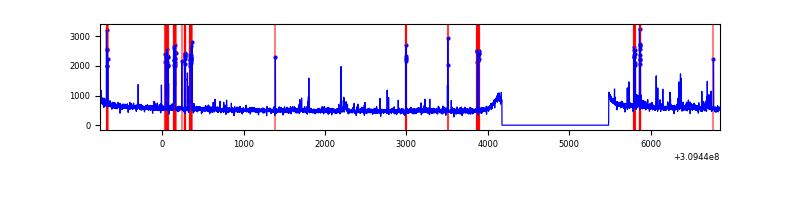 |
Top three noisy pixels from each quadrant. If the there are fewer than three noisy pixels in the level2.evt file, extra rows are filled as -1
| Pixel properties | Quadrant properties | ||||||
|---|---|---|---|---|---|---|---|
| Quadrant | DetID | PixID | Counts | Sigma | Mean | Median | Sigma |
| A | 14 | 235 | 75533 | 405.98 | 928 | 913 | 183.8 |
| A | 15 | 236 | 12463 | 62.84 | 928 | 913 | 183.8 |
| A | 13 | 254 | 11099 | 55.42 | 928 | 913 | 183.8 |
| B | 0 | 197 | 93493 | 553.69 | 905 | 889 | 167.2 |
| B | 3 | 64 | 84246 | 498.41 | 905 | 889 | 167.2 |
| B | 0 | 230 | 84010 | 496.99 | 905 | 889 | 167.2 |
| C | 14 | 238 | 137654 | 699.58 | 856 | 865 | 195.5 |
| C | 9 | 54 | 20872 | 102.32 | 856 | 865 | 195.5 |
| C | 13 | 61 | 6029 | 26.41 | 856 | 865 | 195.5 |
| D | 7 | 223 | 262523 | 1231.8 | 883 | 860 | 212.4 |
| D | 7 | 238 | 59475 | 275.93 | 883 | 860 | 212.4 |
| D | 1 | 52 | 53438 | 247.51 | 883 | 860 | 212.4 |
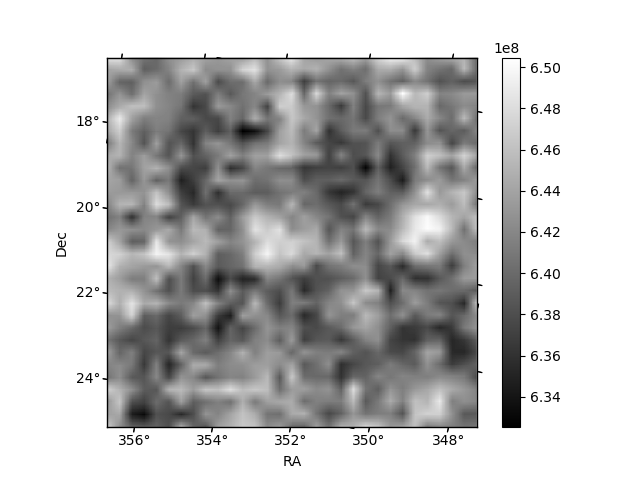
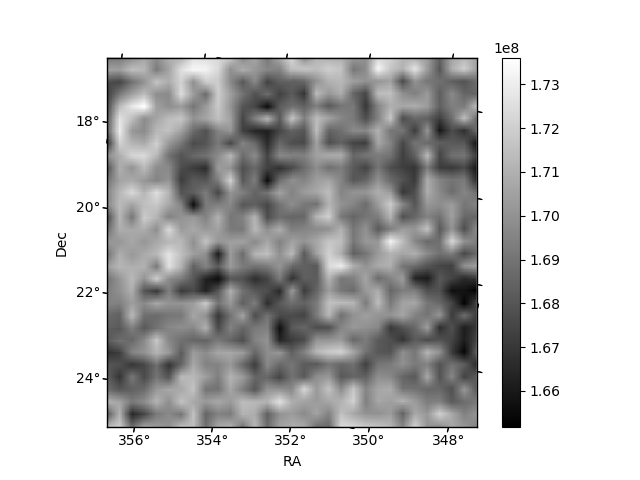
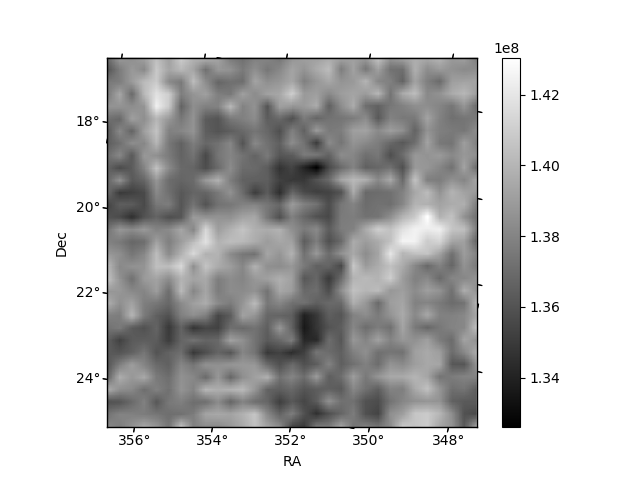
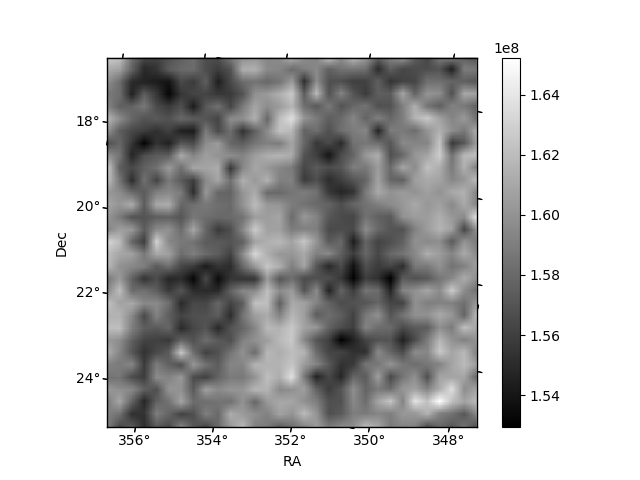
Histogram calculated using DETX and DETY for each event in the final _common_clean file
| Quadrant A | 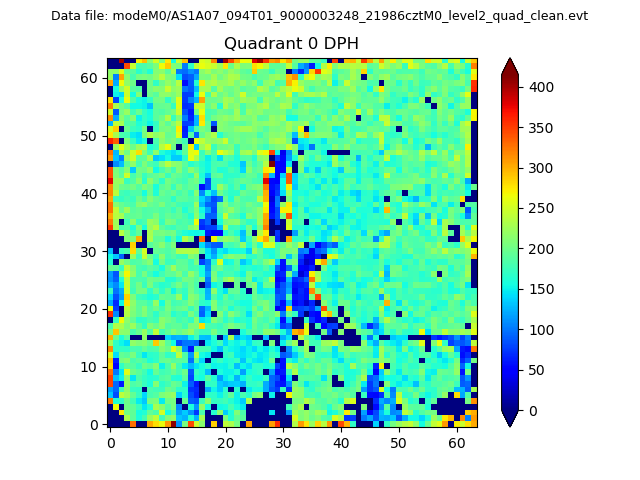 |
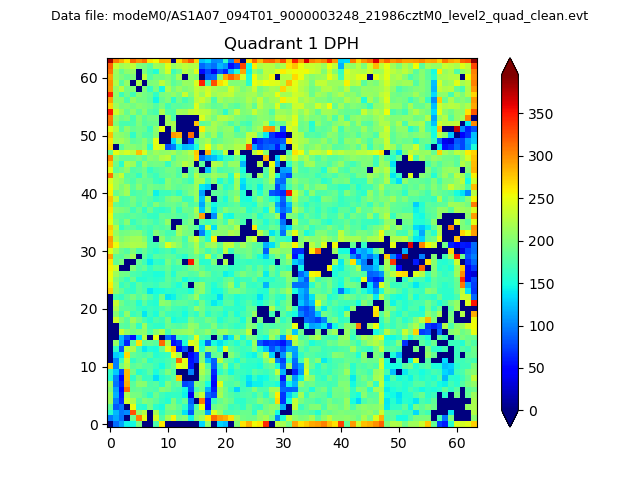 |
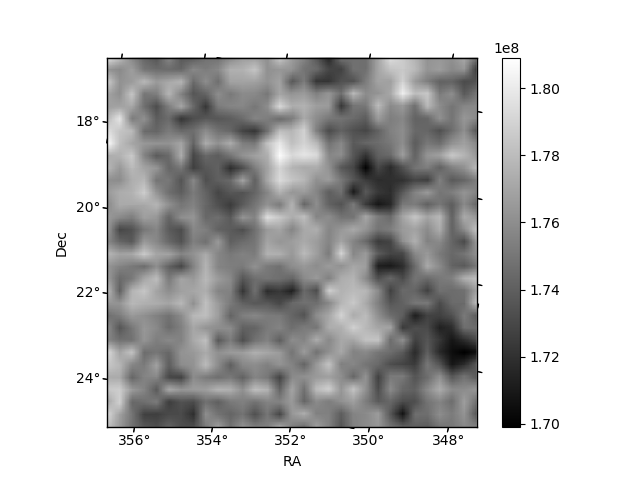
Quadrant B |
|---|---|---|---|
| Quadrant D | 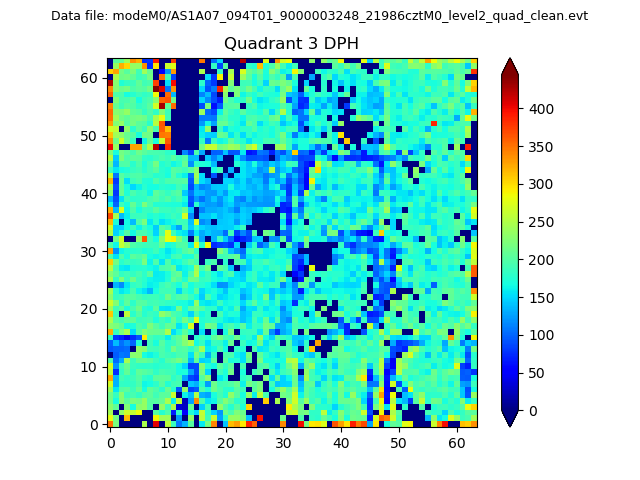 |
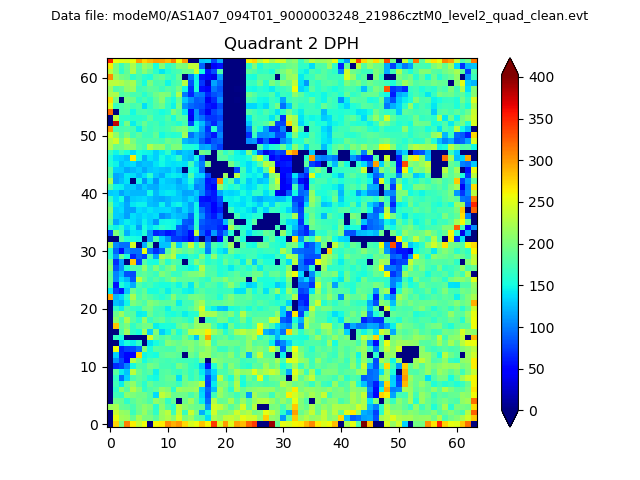 |
Quadrant C |
| Plot type | Count rate plots | Images |
|---|---|---|
| Comparison with Poisson distribution Blue bars denote a histogram of data divided into 1 sec bins. Red curve is a Poisson curve with rate = median count rate of data. |
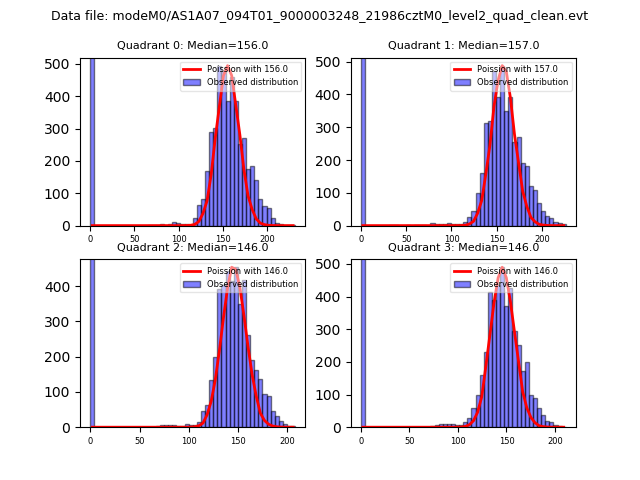 |
 |
| Quadrant-wise count rates Data is divided into 100 sec bins |
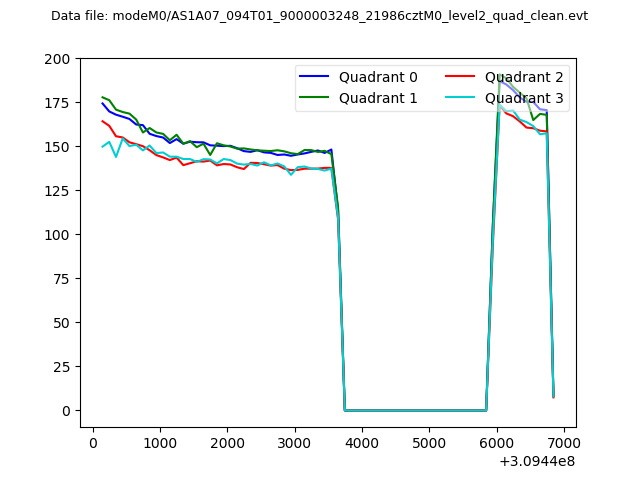 |
|
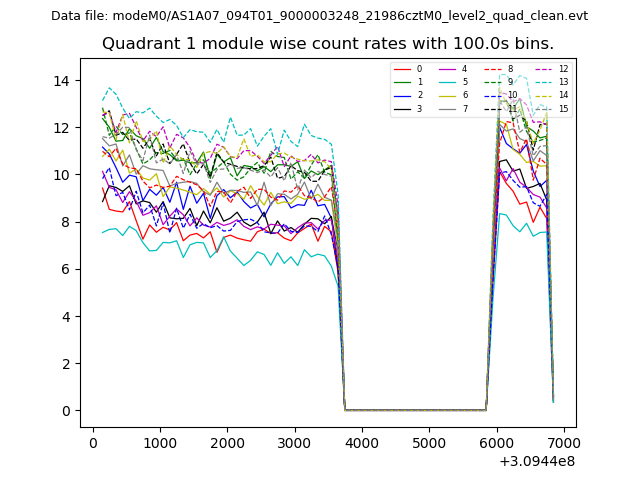
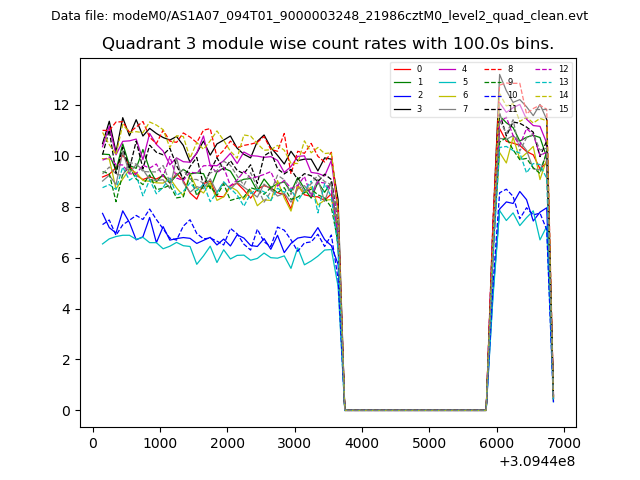
| Module-wise count rates for Quadrant A Data is divided into 100 sec bins |
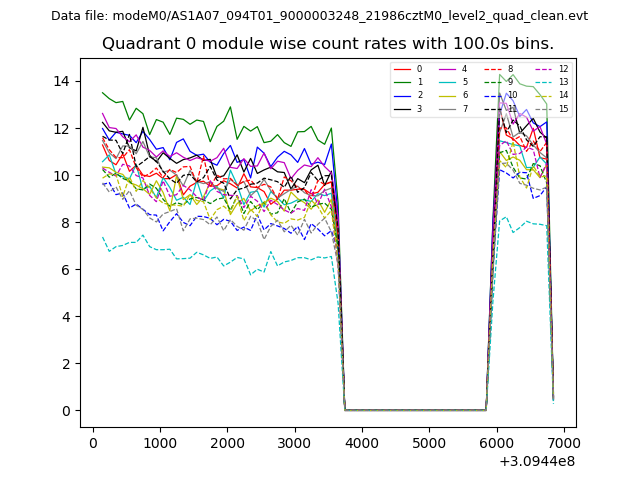 |
 |
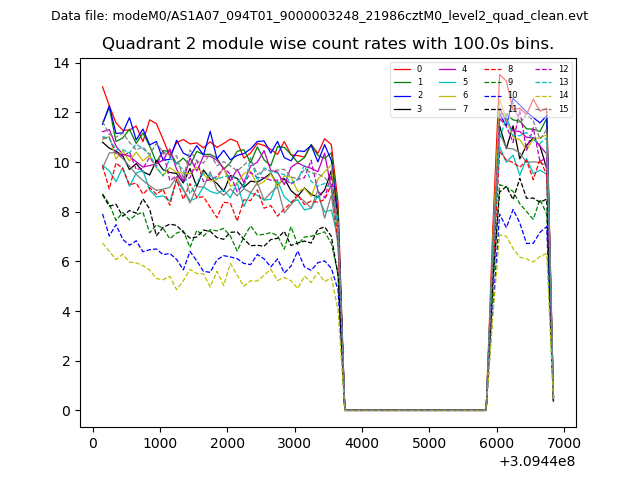
| Module-wise count rates for Quadrant B Data is divided into 100 sec bins |
 |
 |
| Module-wise count rates for Quadrant C Data is divided into 100 sec bins |
 |
 |
| Module-wise count rates for Quadrant D Data is divided into 100 sec bins |
 |
 |
| Parameter | Plot |
|---|---|
| CZT HV Monitor | 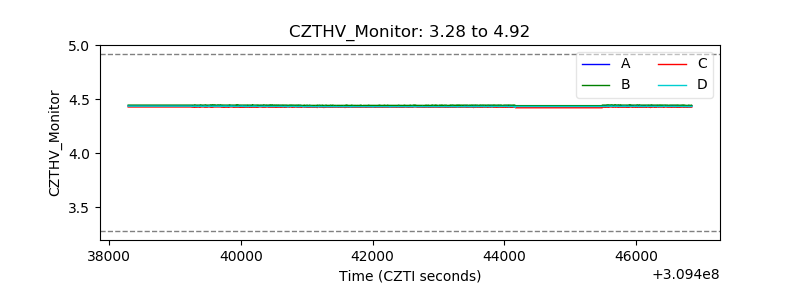 |
| D_VDD | 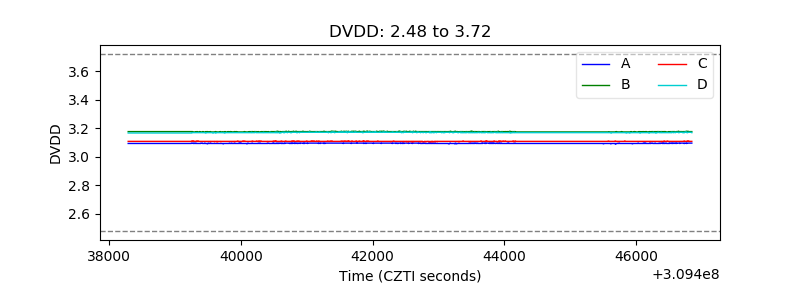 |
| Temperature 1 | 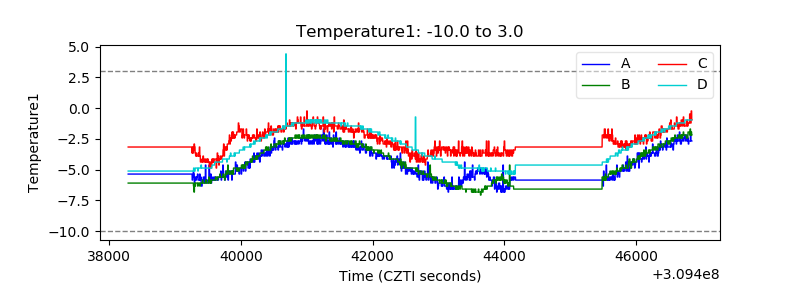 |
| Veto HV Monitor | 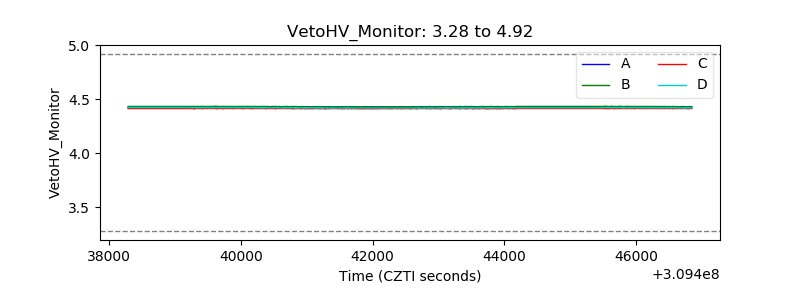 |
| Veto LLD | 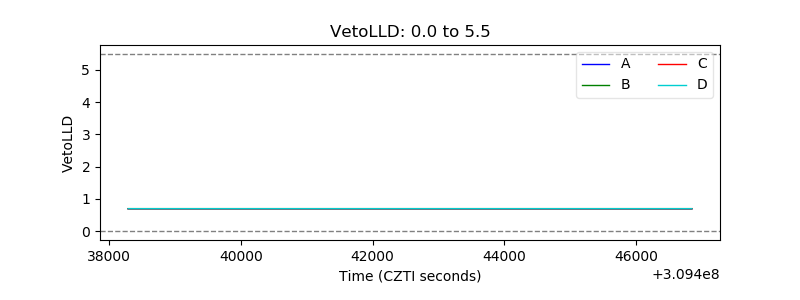 |
| Alpha Counter | 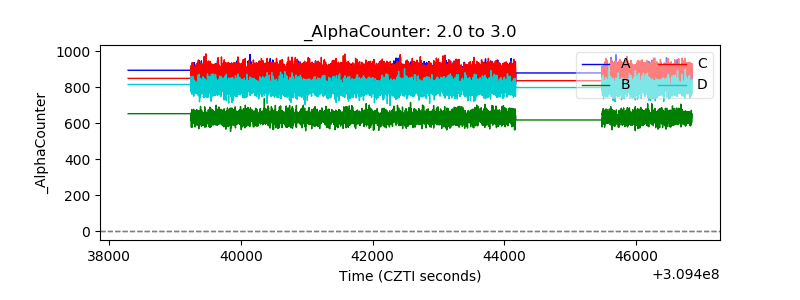 |
| _CPM_Rate | 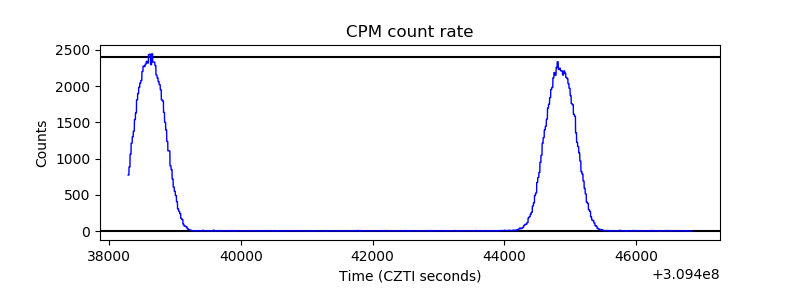 |
| CZT Counter | 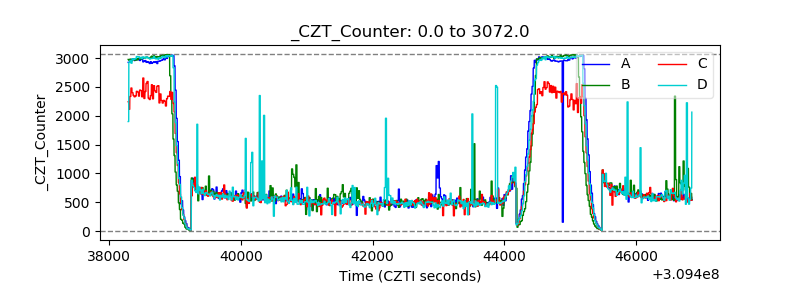 |
| +2.5 Volts monitor |  |
| +5 Volts monitor | 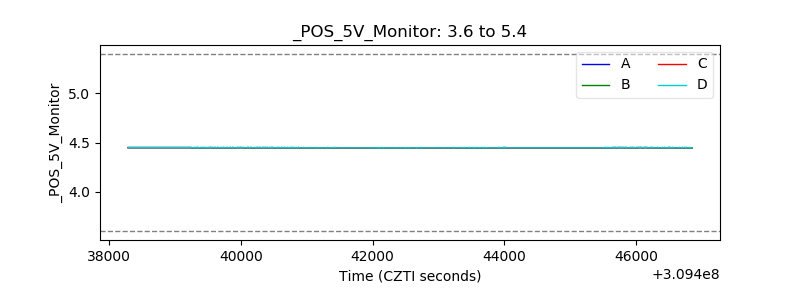 |
| _ROLL_ROT | 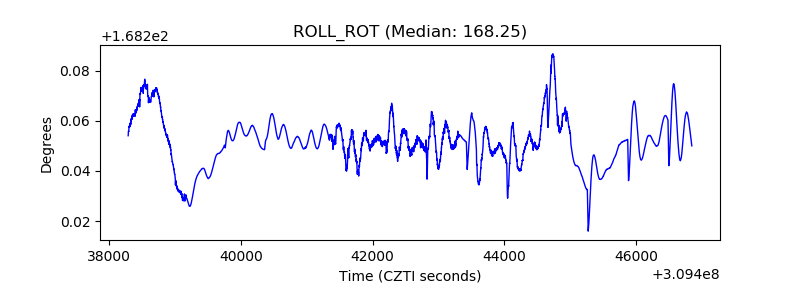 |
| _Roll_DEC | 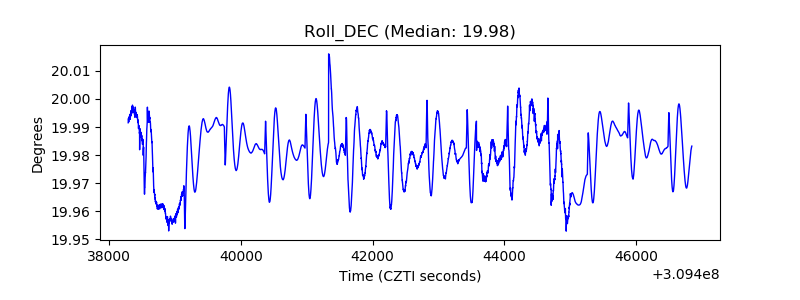 |
| _Roll_RA | 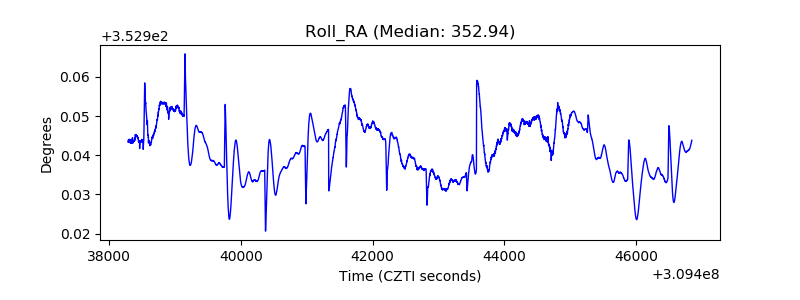 |
| Veto Counter | 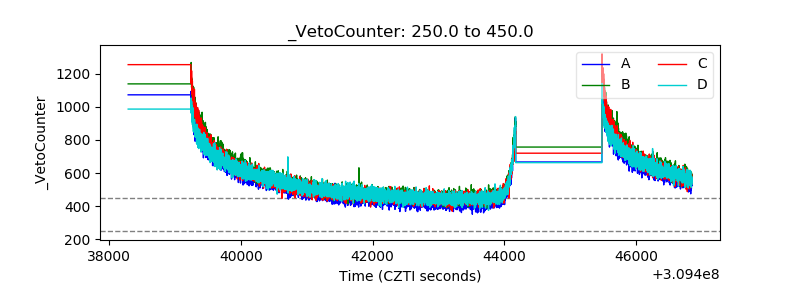 |