| Param | Original file | Final file |
|---|---|---|
| Filename | modeM0/AS1A07_094T01_9000003248_21991cztM0_level2.evt | modeM0/AS1A07_094T01_9000003248_21991cztM0_level2_quad_clean.evt |
| Size (bytes) | 538,931,520 | 104,434,560 |
| Size | 514.0 MB | 99.6 MB |
| Events in quadrant A | 3,608,792 | 678,784 |
| Events in quadrant B | 3,903,682 | 677,822 |
| Events in quadrant C | 3,583,212 | 654,982 |
| Events in quadrant D | 4,723,500 | 635,858 |
| Mode SS | |||
|---|---|---|---|
| Quadrant | BADHDUFLAG | Total packets | Discarded packets |
| A | 0 | 150 | 0 |
| B | 0 | 150 | 0 |
| C | 0 | 150 | 0 |
| D | 0 | 150 | 0 |
| Mode M0 | |||
|---|---|---|---|
| Quadrant | BADHDUFLAG | Total packets | Discarded packets |
| A | 0 | 15519 | 3 |
| B | 0 | 16360 | 3 |
| C | 0 | 15389 | 3 |
| D | 0 | 19020 | 3 |
| Mode M9 | |||
|---|---|---|---|
| Quadrant | BADHDUFLAG | Total packets | Discarded packets |
| A | 0 | 4 | 0 |
| B | 0 | 5 | 0 |
| C | 0 | 5 | 0 |
| D | 0 | 5 | 0 |
| Quadrant | Total seconds | Saturated seconds | Saturation percentage |
|---|---|---|---|
| A | 7403 | 65 | 0.878022% |
| B | 7403 | 163 | 2.201810% |
| C | 7403 | 127 | 1.715521% |
| D | 7403 | 245 | 3.309469% |
Noise dominated data is calculated using 1-second bins in cleaned event files. If a bin has >2000 counts, and if more than 50% of those come from <1% of pixels, then it is considered to be noise-dominated and hence unusable.
| Quadrant | # 1 sec bins | Bins with >0 counts | Bins with >2000 counts | High rate bins dominated by noise | Noise dominated (total time) | Noise dominated (detector-on time) | Marked lightcurve |
|---|---|---|---|---|---|---|---|
| A | 7638 | 7405 | 0 | 0 | 0.00% | 0.00% | 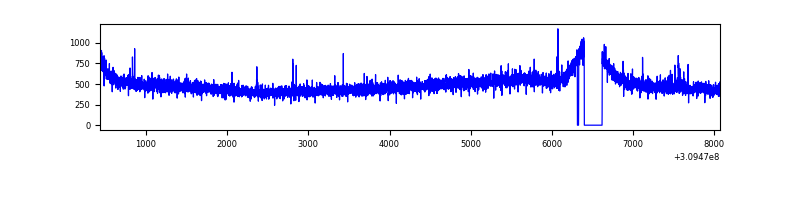 |
| B | 7638 | 7404 | 29 | 29 | 0.38% | 0.39% | 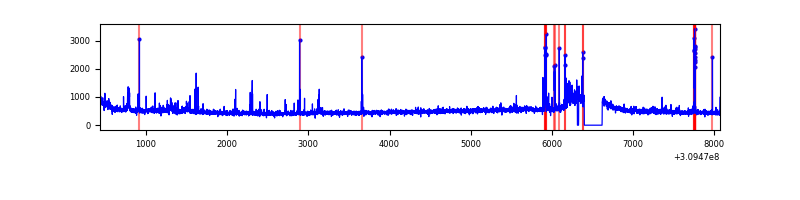 |
| C | 7638 | 7404 | 0 | 0 | 0.00% | 0.00% | 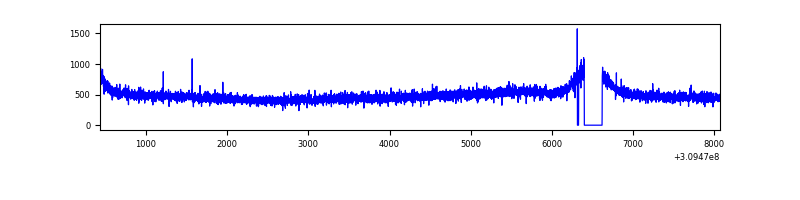 |
| D | 7638 | 7405 | 155 | 155 | 2.03% | 2.09% | 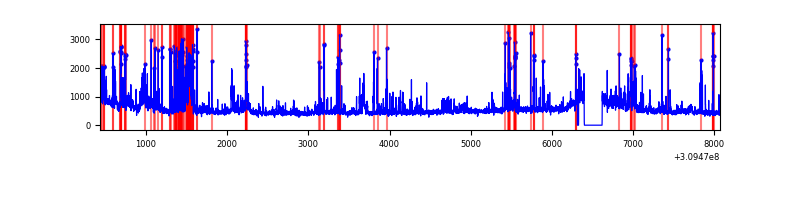 |
Top three noisy pixels from each quadrant. If the there are fewer than three noisy pixels in the level2.evt file, extra rows are filled as -1
| Pixel properties | Quadrant properties | ||||||
|---|---|---|---|---|---|---|---|
| Quadrant | DetID | PixID | Counts | Sigma | Mean | Median | Sigma |
| A | 2 | 79 | 22528 | 116.23 | 924 | 903 | 186.1 |
| A | 13 | 254 | 13472 | 67.56 | 924 | 903 | 186.1 |
| A | 14 | 235 | 11696 | 58.01 | 924 | 903 | 186.1 |
| B | 3 | 64 | 153273 | 861.02 | 916 | 892 | 177.0 |
| B | 0 | 230 | 82744 | 462.5 | 916 | 892 | 177.0 |
| B | 0 | 190 | 29835 | 163.54 | 916 | 892 | 177.0 |
| C | 14 | 238 | 138559 | 660.19 | 882 | 885 | 208.5 |
| C | 13 | 61 | 6091 | 24.96 | 882 | 885 | 208.5 |
| C | 8 | 128 | 3899 | 14.45 | 882 | 885 | 208.5 |
| D | 1 | 52 | 740617 | 3402.13 | 892 | 866 | 217.4 |
| D | 13 | 104 | 241245 | 1105.51 | 892 | 866 | 217.4 |
| D | 7 | 238 | 137722 | 629.4 | 892 | 866 | 217.4 |
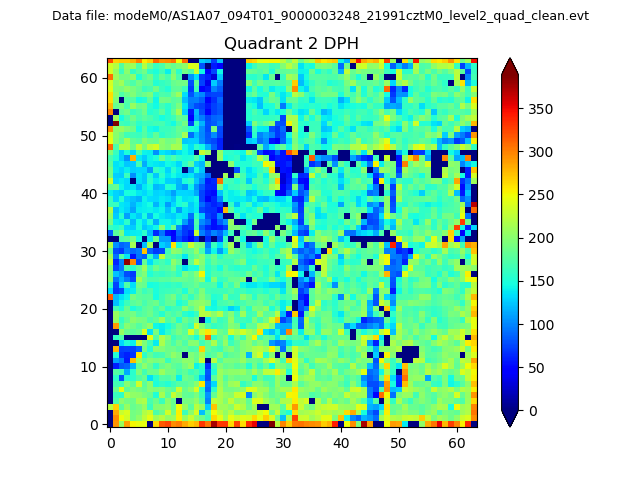
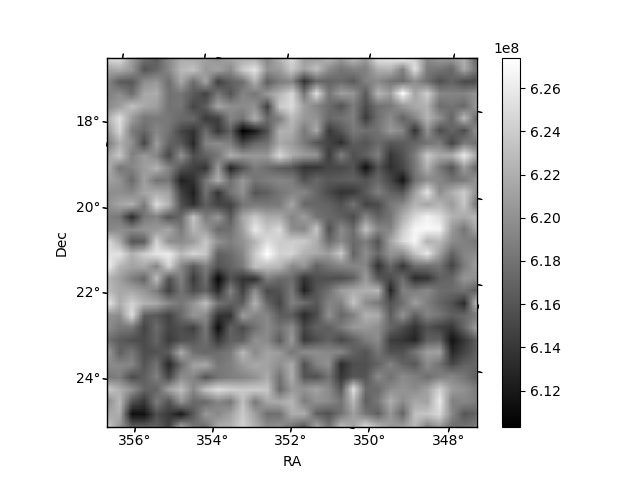
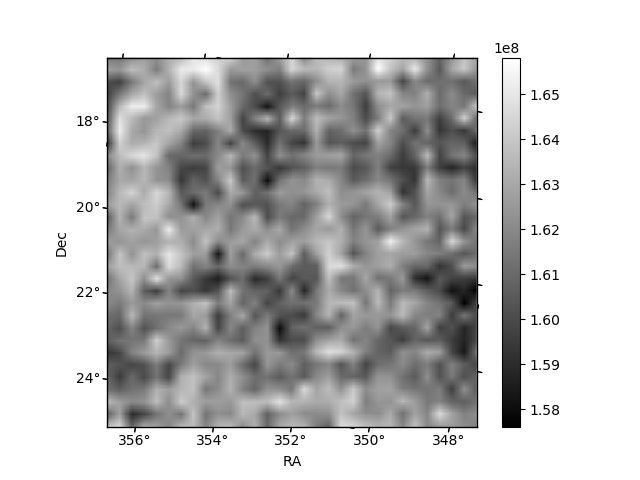
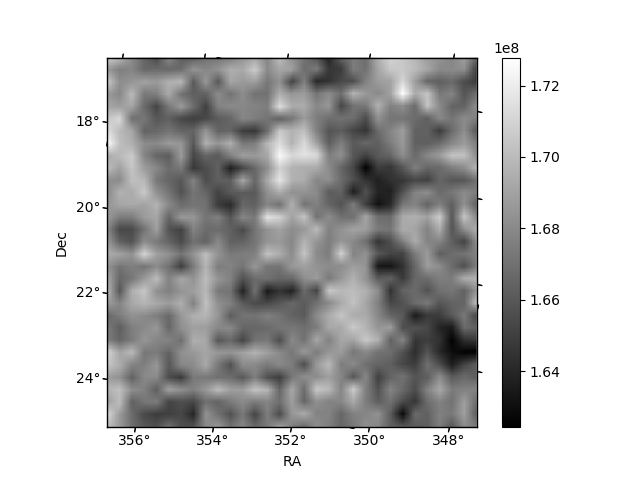
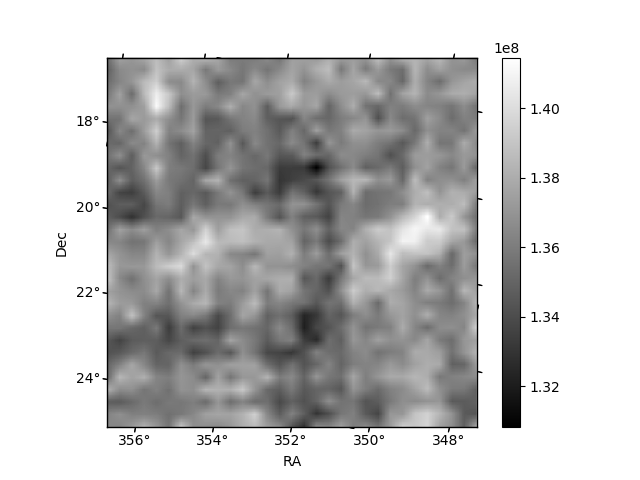
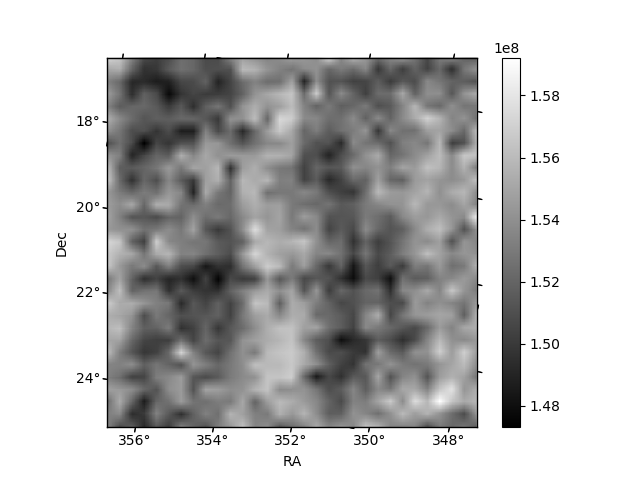
Histogram calculated using DETX and DETY for each event in the final _common_clean file
| Quadrant A | 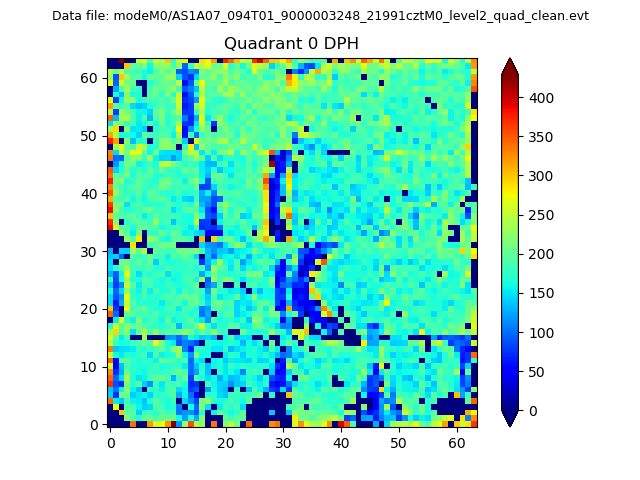 |
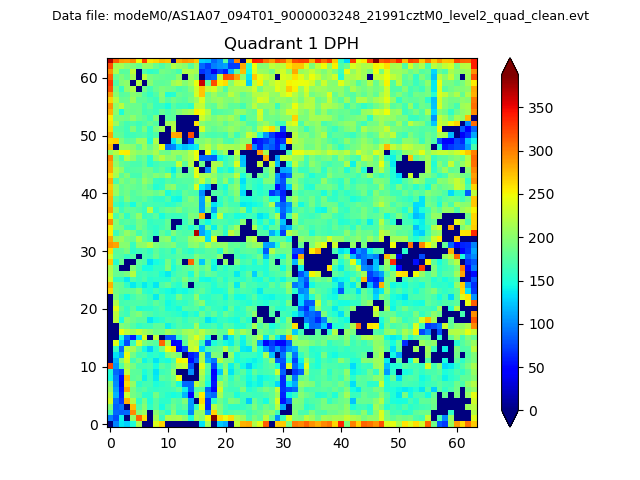 |
Quadrant B |
|---|---|---|---|
| Quadrant D | 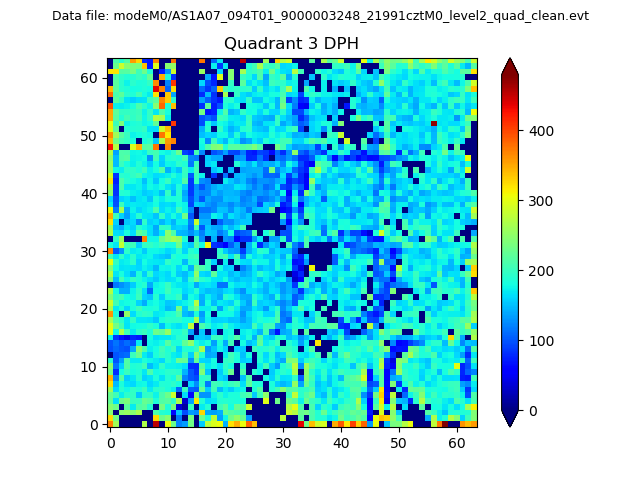 |
 |
Quadrant C |
| Plot type | Count rate plots | Images |
|---|---|---|
| Comparison with Poisson distribution Blue bars denote a histogram of data divided into 1 sec bins. Red curve is a Poisson curve with rate = median count rate of data. |
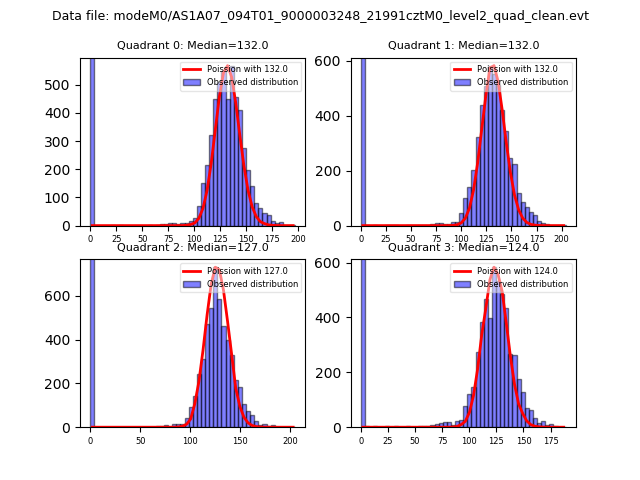 |
 |
| Quadrant-wise count rates Data is divided into 100 sec bins |
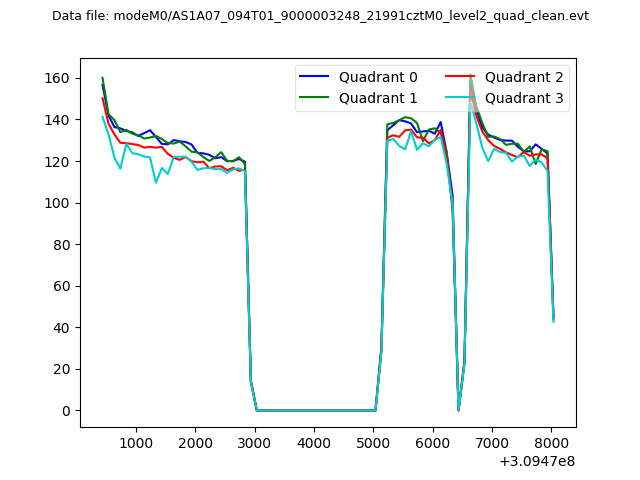 |
|
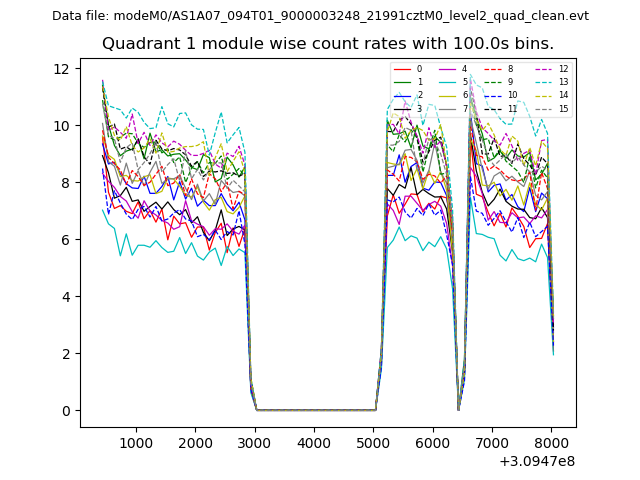
| Module-wise count rates for Quadrant A Data is divided into 100 sec bins |
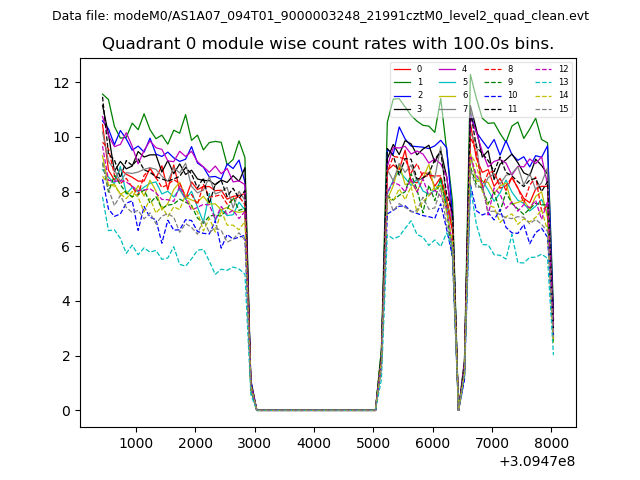 |
 |
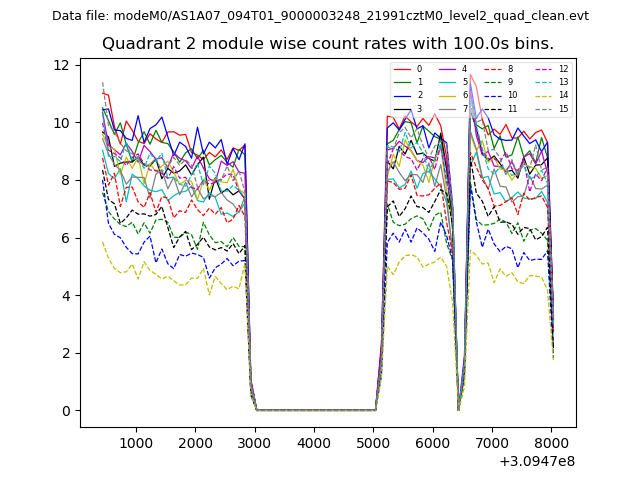
| Module-wise count rates for Quadrant B Data is divided into 100 sec bins |
 |
 |
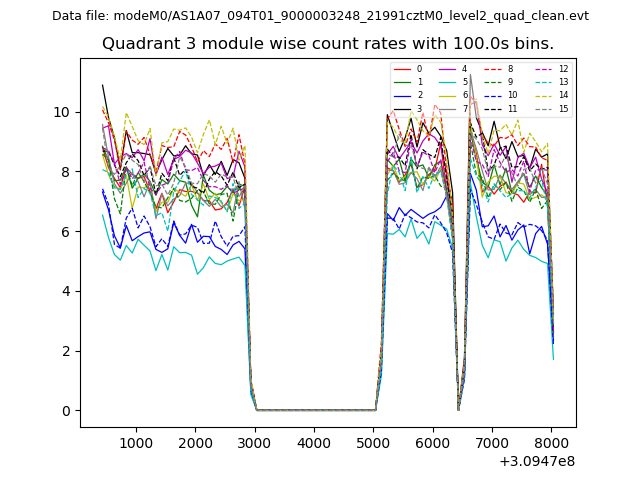
| Module-wise count rates for Quadrant C Data is divided into 100 sec bins |
 |
 |
| Module-wise count rates for Quadrant D Data is divided into 100 sec bins |
 |
 |
| Parameter | Plot |
|---|---|
| CZT HV Monitor | 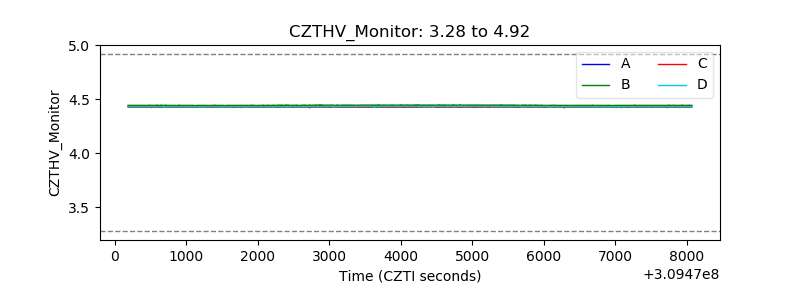 |
| D_VDD | 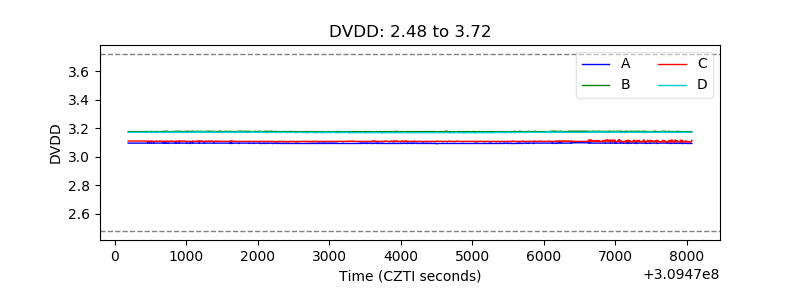 |
| Temperature 1 | 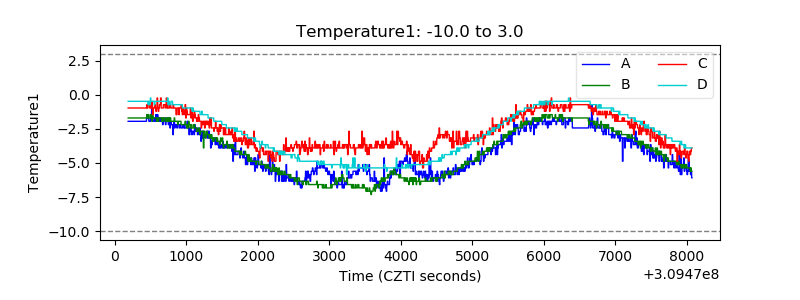 |
| Veto HV Monitor | 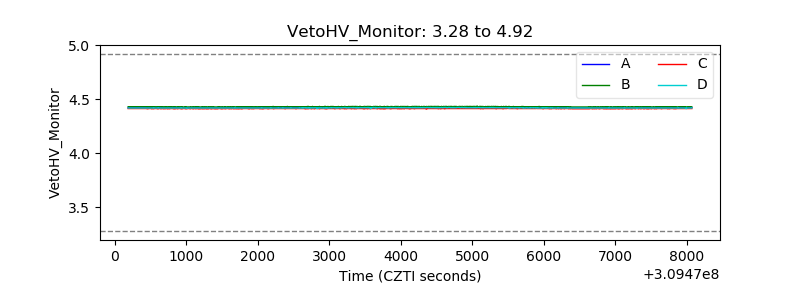 |
| Veto LLD | 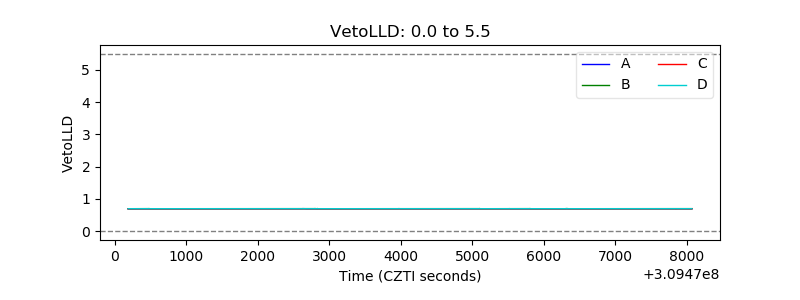 |
| Alpha Counter | 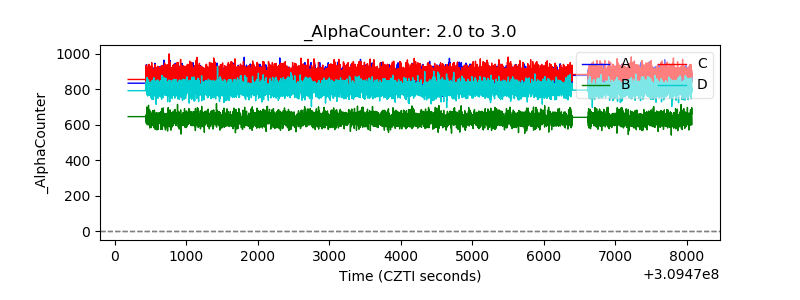 |
| _CPM_Rate | 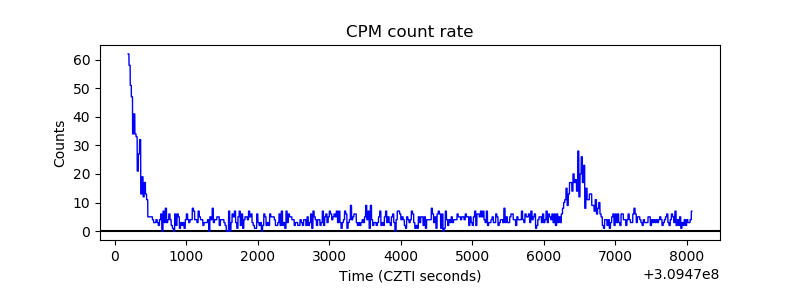 |
| CZT Counter | 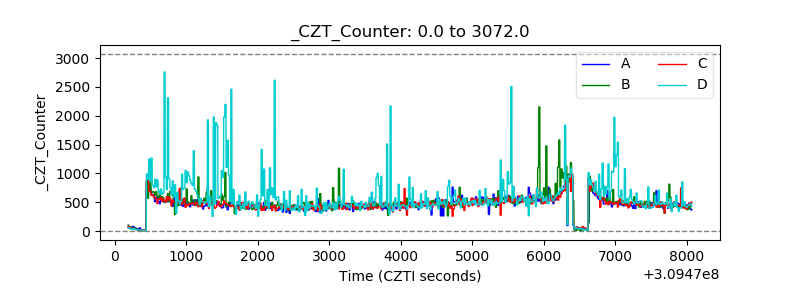 |
| +2.5 Volts monitor | 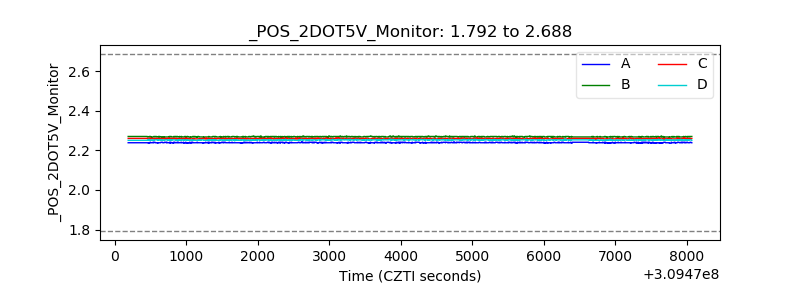 |
| +5 Volts monitor | 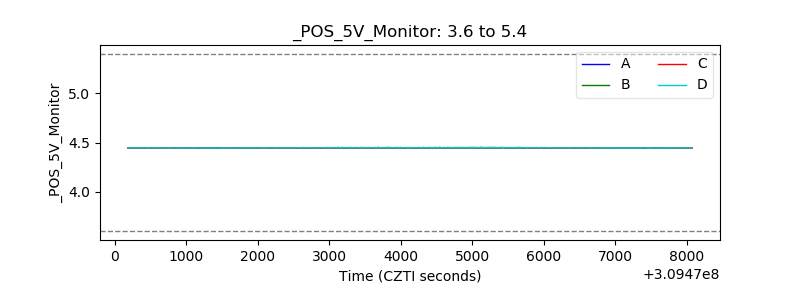 |
| _ROLL_ROT | 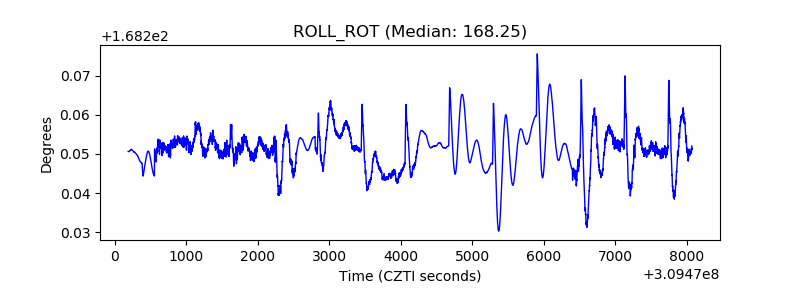 |
| _Roll_DEC |  |
| _Roll_RA | 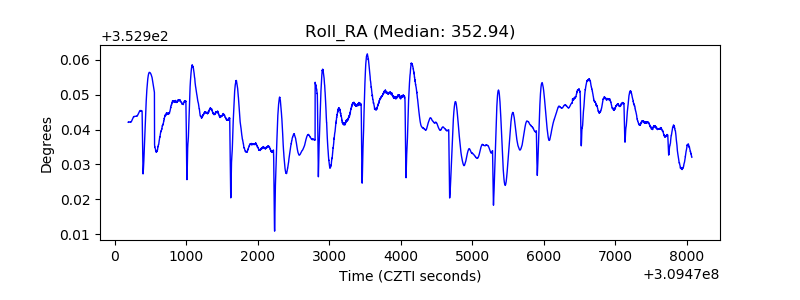 |
| Veto Counter | 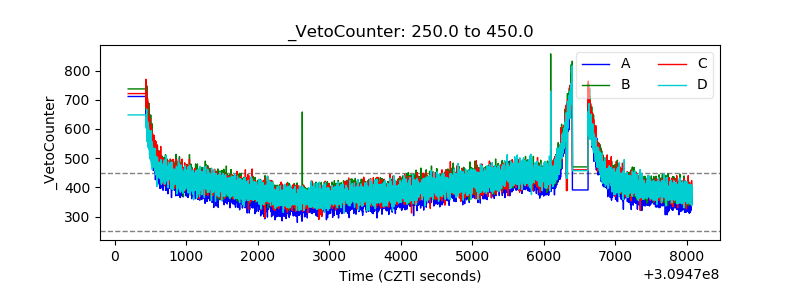 |