| Param | Original file | Final file |
|---|---|---|
| Filename | modeM0/AS1A07_094T01_9000003248_21995cztM0_level2.evt | modeM0/AS1A07_094T01_9000003248_21995cztM0_level2_quad_clean.evt |
| Size (bytes) | 1,455,791,040 | 223,476,480 |
| Size | 1.4 GB | 213.1 MB |
| Events in quadrant A | 8,902,561 | 1,403,660 |
| Events in quadrant B | 9,979,396 | 1,399,706 |
| Events in quadrant C | 8,949,755 | 1,358,899 |
| Events in quadrant D | 14,979,069 | 1,301,574 |
| Mode SS | |||
|---|---|---|---|
| Quadrant | BADHDUFLAG | Total packets | Discarded packets |
| A | 0 | 390 | 0 |
| B | 0 | 390 | 0 |
| C | 0 | 390 | 0 |
| D | 0 | 390 | 0 |
| Mode M0 | |||
|---|---|---|---|
| Quadrant | BADHDUFLAG | Total packets | Discarded packets |
| A | 0 | 38699 | 4 |
| B | 0 | 41535 | 4 |
| C | 0 | 38727 | 4 |
| D | 0 | 57395 | 7 |
| Mode M9 | |||
|---|---|---|---|
| Quadrant | BADHDUFLAG | Total packets | Discarded packets |
| A | 0 | 19 | 0 |
| B | 0 | 19 | 0 |
| C | 0 | 19 | 0 |
| D | 0 | 19 | 0 |
| Quadrant | Total seconds | Saturated seconds | Saturation percentage |
|---|---|---|---|
| A | 18917 | 134 | 0.708358% |
| B | 18918 | 382 | 2.019241% |
| C | 18918 | 215 | 1.136484% |
| D | 18917 | 1059 | 5.598139% |
Noise dominated data is calculated using 1-second bins in cleaned event files. If a bin has >2000 counts, and if more than 50% of those come from <1% of pixels, then it is considered to be noise-dominated and hence unusable.
| Quadrant | # 1 sec bins | Bins with >0 counts | Bins with >2000 counts | High rate bins dominated by noise | Noise dominated (total time) | Noise dominated (detector-on time) | Marked lightcurve |
|---|---|---|---|---|---|---|---|
| A | 20967 | 18919 | 0 | 0 | 0.00% | 0.00% | 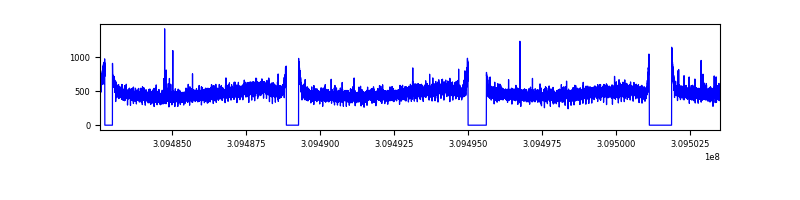 |
| B | 20968 | 18919 | 148 | 148 | 0.71% | 0.78% | 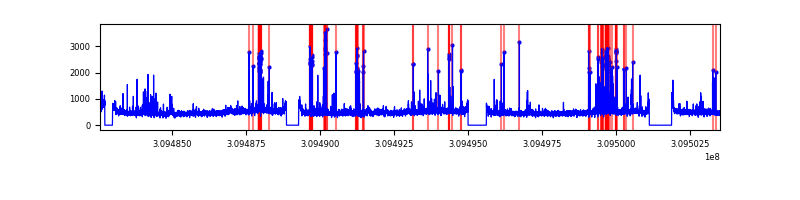 |
| C | 20968 | 18918 | 0 | 0 | 0.00% | 0.00% | 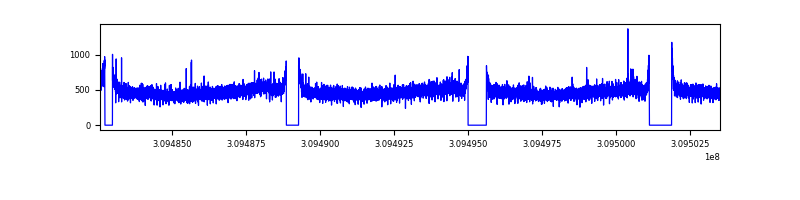 |
| D | 20966 | 18918 | 1025 | 1025 | 4.89% | 5.42% | 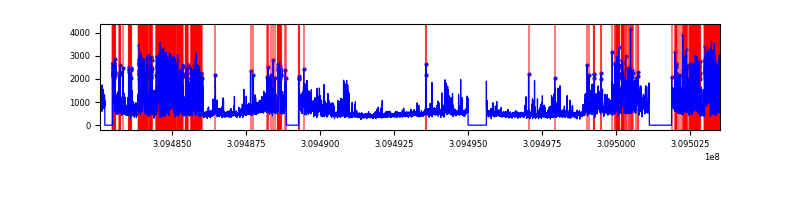 |
Top three noisy pixels from each quadrant. If the there are fewer than three noisy pixels in the level2.evt file, extra rows are filled as -1
| Pixel properties | Quadrant properties | ||||||
|---|---|---|---|---|---|---|---|
| Quadrant | DetID | PixID | Counts | Sigma | Mean | Median | Sigma |
| A | 13 | 254 | 33191 | 66.44 | 2301 | 2249 | 465.7 |
| A | 15 | 236 | 32226 | 64.36 | 2301 | 2249 | 465.7 |
| A | 3 | 137 | 19985 | 38.08 | 2301 | 2249 | 465.7 |
| B | 3 | 64 | 673418 | 1529.25 | 2281 | 2219 | 438.9 |
| B | 0 | 230 | 145862 | 327.27 | 2281 | 2219 | 438.9 |
| B | 0 | 190 | 97173 | 216.34 | 2281 | 2219 | 438.9 |
| C | 14 | 238 | 346005 | 665.67 | 2200 | 2215 | 516.5 |
| C | 0 | 239 | 17715 | 30.01 | 2200 | 2215 | 516.5 |
| C | 13 | 61 | 15482 | 25.69 | 2200 | 2215 | 516.5 |
| D | 7 | 238 | 4746370 | 8855.31 | 2200 | 2133 | 535.8 |
| D | 1 | 52 | 1271465 | 2369.26 | 2200 | 2133 | 535.8 |
| D | 5 | 222 | 175656 | 323.89 | 2200 | 2133 | 535.8 |
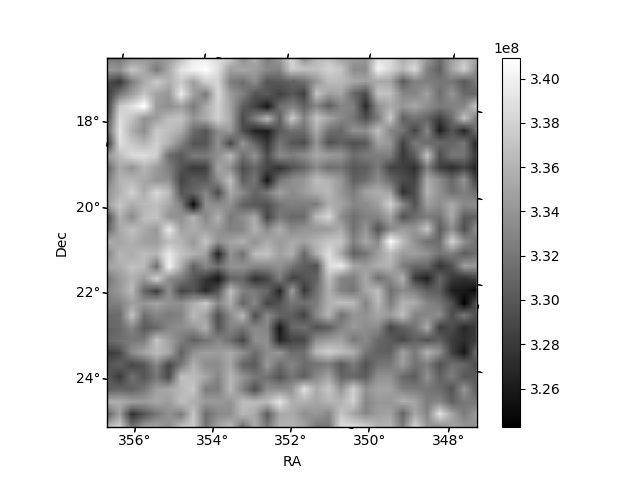
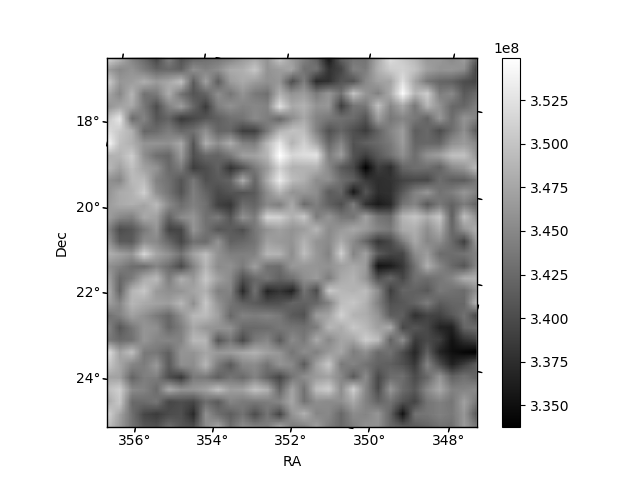
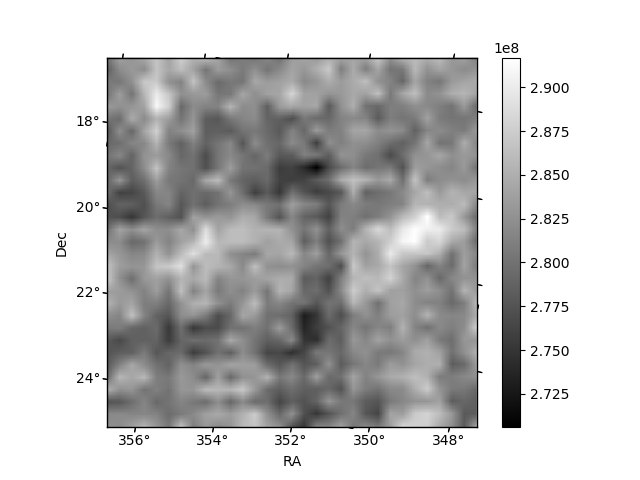
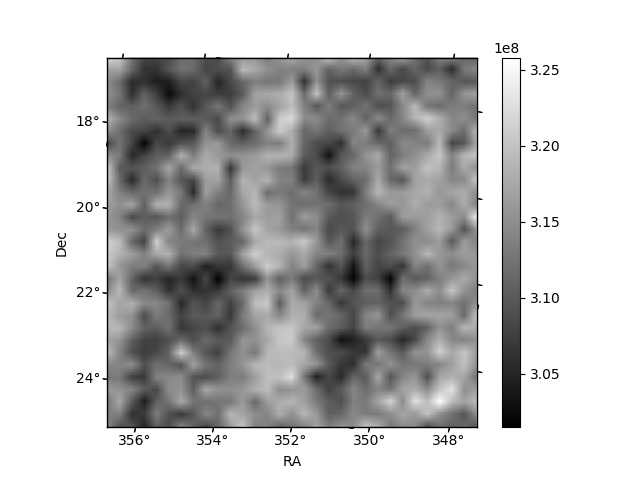
Histogram calculated using DETX and DETY for each event in the final _common_clean file
| Quadrant A | 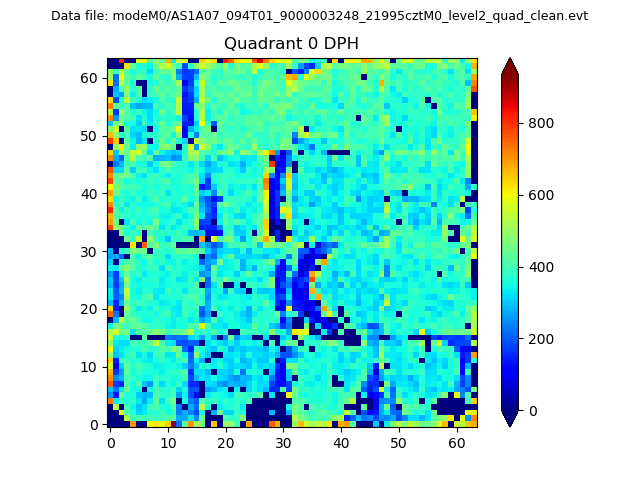 |
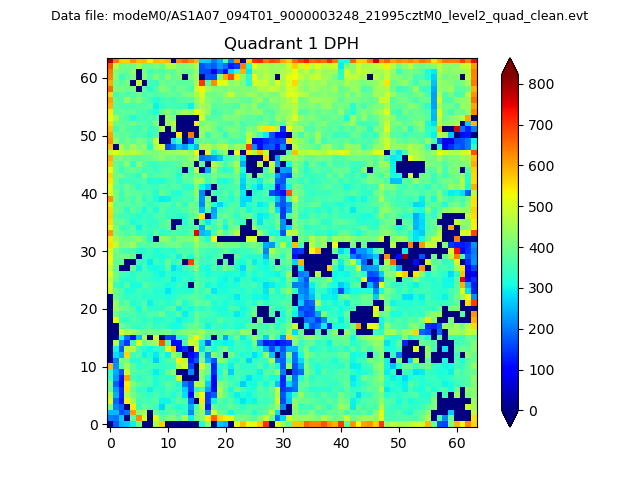 |
Quadrant B |
|---|---|---|---|
| Quadrant D | 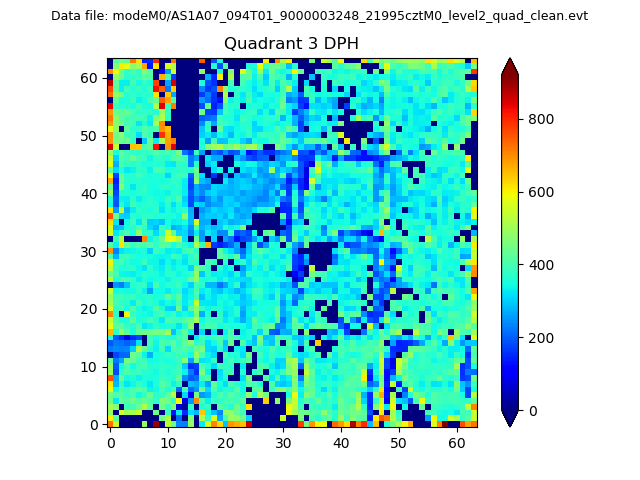 |
 |
Quadrant C |
| Plot type | Count rate plots | Images |
|---|---|---|
| Comparison with Poisson distribution Blue bars denote a histogram of data divided into 1 sec bins. Red curve is a Poisson curve with rate = median count rate of data. |
 |
 |
| Quadrant-wise count rates Data is divided into 100 sec bins |
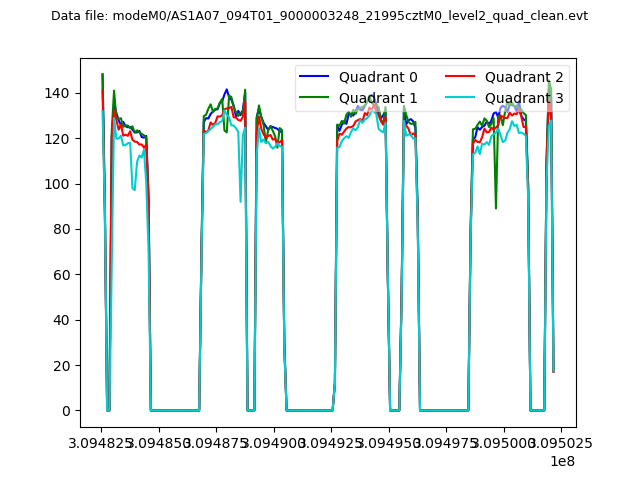 |
|
| Module-wise count rates for Quadrant A Data is divided into 100 sec bins |
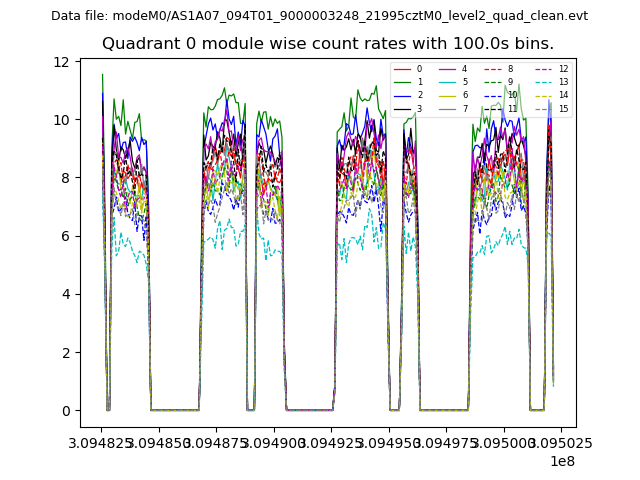 |
 |
| Module-wise count rates for Quadrant B Data is divided into 100 sec bins |
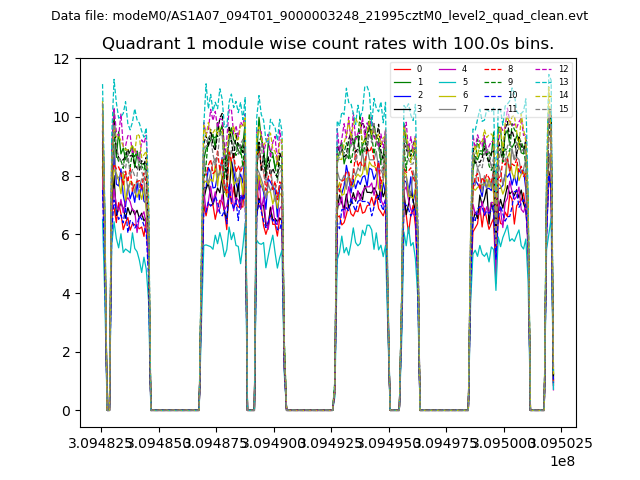 |
 |
| Module-wise count rates for Quadrant C Data is divided into 100 sec bins |
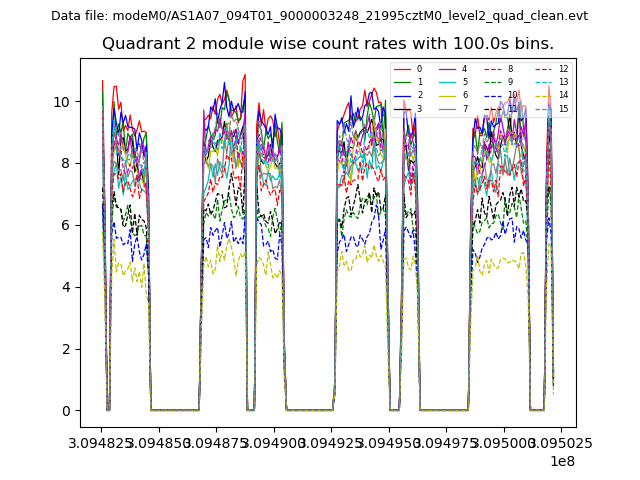 |
 |
| Module-wise count rates for Quadrant D Data is divided into 100 sec bins |
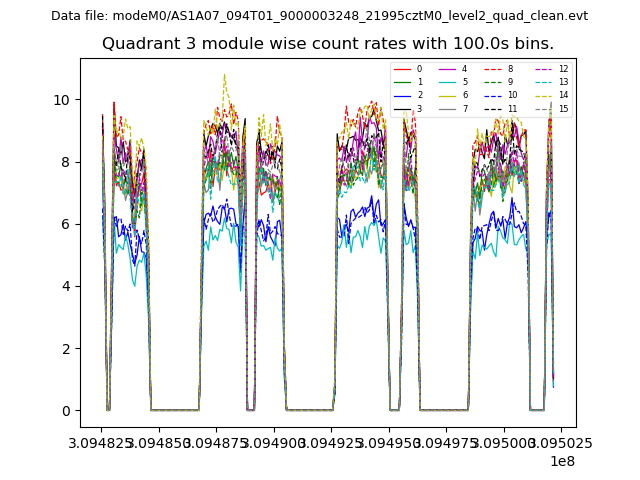 |
 |
| Parameter | Plot |
|---|---|
| CZT HV Monitor | 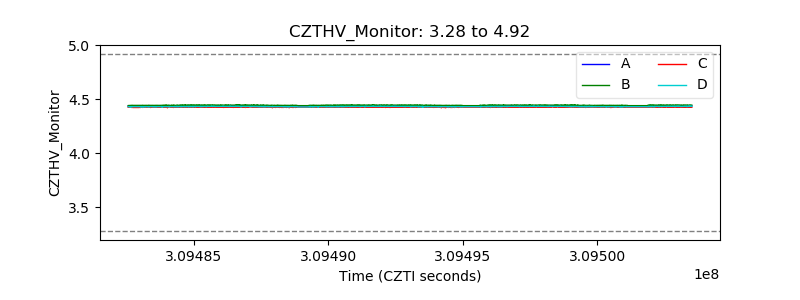 |
| D_VDD | 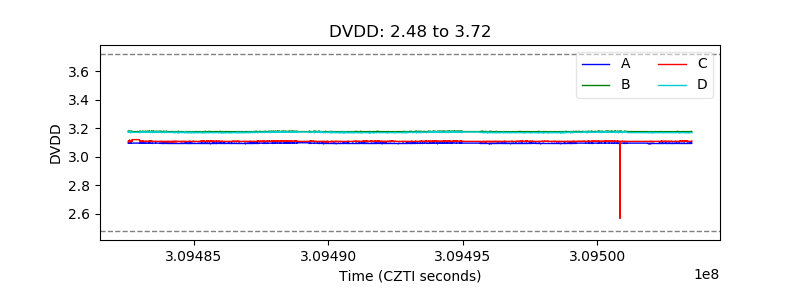 |
| Temperature 1 | 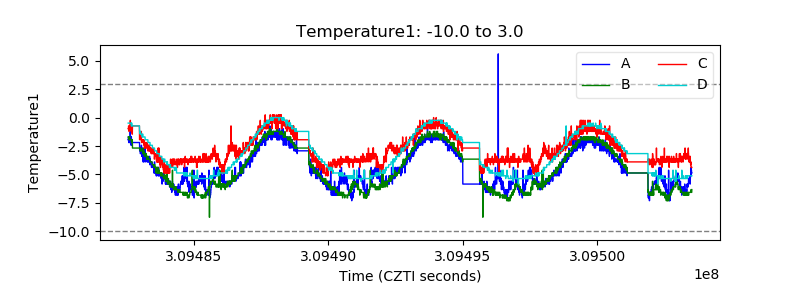 |
| Veto HV Monitor | 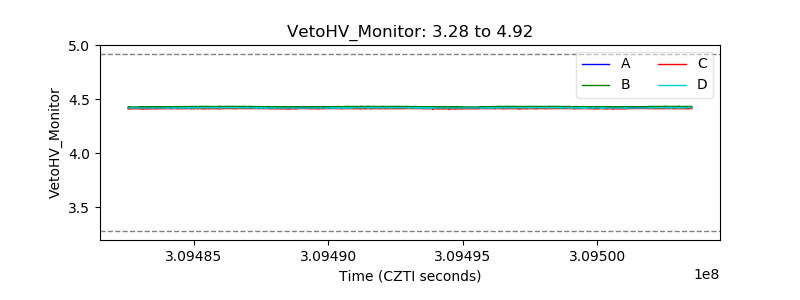 |
| Veto LLD | 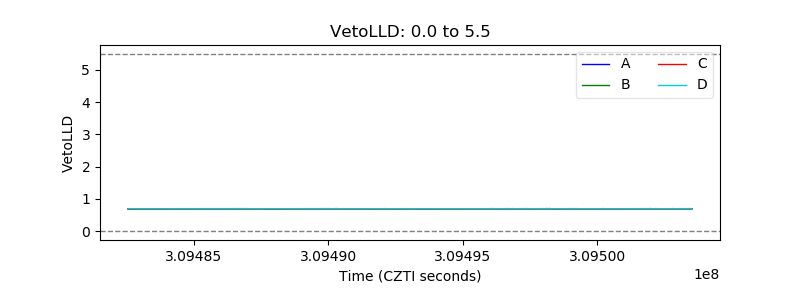 |
| Alpha Counter |  |
| _CPM_Rate |  |
| CZT Counter |  |
| +2.5 Volts monitor |  |
| +5 Volts monitor |  |
| _ROLL_ROT | 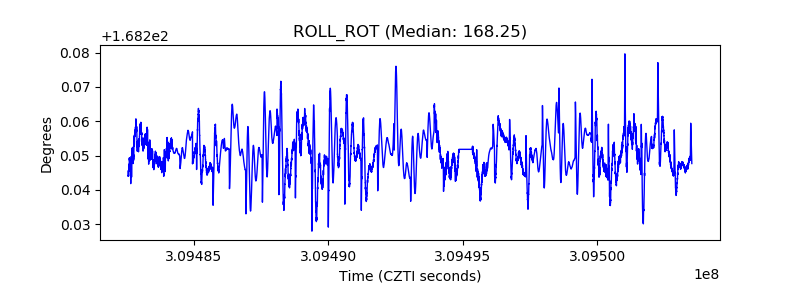 |
| _Roll_DEC | 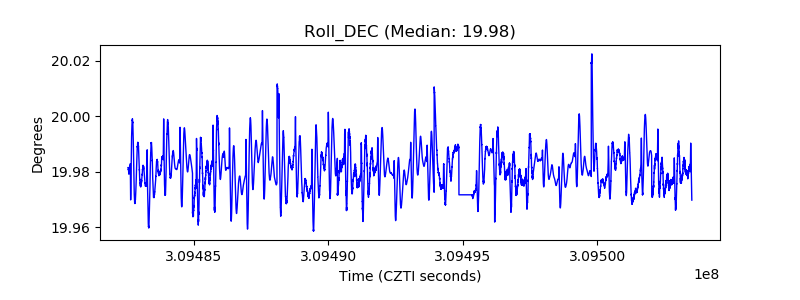 |
| _Roll_RA |  |
| Veto Counter | 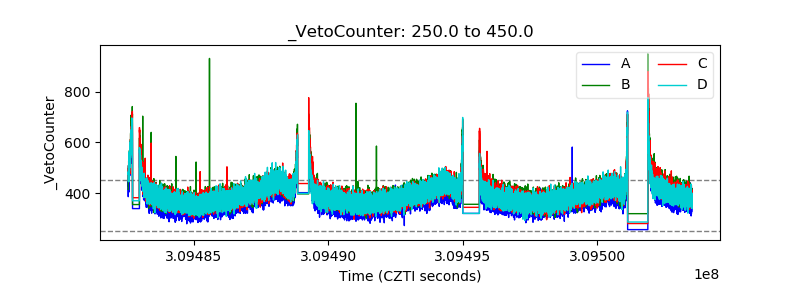 |