| Param | Original file | Final file |
|---|---|---|
| Filename | modeM0/AS1A07_094T01_9000003248_21996cztM0_level2.evt | modeM0/AS1A07_094T01_9000003248_21996cztM0_level2_quad_clean.evt |
| Size (bytes) | 338,411,520 | 33,465,600 |
| Size | 322.7 MB | 31.9 MB |
| Events in quadrant A | 1,749,213 | 192,583 |
| Events in quadrant B | 1,905,780 | 194,781 |
| Events in quadrant C | 1,727,968 | 184,454 |
| Events in quadrant D | 4,607,287 | 173,012 |
| Mode SS | |||
|---|---|---|---|
| Quadrant | BADHDUFLAG | Total packets | Discarded packets |
| A | 0 | 76 | 0 |
| B | 0 | 76 | 0 |
| C | 0 | 76 | 0 |
| D | 0 | 76 | 0 |
| Mode M0 | |||
|---|---|---|---|
| Quadrant | BADHDUFLAG | Total packets | Discarded packets |
| A | 0 | 7603 | 0 |
| B | 0 | 8054 | 0 |
| C | 0 | 7595 | 0 |
| D | 0 | 16369 | 0 |
| Quadrant | Total seconds | Saturated seconds | Saturation percentage |
|---|---|---|---|
| A | 3789 | 6 | 0.158353% |
| B | 3790 | 21 | 0.554090% |
| C | 3790 | 6 | 0.158311% |
| D | 3790 | 693 | 18.284960% |
Noise dominated data is calculated using 1-second bins in cleaned event files. If a bin has >2000 counts, and if more than 50% of those come from <1% of pixels, then it is considered to be noise-dominated and hence unusable.
| Quadrant | # 1 sec bins | Bins with >0 counts | Bins with >2000 counts | High rate bins dominated by noise | Noise dominated (total time) | Noise dominated (detector-on time) | Marked lightcurve |
|---|---|---|---|---|---|---|---|
| A | 3789 | 3789 | 0 | 0 | 0.00% | 0.00% | 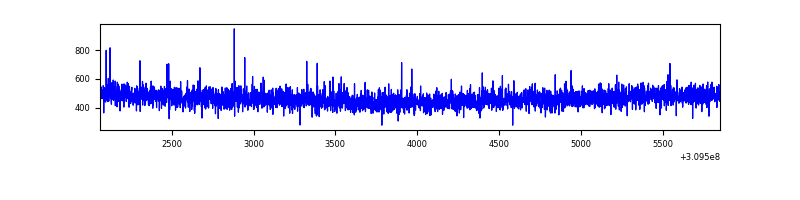 |
| B | 3790 | 3790 | 12 | 12 | 0.32% | 0.32% |  |
| C | 3790 | 3790 | 0 | 0 | 0.00% | 0.00% | 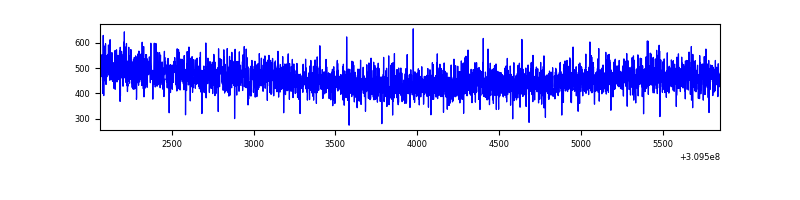 |
| D | 3790 | 3790 | 718 | 718 | 18.94% | 18.94% | 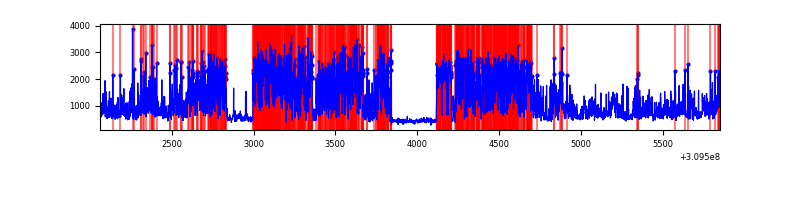 |
Top three noisy pixels from each quadrant. If the there are fewer than three noisy pixels in the level2.evt file, extra rows are filled as -1
| Pixel properties | Quadrant properties | ||||||
|---|---|---|---|---|---|---|---|
| Quadrant | DetID | PixID | Counts | Sigma | Mean | Median | Sigma |
| A | 15 | 236 | 10637 | 110.86 | 450 | 440 | 92.0 |
| A | 13 | 254 | 6252 | 63.19 | 450 | 440 | 92.0 |
| A | 0 | 226 | 4001 | 38.71 | 450 | 440 | 92.0 |
| B | 3 | 64 | 68277 | 766.71 | 447 | 437 | 88.5 |
| B | 0 | 230 | 54449 | 610.43 | 447 | 437 | 88.5 |
| B | 0 | 197 | 21073 | 233.22 | 447 | 437 | 88.5 |
| C | 14 | 238 | 67031 | 657.11 | 426 | 428 | 101.4 |
| C | 13 | 61 | 2992 | 25.3 | 426 | 428 | 101.4 |
| C | 4 | 175 | 1316 | 8.76 | 426 | 428 | 101.4 |
| D | 7 | 238 | 2866476 | 28082.59 | 412 | 399 | 102.1 |
| D | 1 | 52 | 130678 | 1276.51 | 412 | 399 | 102.1 |
| D | 13 | 172 | 21206 | 203.87 | 412 | 399 | 102.1 |
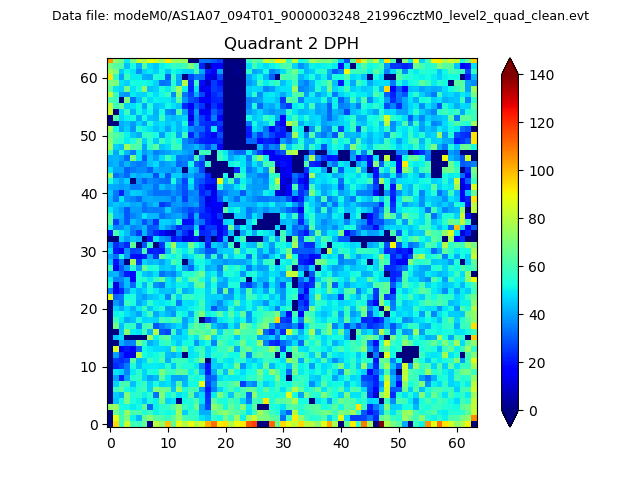
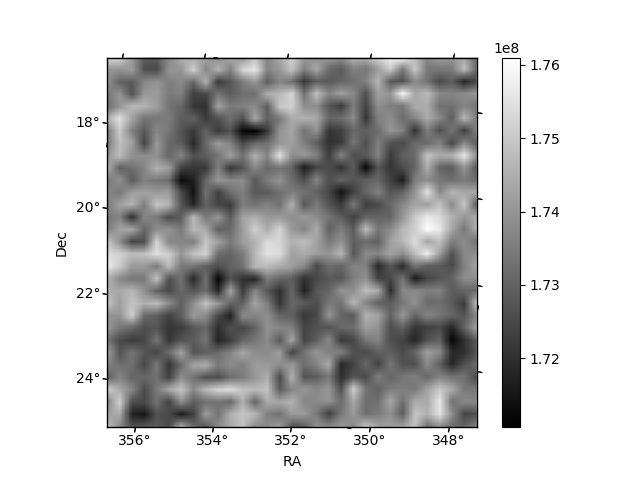
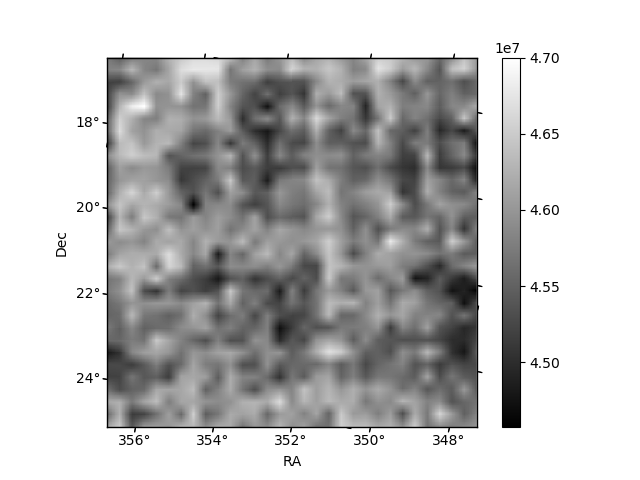
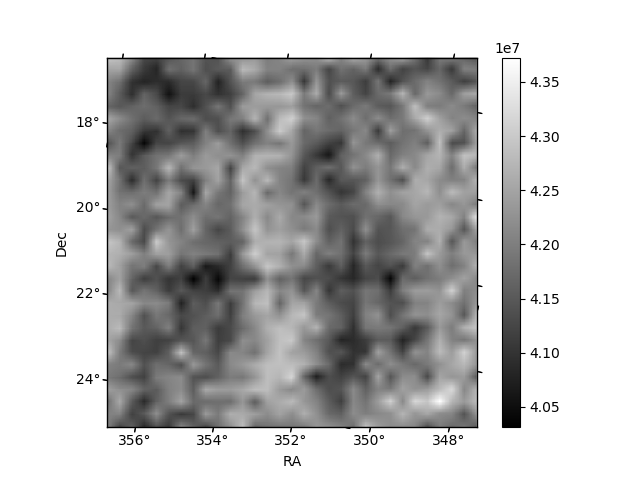
Histogram calculated using DETX and DETY for each event in the final _common_clean file
| Quadrant A | 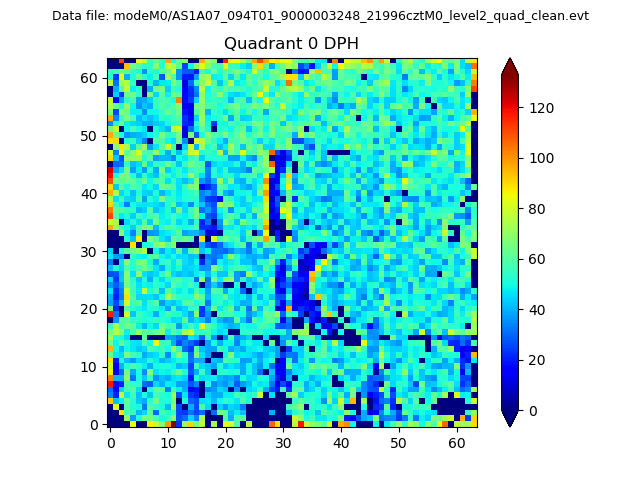 |
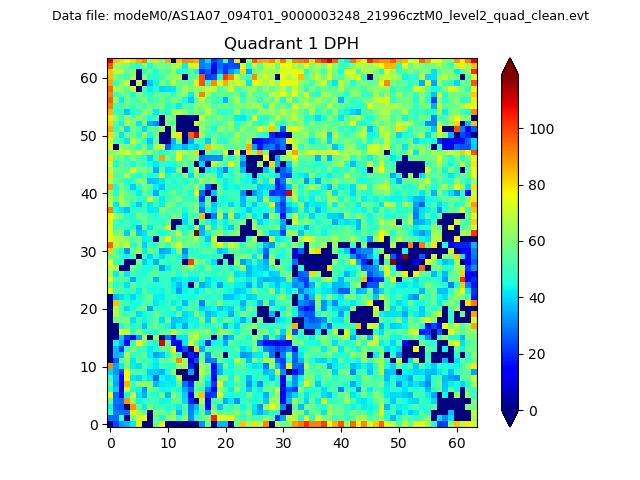 |
Quadrant B |
|---|---|---|---|
| Quadrant D | 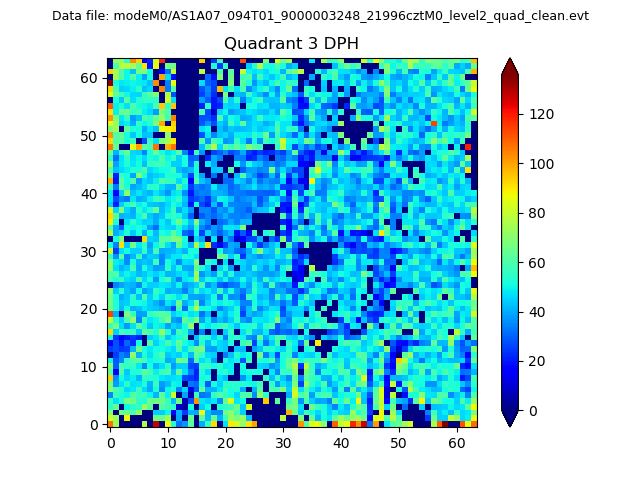 |
 |
Quadrant C |
| Plot type | Count rate plots | Images |
|---|---|---|
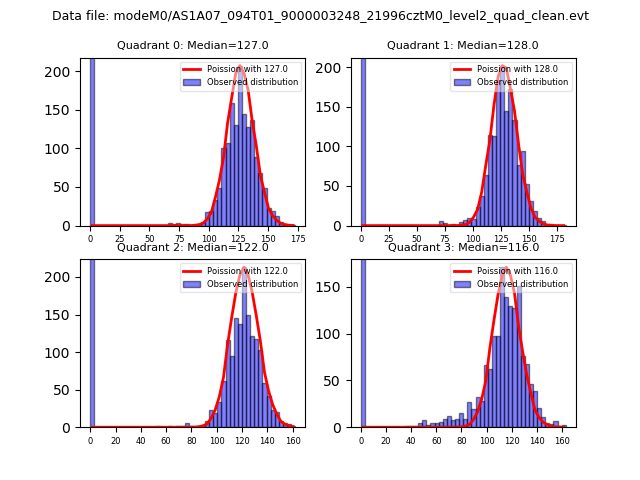
| Comparison with Poisson distribution Blue bars denote a histogram of data divided into 1 sec bins. Red curve is a Poisson curve with rate = median count rate of data. |
 |
 |
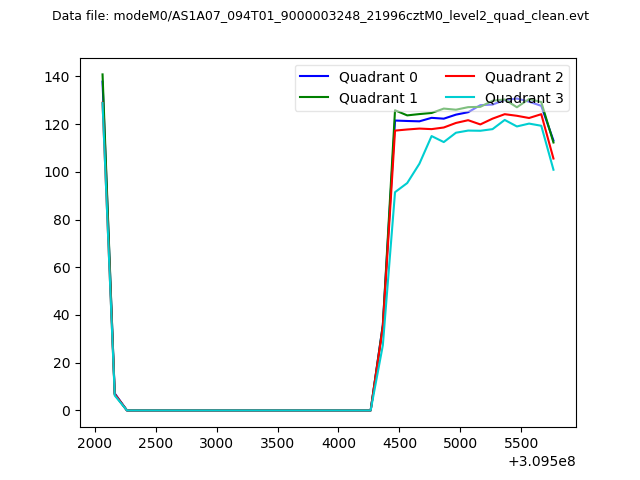
| Quadrant-wise count rates Data is divided into 100 sec bins |
 |
|
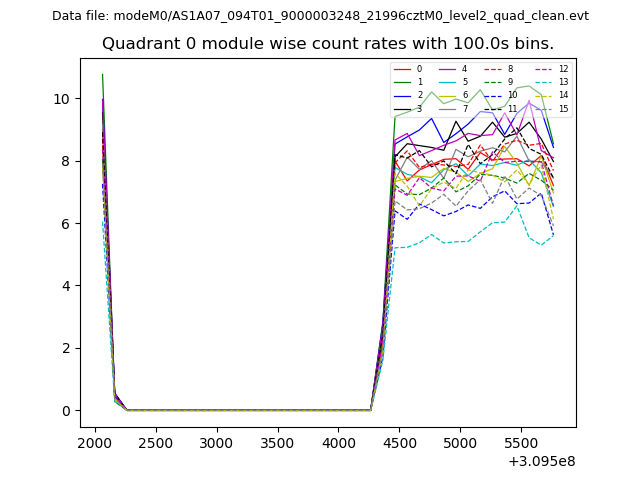
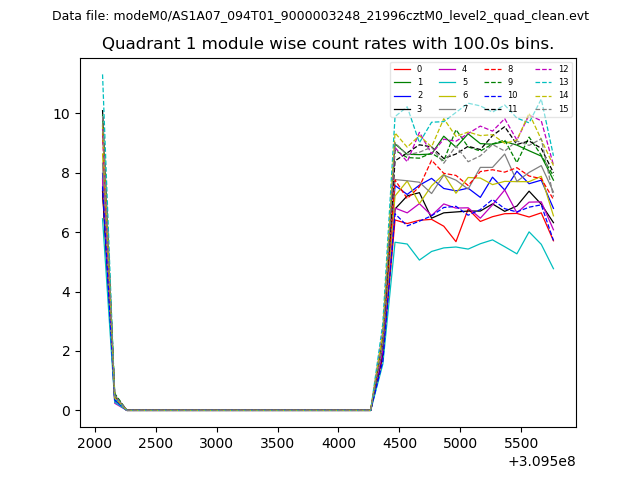
| Module-wise count rates for Quadrant A Data is divided into 100 sec bins |
 |
 |
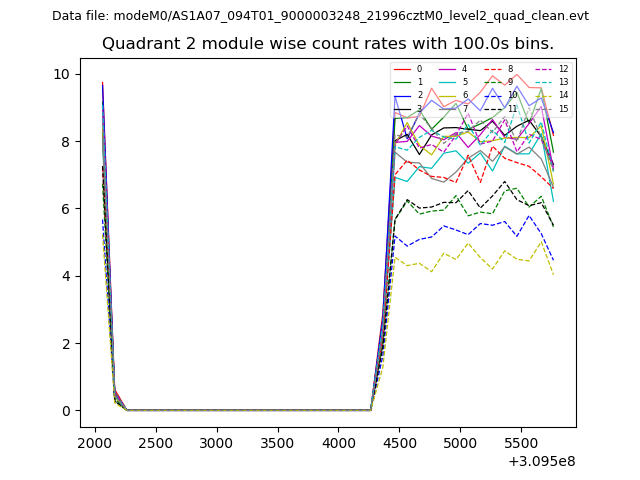
| Module-wise count rates for Quadrant B Data is divided into 100 sec bins |
 |
 |
| Module-wise count rates for Quadrant C Data is divided into 100 sec bins |
 |
 |
| Module-wise count rates for Quadrant D Data is divided into 100 sec bins |
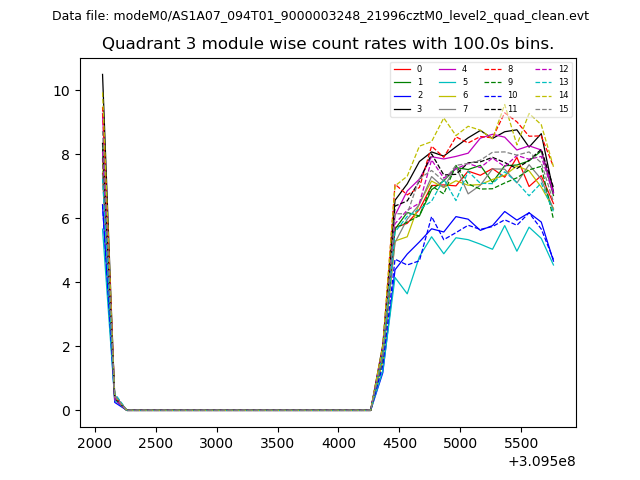 |
 |
| Parameter | Plot |
|---|---|
| CZT HV Monitor | 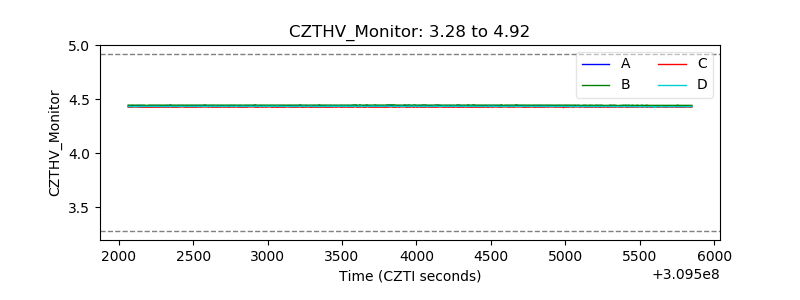 |
| D_VDD |  |
| Temperature 1 | 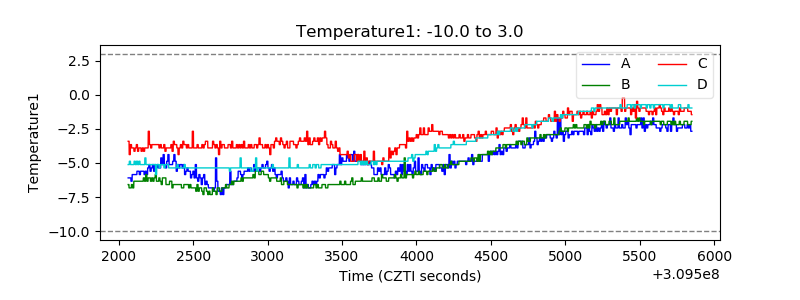 |
| Veto HV Monitor | 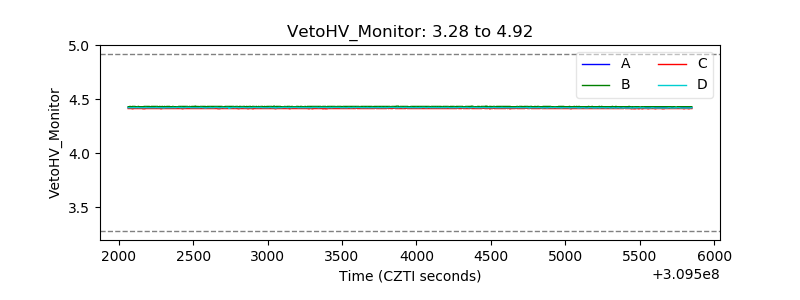 |
| Veto LLD | 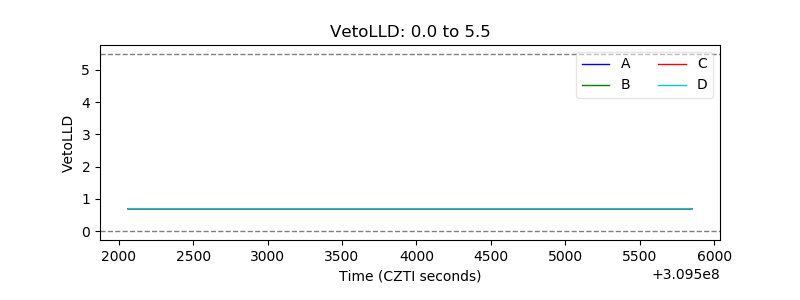 |
| Alpha Counter | 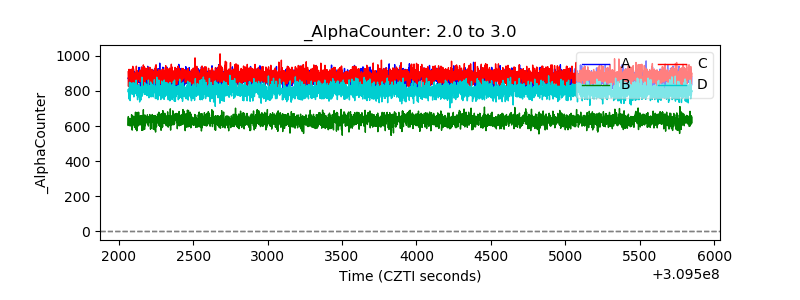 |
| _CPM_Rate | 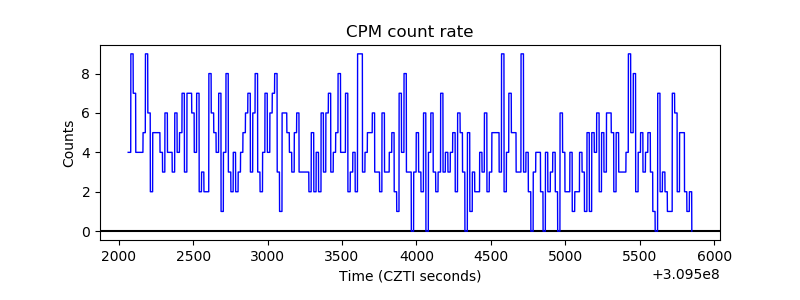 |
| CZT Counter | 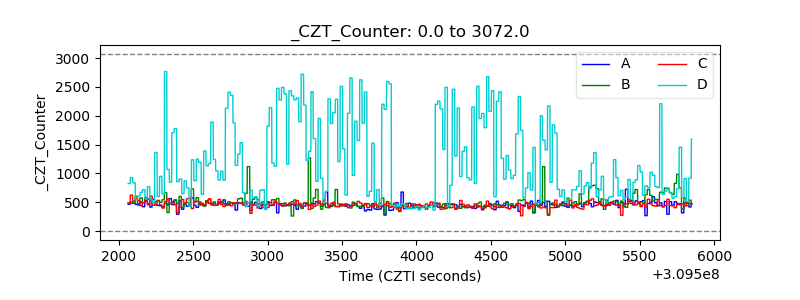 |
| +2.5 Volts monitor |  |
| +5 Volts monitor |  |
| _ROLL_ROT | 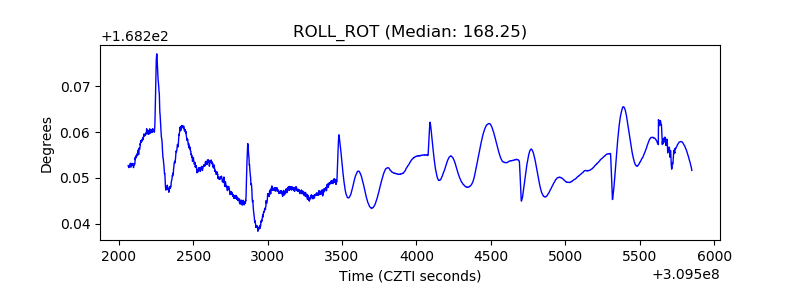 |
| _Roll_DEC | 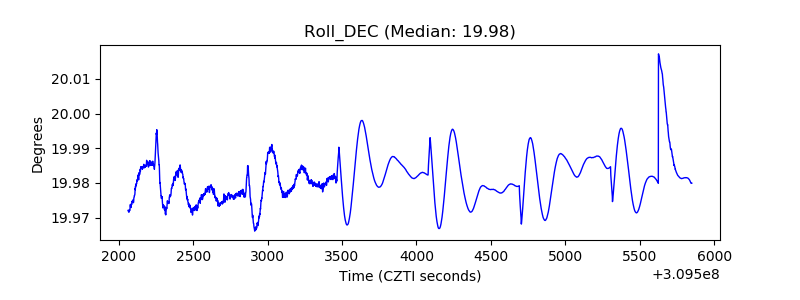 |
| _Roll_RA | 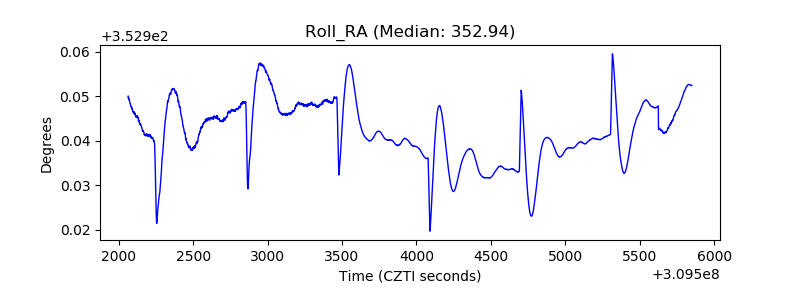 |
| Veto Counter | 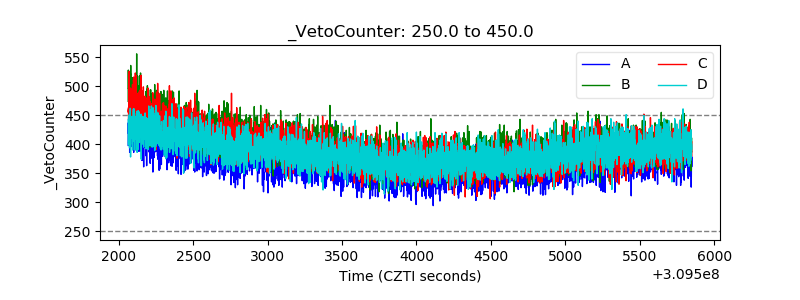 |