| Param | Original file | Final file |
|---|---|---|
| Filename | modeM0/AS1A07_153T02_9000003250_21996cztM0_level2.evt | modeM0/AS1A07_153T02_9000003250_21996cztM0_level2_quad_clean.evt |
| Size (bytes) | 124,323,840 | 28,172,160 |
| Size | 118.6 MB | 26.9 MB |
| Events in quadrant A | 777,539 | 189,169 |
| Events in quadrant B | 799,328 | 194,382 |
| Events in quadrant C | 799,909 | 184,176 |
| Events in quadrant D | 1,285,443 | 175,337 |
| Mode SS | |||
|---|---|---|---|
| Quadrant | BADHDUFLAG | Total packets | Discarded packets |
| A | 0 | 32 | 0 |
| B | 0 | 32 | 0 |
| C | 0 | 32 | 0 |
| D | 0 | 32 | 0 |
| Mode M0 | |||
|---|---|---|---|
| Quadrant | BADHDUFLAG | Total packets | Discarded packets |
| A | 0 | 3145 | 1 |
| B | 0 | 3226 | 1 |
| C | 0 | 3188 | 1 |
| D | 0 | 4801 | 1 |
| Mode M9 | |||
|---|---|---|---|
| Quadrant | BADHDUFLAG | Total packets | Discarded packets |
| A | 0 | 10 | 0 |
| B | 0 | 10 | 0 |
| C | 0 | 10 | 0 |
| D | 0 | 10 | 0 |
| Quadrant | Total seconds | Saturated seconds | Saturation percentage |
|---|---|---|---|
| A | 1475 | 11 | 0.745763% |
| B | 1475 | 17 | 1.152542% |
| C | 1475 | 35 | 2.372881% |
| D | 1475 | 84 | 5.694915% |
Noise dominated data is calculated using 1-second bins in cleaned event files. If a bin has >2000 counts, and if more than 50% of those come from <1% of pixels, then it is considered to be noise-dominated and hence unusable.
| Quadrant | # 1 sec bins | Bins with >0 counts | Bins with >2000 counts | High rate bins dominated by noise | Noise dominated (total time) | Noise dominated (detector-on time) | Marked lightcurve |
|---|---|---|---|---|---|---|---|
| A | 2425 | 1476 | 0 | 0 | 0.00% | 0.00% | 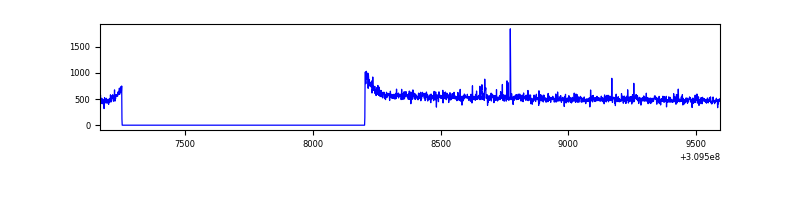 |
| B | 2425 | 1475 | 1 | 1 | 0.04% | 0.07% | 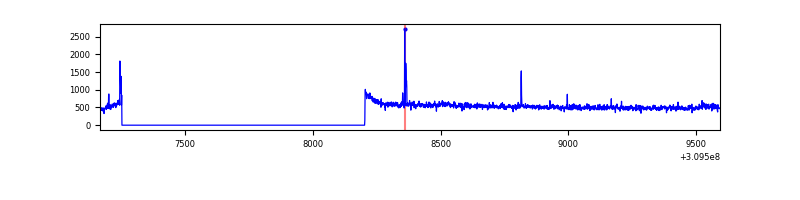 |
| C | 2425 | 1476 | 0 | 0 | 0.00% | 0.00% | 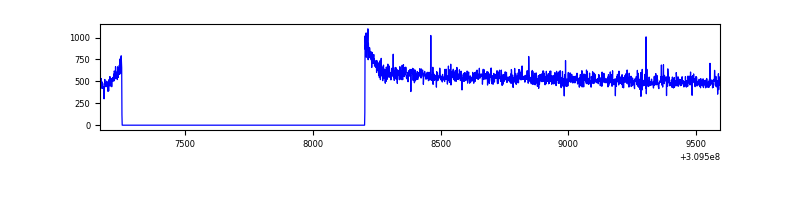 |
| D | 2425 | 1476 | 66 | 66 | 2.72% | 4.47% | 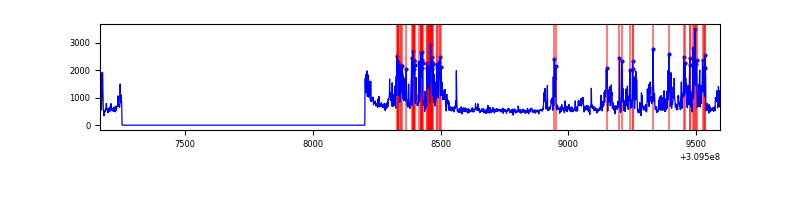 |
Top three noisy pixels from each quadrant. If the there are fewer than three noisy pixels in the level2.evt file, extra rows are filled as -1
| Pixel properties | Quadrant properties | ||||||
|---|---|---|---|---|---|---|---|
| Quadrant | DetID | PixID | Counts | Sigma | Mean | Median | Sigma |
| A | 15 | 236 | 10295 | 243.3 | 198 | 194 | 41.5 |
| A | 13 | 254 | 2466 | 54.73 | 198 | 194 | 41.5 |
| A | 3 | 137 | 1653 | 35.14 | 198 | 194 | 41.5 |
| B | 3 | 64 | 16069 | 399.78 | 197 | 193 | 39.7 |
| B | 0 | 229 | 8699 | 214.2 | 197 | 193 | 39.7 |
| B | 12 | 111 | 4381 | 105.46 | 197 | 193 | 39.7 |
| C | 14 | 238 | 31292 | 652.17 | 196 | 196 | 47.7 |
| C | 0 | 10 | 1899 | 35.72 | 196 | 196 | 47.7 |
| C | 13 | 61 | 1308 | 23.32 | 196 | 196 | 47.7 |
| D | 7 | 238 | 530081 | 10610.13 | 196 | 190 | 49.9 |
| D | 2 | 234 | 5920 | 114.73 | 196 | 190 | 49.9 |
| D | 12 | 235 | 5161 | 99.54 | 196 | 190 | 49.9 |
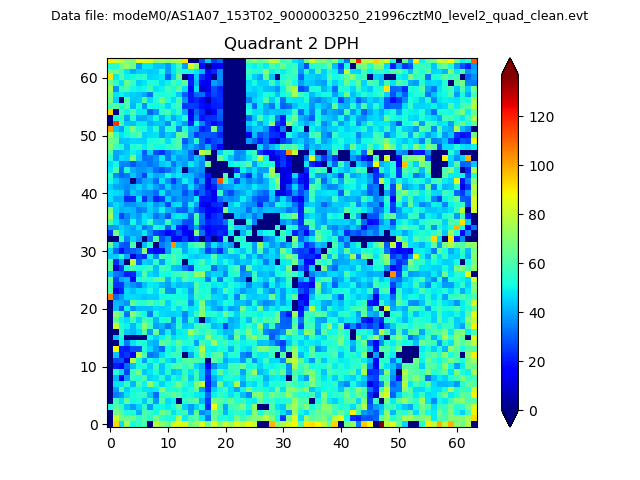
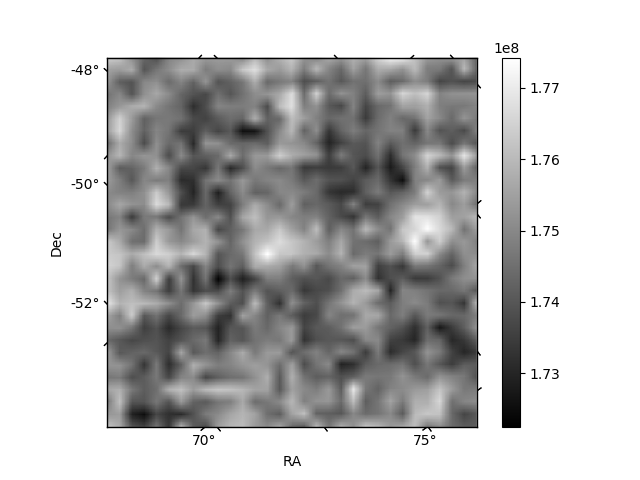
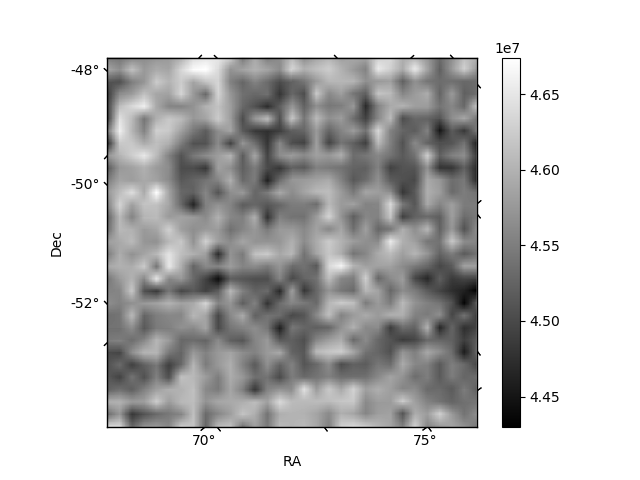
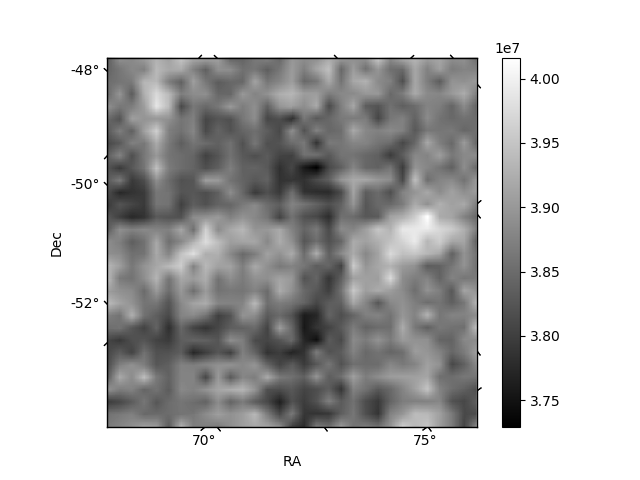
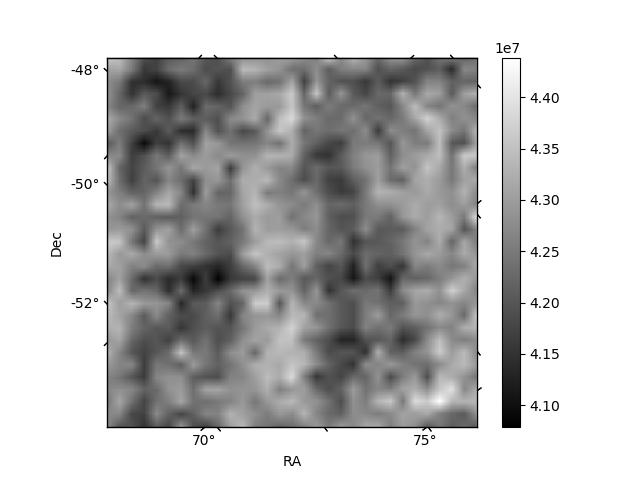
Histogram calculated using DETX and DETY for each event in the final _common_clean file
| Quadrant A | 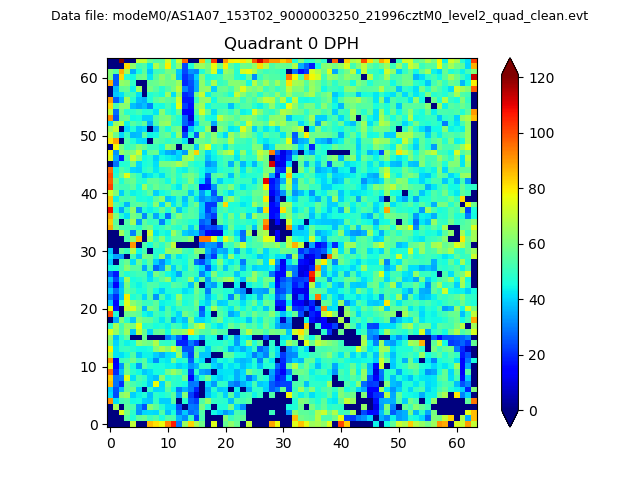 |
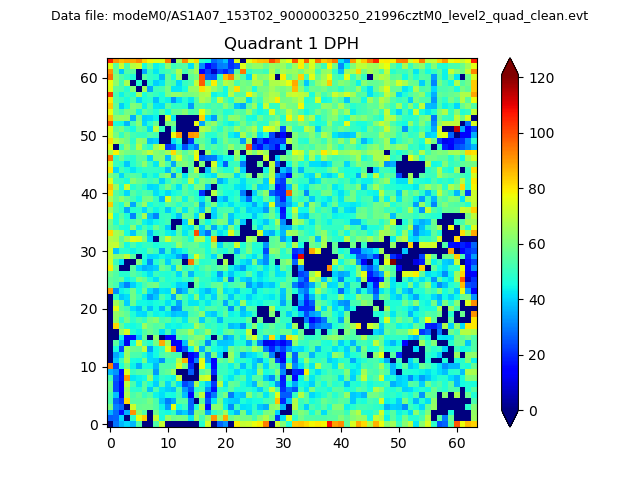 |
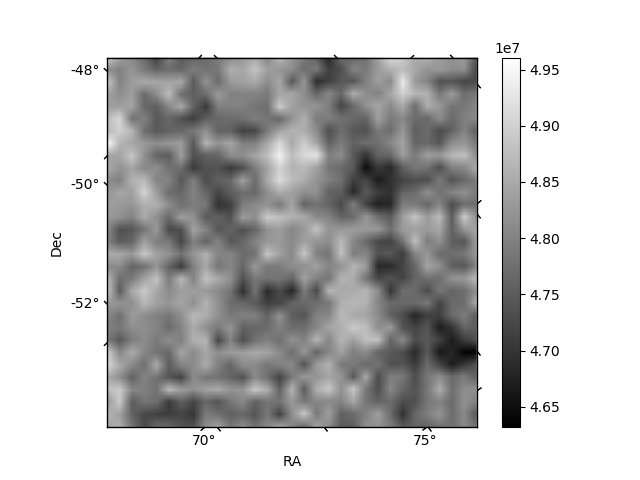
Quadrant B |
|---|---|---|---|
| Quadrant D | 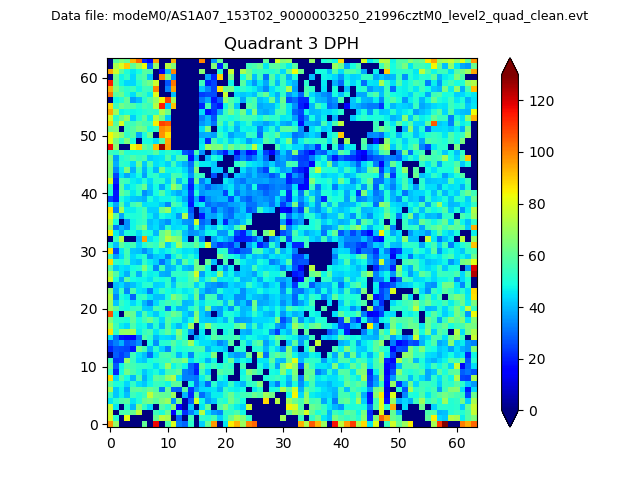 |
 |
Quadrant C |
| Plot type | Count rate plots | Images |
|---|---|---|
| Comparison with Poisson distribution Blue bars denote a histogram of data divided into 1 sec bins. Red curve is a Poisson curve with rate = median count rate of data. |
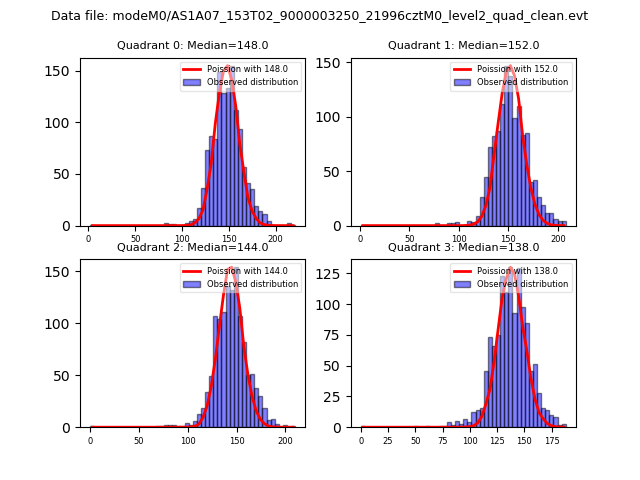 |
 |
| Quadrant-wise count rates Data is divided into 100 sec bins |
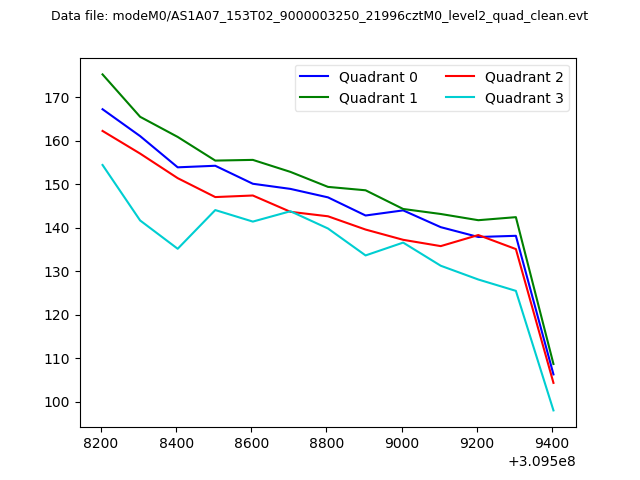 |
|
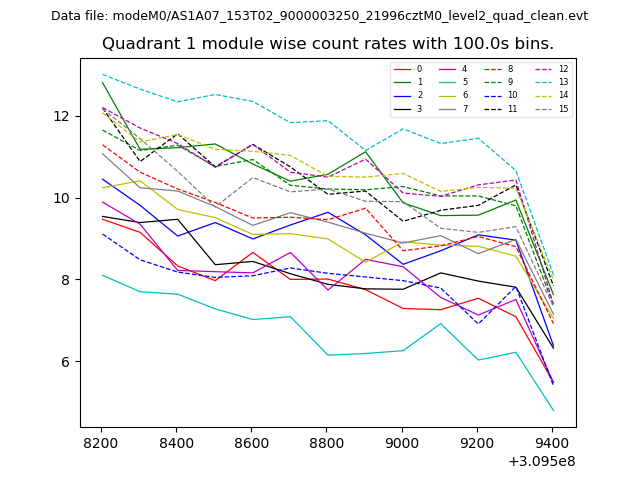
| Module-wise count rates for Quadrant A Data is divided into 100 sec bins |
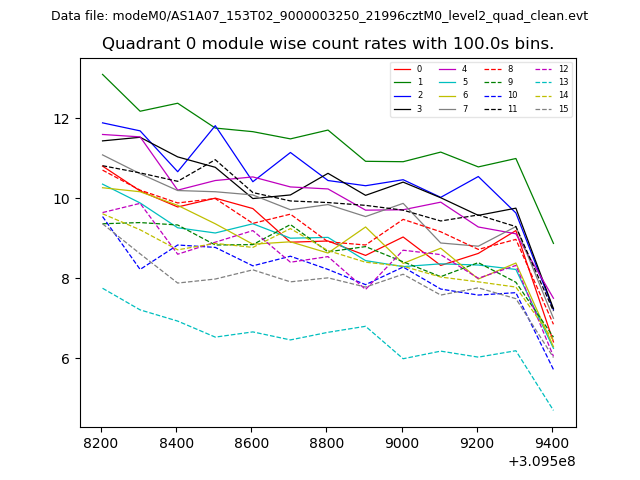 |
 |
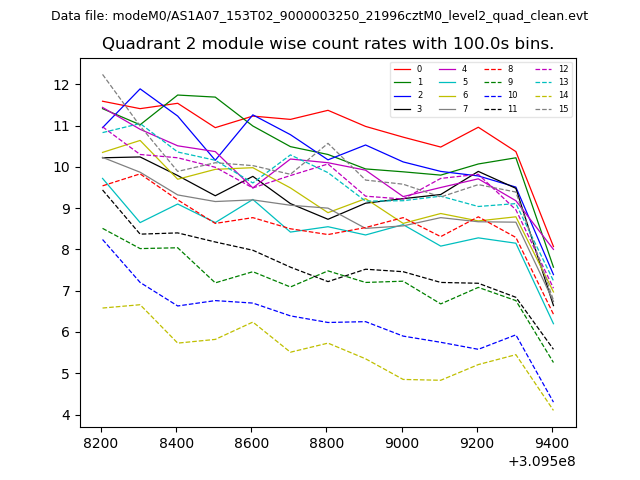
| Module-wise count rates for Quadrant B Data is divided into 100 sec bins |
 |
 |
| Module-wise count rates for Quadrant C Data is divided into 100 sec bins |
 |
 |
| Module-wise count rates for Quadrant D Data is divided into 100 sec bins |
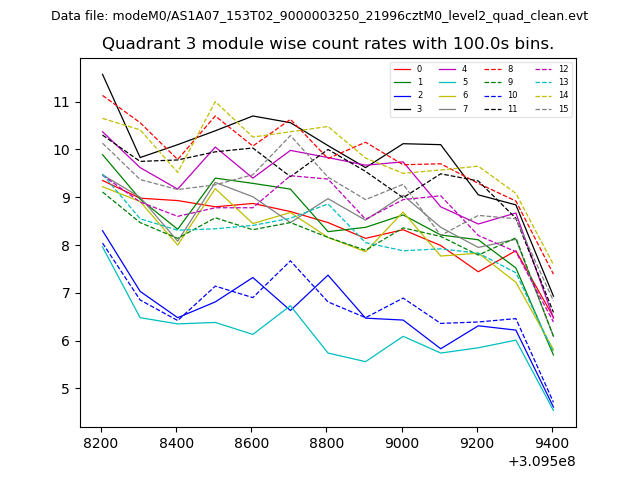 |
 |
| Parameter | Plot |
|---|---|
| CZT HV Monitor | 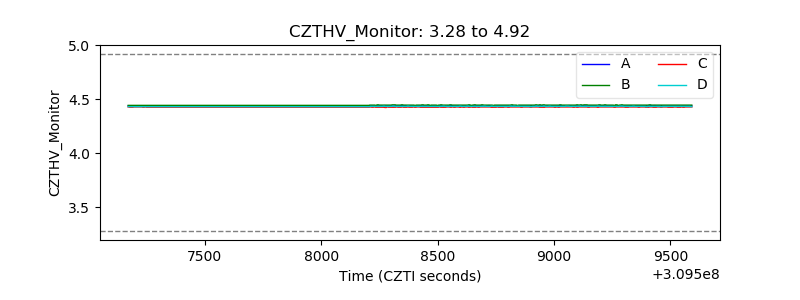 |
| D_VDD | 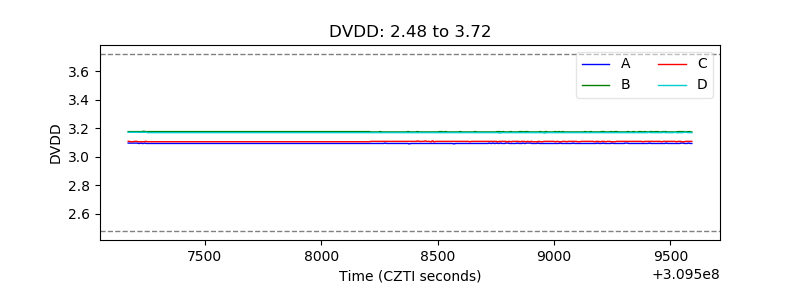 |
| Temperature 1 | 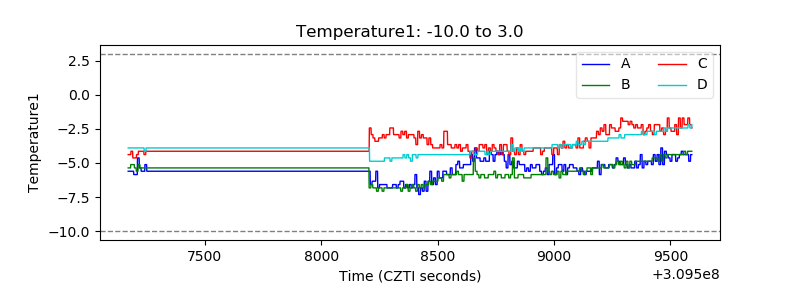 |
| Veto HV Monitor | 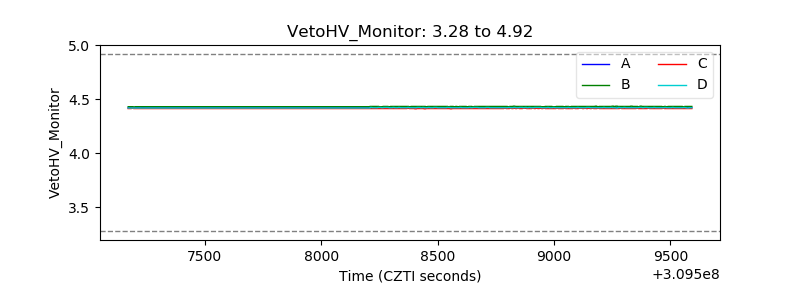 |
| Veto LLD | 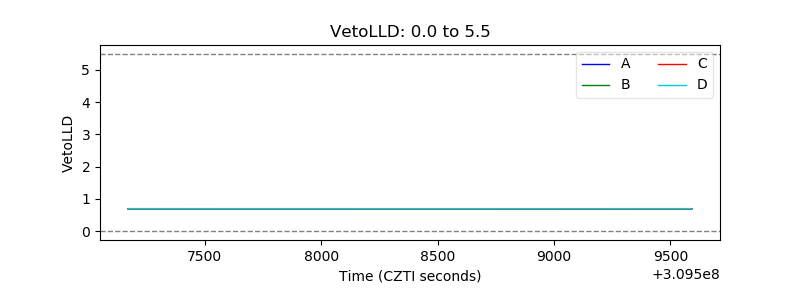 |
| Alpha Counter | 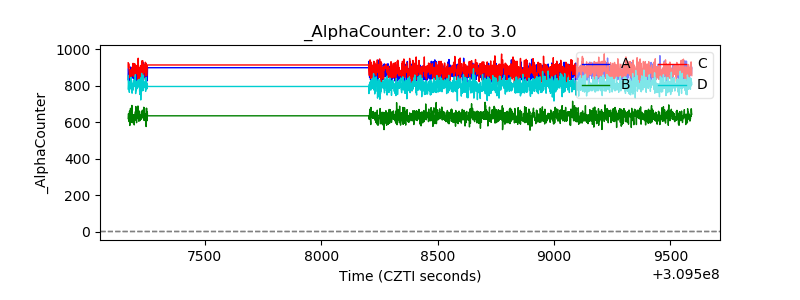 |
| _CPM_Rate | 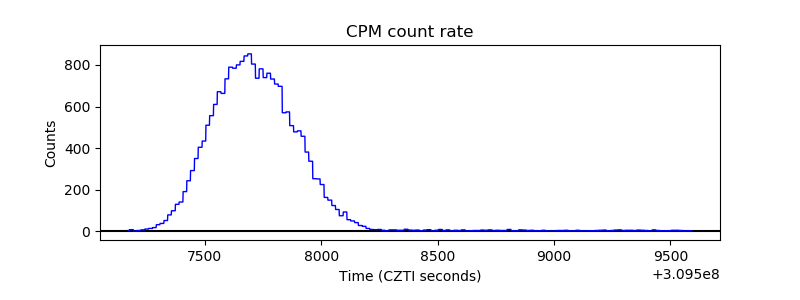 |
| CZT Counter | 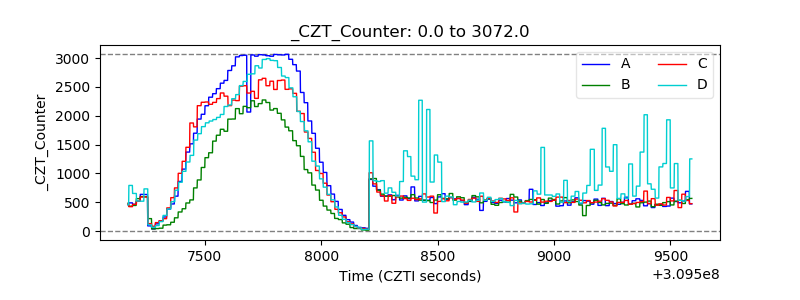 |
| +2.5 Volts monitor |  |
| +5 Volts monitor |  |
| _ROLL_ROT | 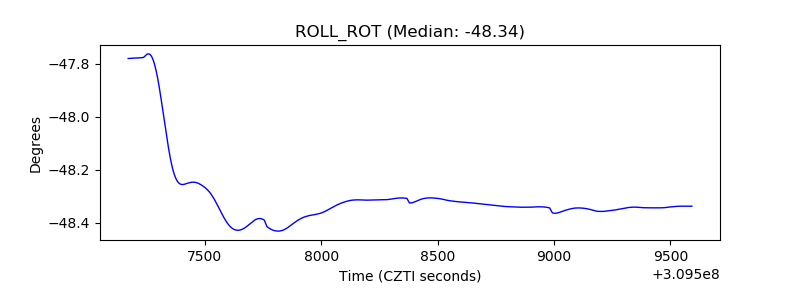 |
| _Roll_DEC | 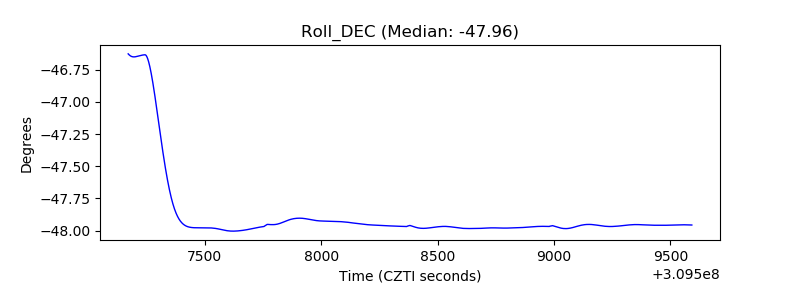 |
| _Roll_RA | 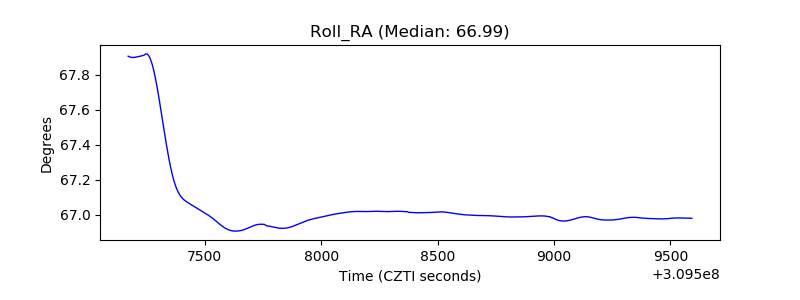 |
| Veto Counter | 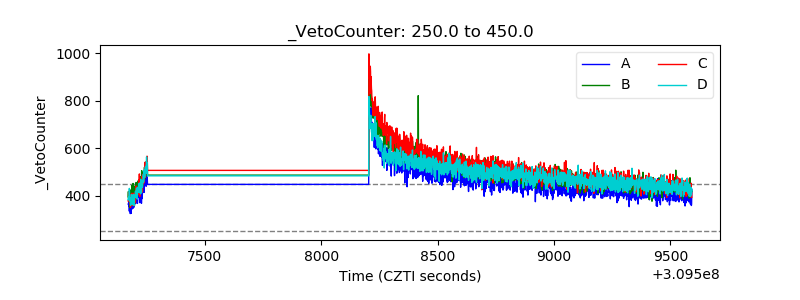 |