| Param | Original file | Final file |
|---|---|---|
| Filename | modeM0/AS1A07_153T02_9000003250_21999cztM0_level2.evt | modeM0/AS1A07_153T02_9000003250_21999cztM0_level2_quad_clean.evt |
| Size (bytes) | 526,259,520 | 84,392,640 |
| Size | 501.9 MB | 80.5 MB |
| Events in quadrant A | 3,399,481 | 542,144 |
| Events in quadrant B | 3,612,375 | 548,078 |
| Events in quadrant C | 3,420,265 | 518,017 |
| Events in quadrant D | 5,070,117 | 498,896 |
| Mode SS | |||
|---|---|---|---|
| Quadrant | BADHDUFLAG | Total packets | Discarded packets |
| A | 0 | 130 | 0 |
| B | 0 | 130 | 0 |
| C | 0 | 130 | 0 |
| D | 0 | 130 | 0 |
| Mode M0 | |||
|---|---|---|---|
| Quadrant | BADHDUFLAG | Total packets | Discarded packets |
| A | 0 | 14289 | 2 |
| B | 0 | 14826 | 2 |
| C | 0 | 14347 | 2 |
| D | 0 | 19630 | 2 |
| Mode M9 | |||
|---|---|---|---|
| Quadrant | BADHDUFLAG | Total packets | Discarded packets |
| A | 0 | 16 | 0 |
| B | 0 | 17 | 0 |
| C | 0 | 17 | 0 |
| D | 0 | 17 | 0 |
| Quadrant | Total seconds | Saturated seconds | Saturation percentage |
|---|---|---|---|
| A | 6427 | 81 | 1.260308% |
| B | 6427 | 116 | 1.804886% |
| C | 6427 | 138 | 2.147192% |
| D | 6427 | 222 | 3.454178% |
Noise dominated data is calculated using 1-second bins in cleaned event files. If a bin has >2000 counts, and if more than 50% of those come from <1% of pixels, then it is considered to be noise-dominated and hence unusable.
| Quadrant | # 1 sec bins | Bins with >0 counts | Bins with >2000 counts | High rate bins dominated by noise | Noise dominated (total time) | Noise dominated (detector-on time) | Marked lightcurve |
|---|---|---|---|---|---|---|---|
| A | 7617 | 6427 | 3 | 3 | 0.04% | 0.05% | 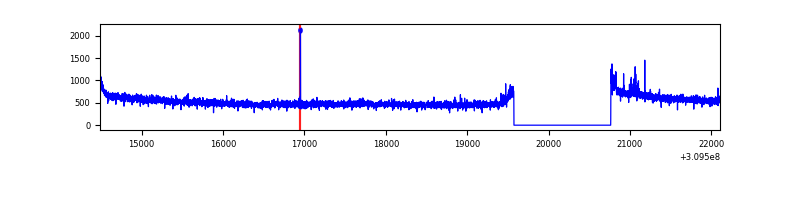 |
| B | 7617 | 6427 | 17 | 17 | 0.22% | 0.26% | 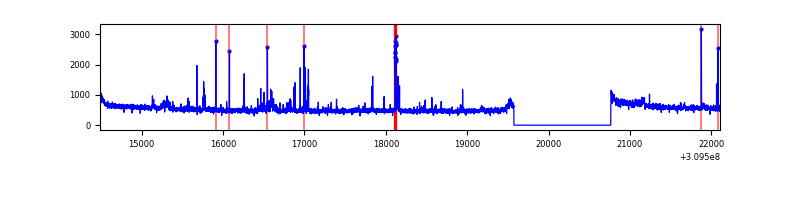 |
| C | 7617 | 6427 | 1 | 1 | 0.01% | 0.02% | 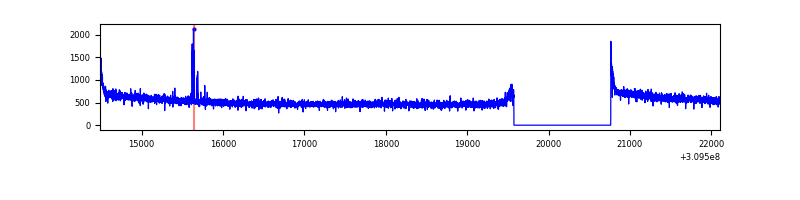 |
| D | 7617 | 6427 | 144 | 144 | 1.89% | 2.24% | 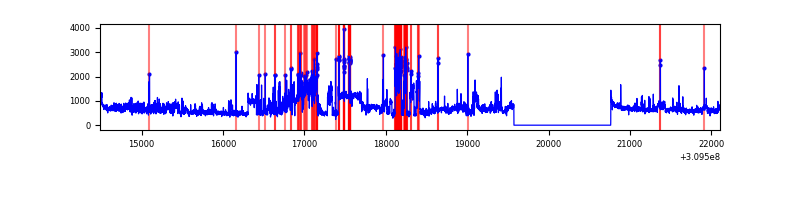 |
Top three noisy pixels from each quadrant. If the there are fewer than three noisy pixels in the level2.evt file, extra rows are filled as -1
| Pixel properties | Quadrant properties | ||||||
|---|---|---|---|---|---|---|---|
| Quadrant | DetID | PixID | Counts | Sigma | Mean | Median | Sigma |
| A | 15 | 236 | 36022 | 206.37 | 870 | 854 | 170.4 |
| A | 13 | 254 | 11015 | 59.62 | 870 | 854 | 170.4 |
| A | 3 | 1 | 9543 | 50.99 | 870 | 854 | 170.4 |
| B | 3 | 64 | 129130 | 809.47 | 858 | 839 | 158.5 |
| B | 0 | 230 | 61103 | 380.25 | 858 | 839 | 158.5 |
| B | 0 | 229 | 24359 | 148.4 | 858 | 839 | 158.5 |
| C | 14 | 238 | 131799 | 682.19 | 833 | 837 | 192.0 |
| C | 9 | 54 | 24460 | 123.05 | 833 | 837 | 192.0 |
| C | 0 | 10 | 19905 | 99.33 | 833 | 837 | 192.0 |
| D | 1 | 52 | 1687984 | 8383.29 | 844 | 823 | 201.3 |
| D | 7 | 238 | 126025 | 622.11 | 844 | 823 | 201.3 |
| D | 2 | 234 | 26178 | 125.99 | 844 | 823 | 201.3 |
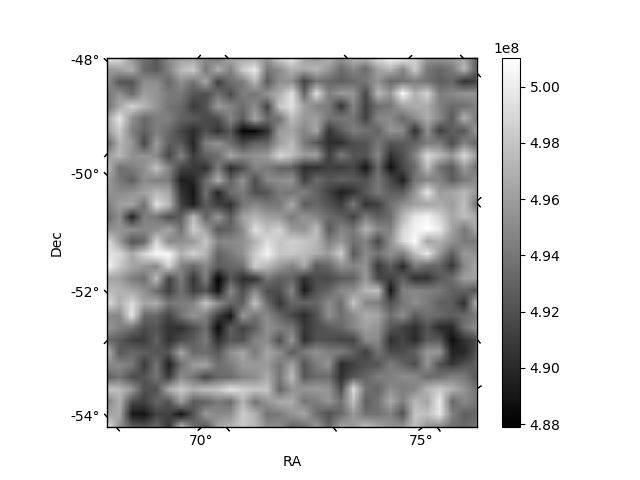
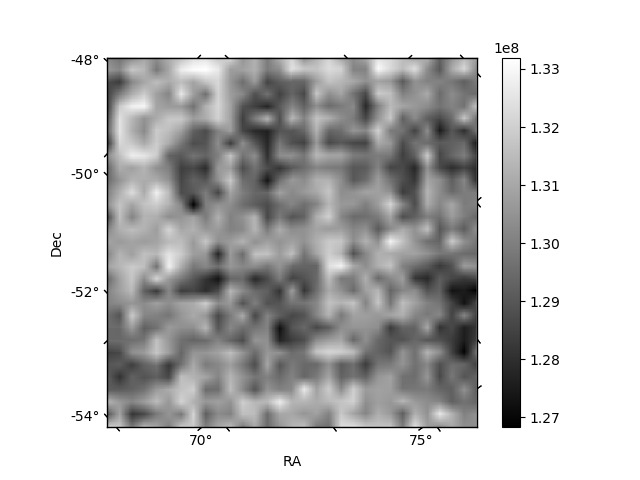
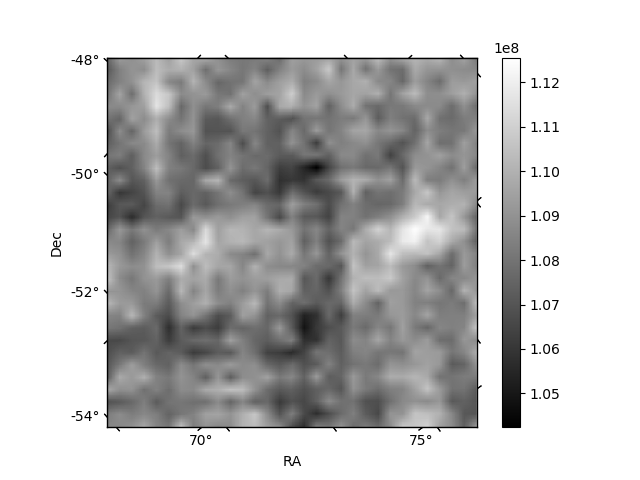
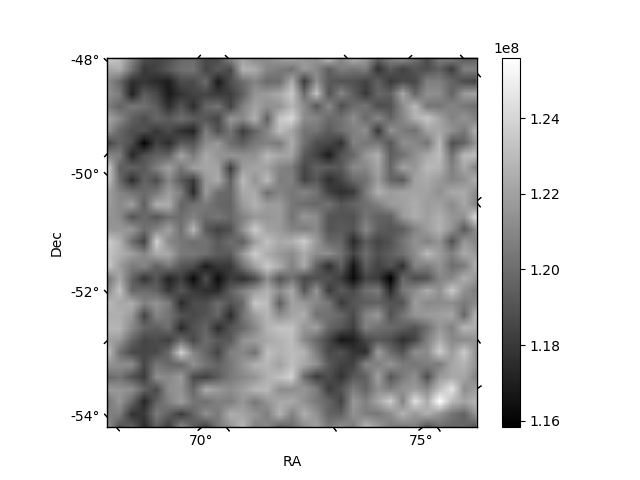
Histogram calculated using DETX and DETY for each event in the final _common_clean file
| Quadrant A | 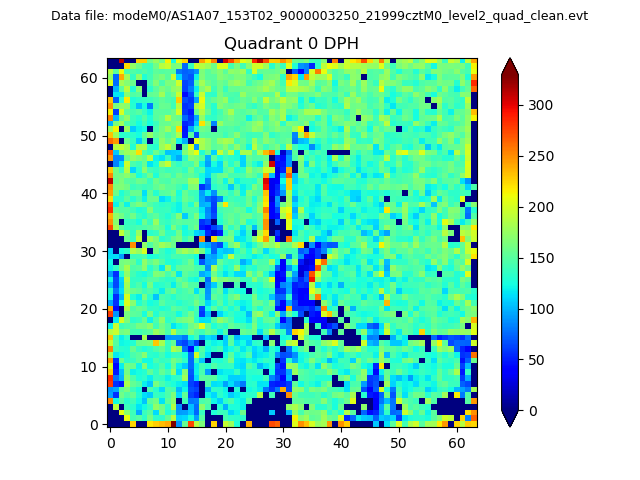 |
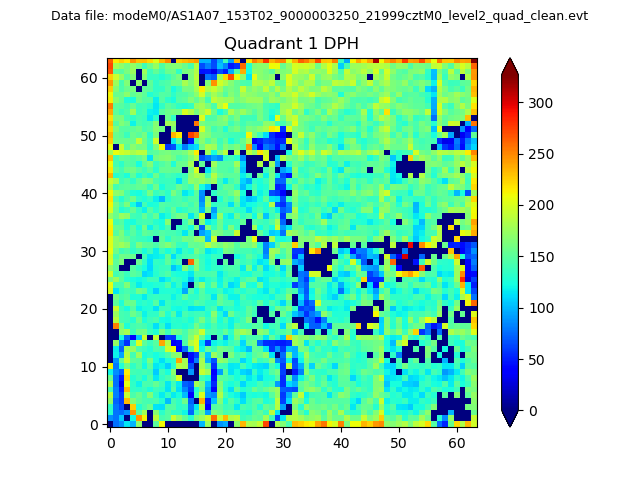 |
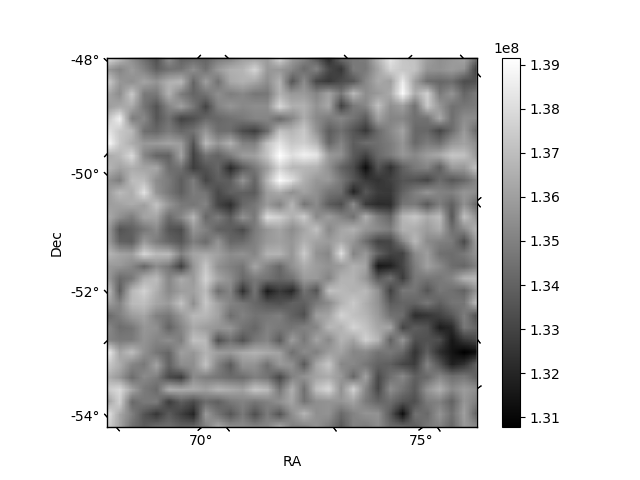
Quadrant B |
|---|---|---|---|
| Quadrant D | 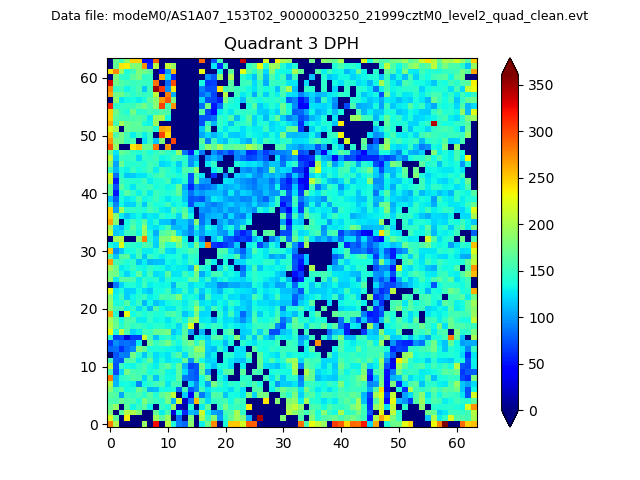 |
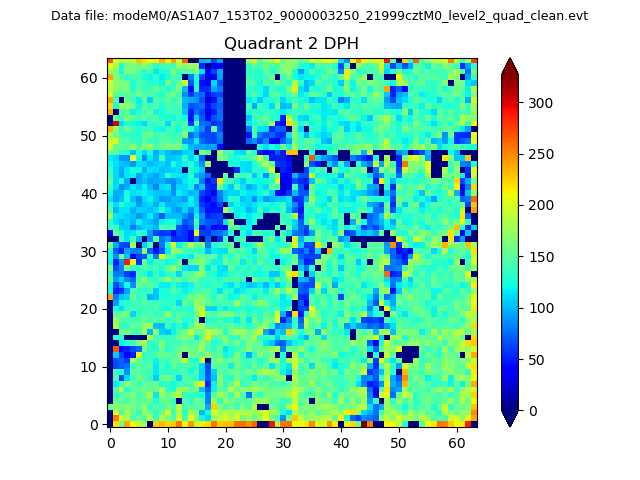 |
Quadrant C |
| Plot type | Count rate plots | Images |
|---|---|---|
| Comparison with Poisson distribution Blue bars denote a histogram of data divided into 1 sec bins. Red curve is a Poisson curve with rate = median count rate of data. |
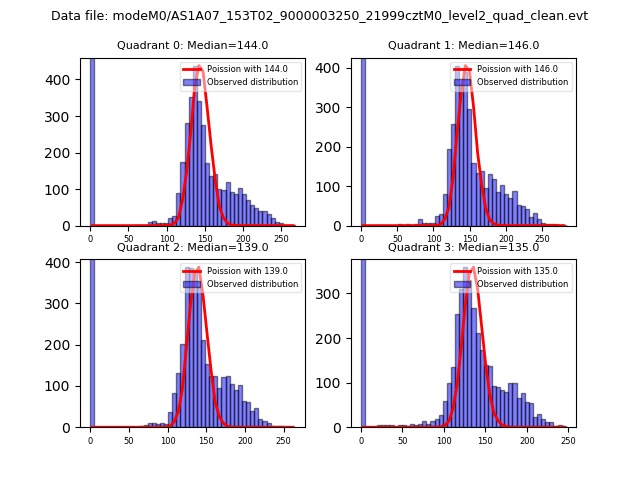 |
 |
| Quadrant-wise count rates Data is divided into 100 sec bins |
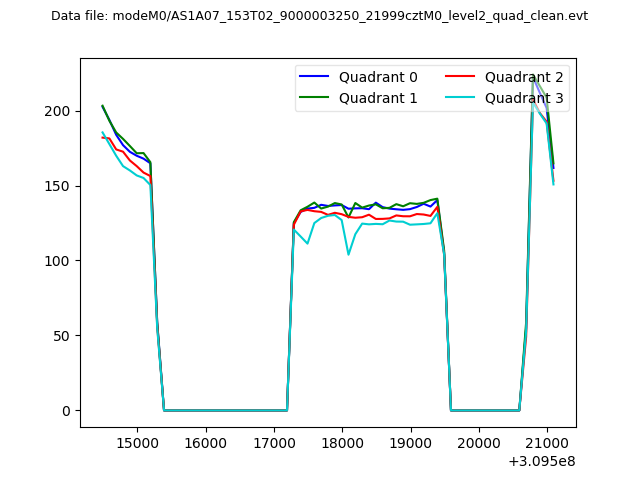 |
|
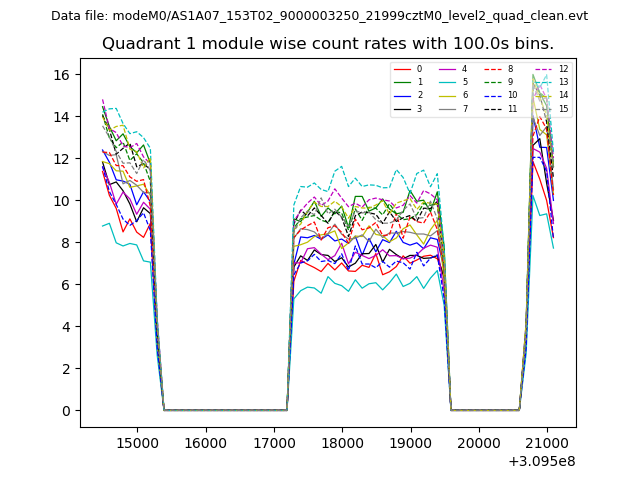
| Module-wise count rates for Quadrant A Data is divided into 100 sec bins |
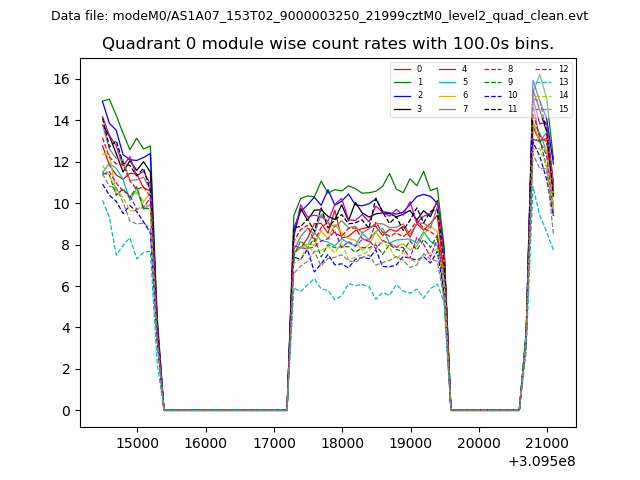 |
 |
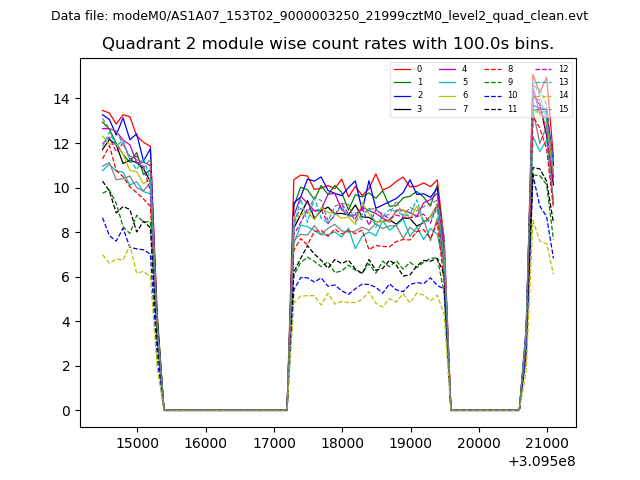
| Module-wise count rates for Quadrant B Data is divided into 100 sec bins |
 |
 |
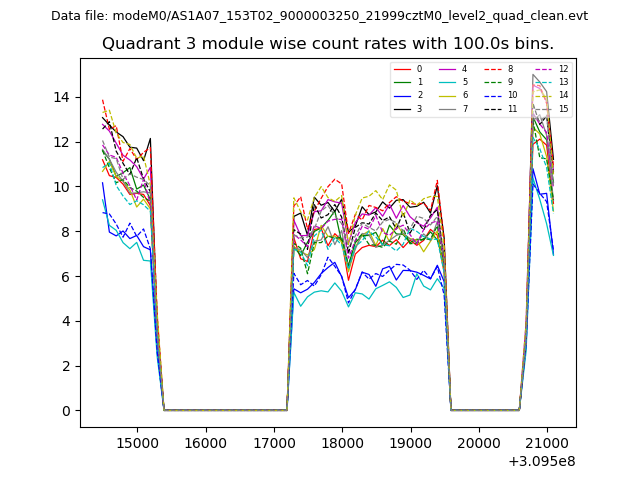
| Module-wise count rates for Quadrant C Data is divided into 100 sec bins |
 |
 |
| Module-wise count rates for Quadrant D Data is divided into 100 sec bins |
 |
 |
| Parameter | Plot |
|---|---|
| CZT HV Monitor | 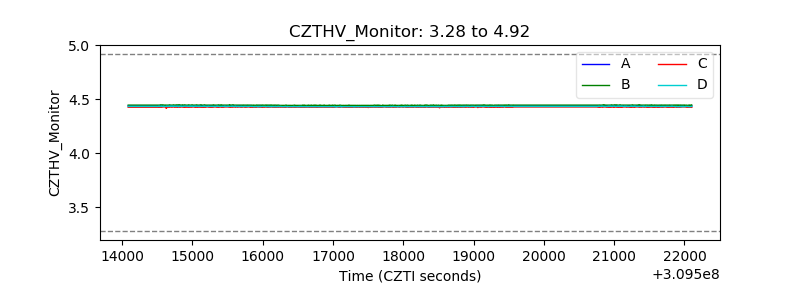 |
| D_VDD | 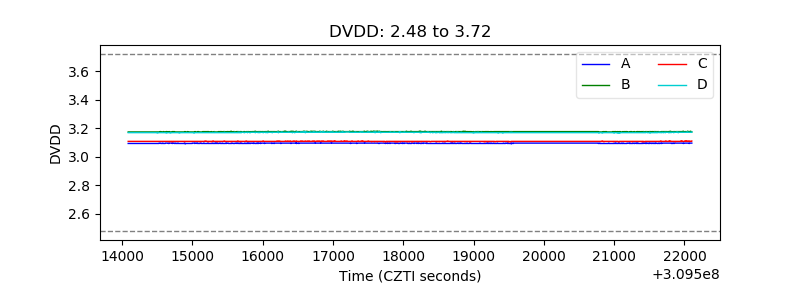 |
| Temperature 1 | 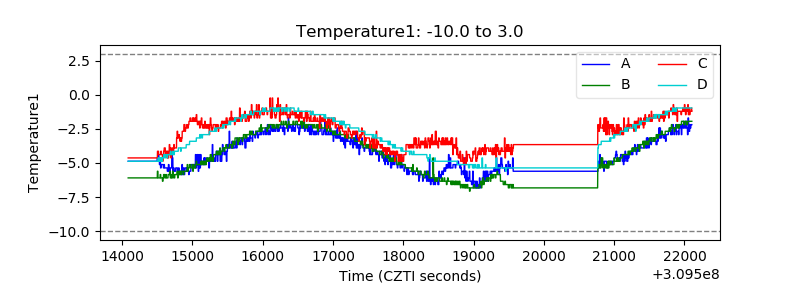 |
| Veto HV Monitor | 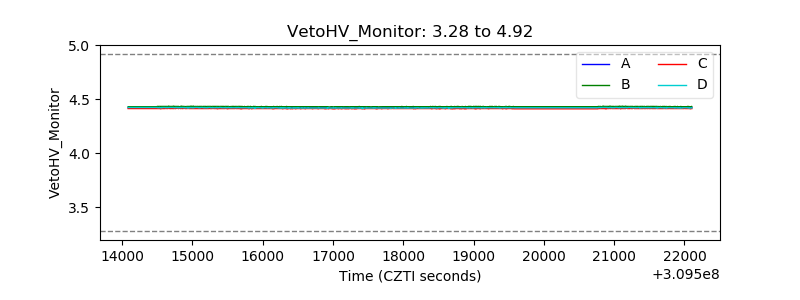 |
| Veto LLD | 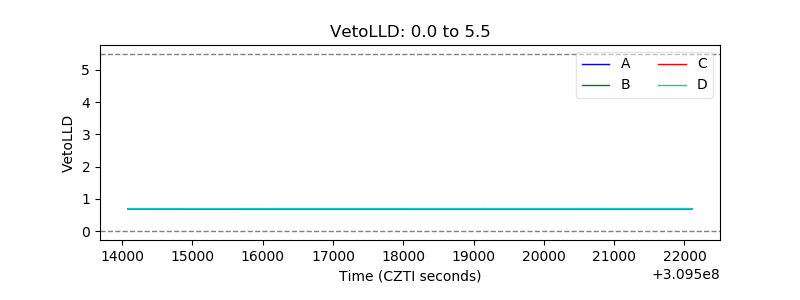 |
| Alpha Counter | 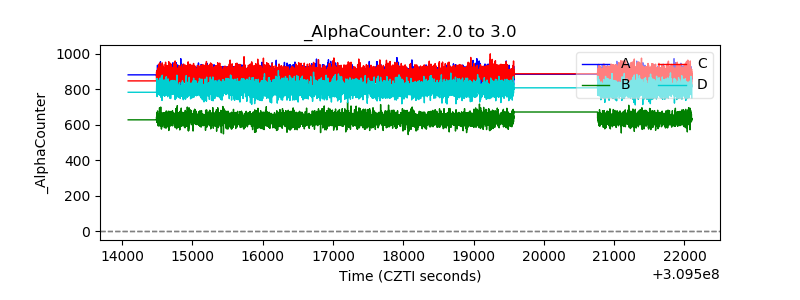 |
| _CPM_Rate | 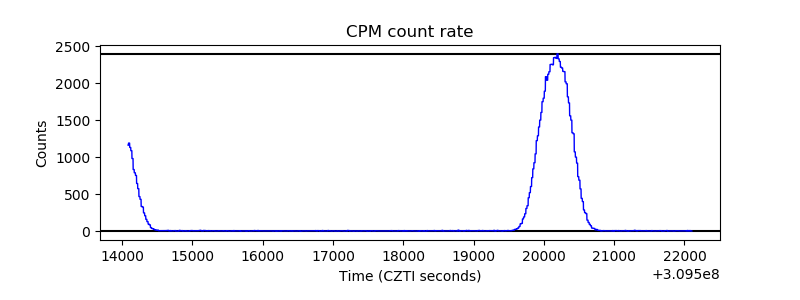 |
| CZT Counter | 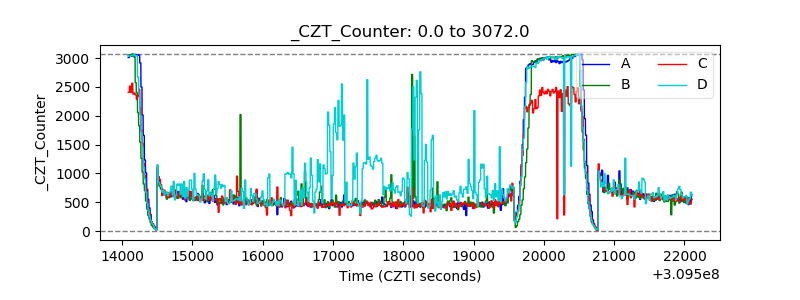 |
| +2.5 Volts monitor | 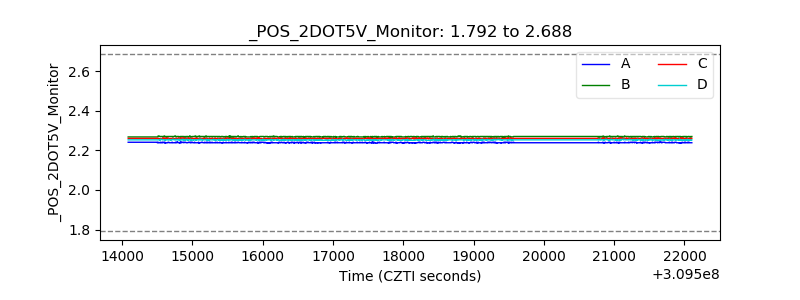 |
| +5 Volts monitor |  |
| _ROLL_ROT | 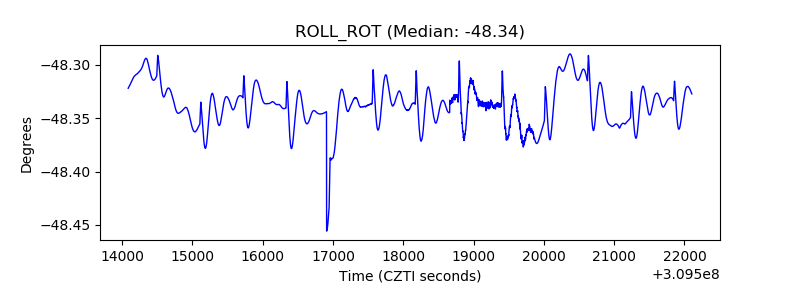 |
| _Roll_DEC | 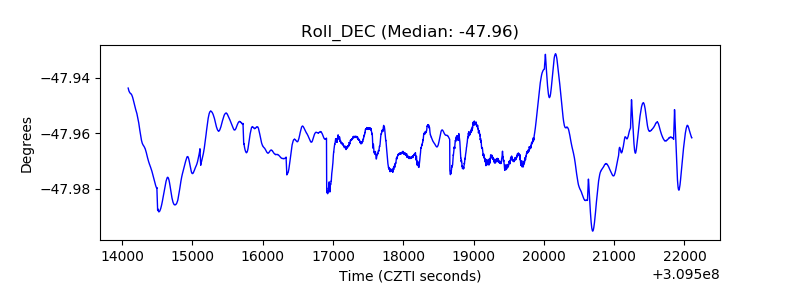 |
| _Roll_RA | 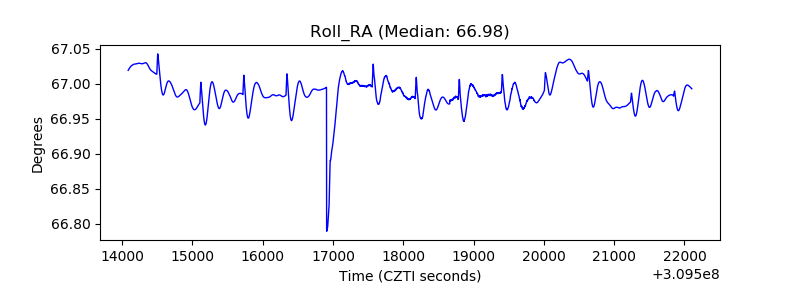 |
| Veto Counter | 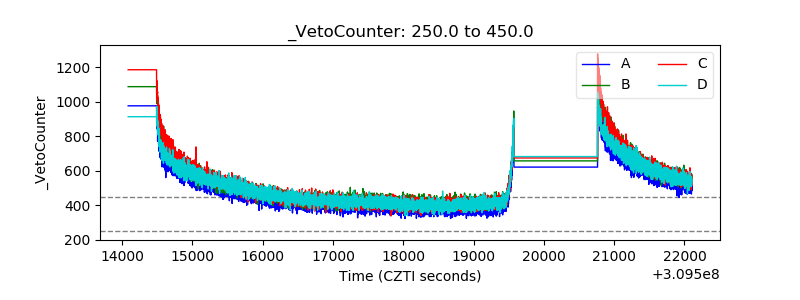 |