| Param | Original file | Final file |
|---|---|---|
| Filename | modeM0/AS1A07_153T02_9000003250_22000cztM0_level2.evt | modeM0/AS1A07_153T02_9000003250_22000cztM0_level2_quad_clean.evt |
| Size (bytes) | 542,894,400 | 74,142,720 |
| Size | 517.7 MB | 70.7 MB |
| Events in quadrant A | 3,702,945 | 457,010 |
| Events in quadrant B | 3,933,845 | 460,497 |
| Events in quadrant C | 3,661,627 | 436,005 |
| Events in quadrant D | 4,692,029 | 427,384 |
| Mode SS | |||
|---|---|---|---|
| Quadrant | BADHDUFLAG | Total packets | Discarded packets |
| A | 0 | 136 | 0 |
| B | 0 | 136 | 0 |
| C | 0 | 136 | 0 |
| D | 0 | 136 | 0 |
| Mode M0 | |||
|---|---|---|---|
| Quadrant | BADHDUFLAG | Total packets | Discarded packets |
| A | 0 | 15290 | 2 |
| B | 0 | 15927 | 2 |
| C | 0 | 15168 | 2 |
| D | 0 | 18813 | 2 |
| Mode M9 | |||
|---|---|---|---|
| Quadrant | BADHDUFLAG | Total packets | Discarded packets |
| A | 0 | 17 | 0 |
| B | 0 | 18 | 0 |
| C | 0 | 18 | 0 |
| D | 0 | 18 | 0 |
| Quadrant | Total seconds | Saturated seconds | Saturation percentage |
|---|---|---|---|
| A | 6654 | 107 | 1.608055% |
| B | 6654 | 127 | 1.908626% |
| C | 6654 | 146 | 2.194169% |
| D | 6654 | 179 | 2.690111% |
Noise dominated data is calculated using 1-second bins in cleaned event files. If a bin has >2000 counts, and if more than 50% of those come from <1% of pixels, then it is considered to be noise-dominated and hence unusable.
| Quadrant | # 1 sec bins | Bins with >0 counts | Bins with >2000 counts | High rate bins dominated by noise | Noise dominated (total time) | Noise dominated (detector-on time) | Marked lightcurve |
|---|---|---|---|---|---|---|---|
| A | 7939 | 6654 | 0 | 0 | 0.00% | 0.00% | 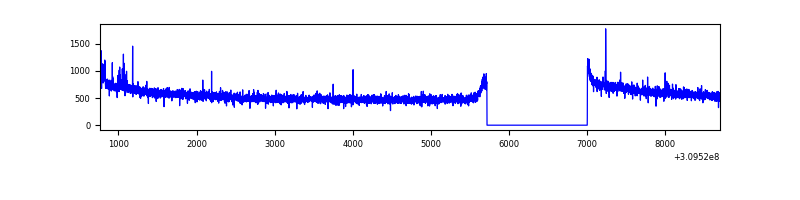 |
| B | 7939 | 6654 | 11 | 11 | 0.14% | 0.17% | 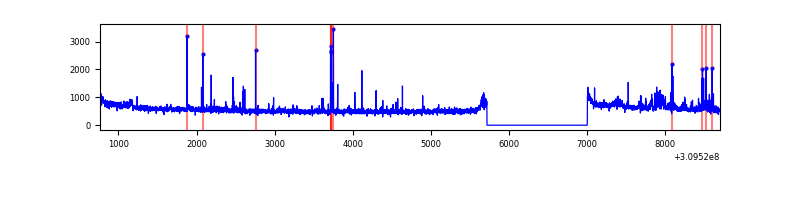 |
| C | 7939 | 6654 | 0 | 0 | 0.00% | 0.00% | 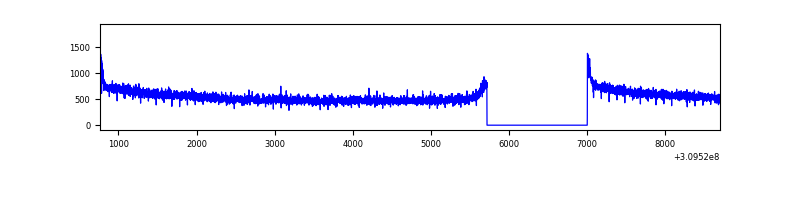 |
| D | 7939 | 6654 | 101 | 101 | 1.27% | 1.52% | 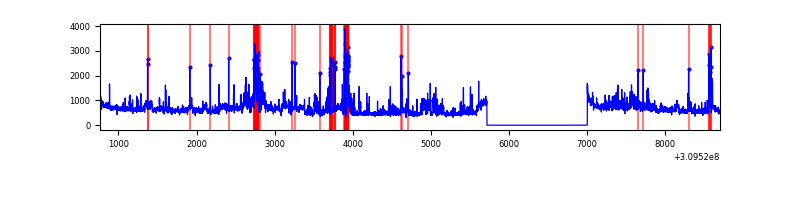 |
Top three noisy pixels from each quadrant. If the there are fewer than three noisy pixels in the level2.evt file, extra rows are filled as -1
| Pixel properties | Quadrant properties | ||||||
|---|---|---|---|---|---|---|---|
| Quadrant | DetID | PixID | Counts | Sigma | Mean | Median | Sigma |
| A | 15 | 236 | 36114 | 192.59 | 949 | 936 | 182.7 |
| A | 13 | 254 | 11324 | 56.87 | 949 | 936 | 182.7 |
| A | 0 | 226 | 8398 | 40.85 | 949 | 936 | 182.7 |
| B | 3 | 64 | 91094 | 528.78 | 936 | 920 | 170.5 |
| B | 0 | 230 | 67964 | 393.15 | 936 | 920 | 170.5 |
| B | 0 | 197 | 65982 | 381.53 | 936 | 920 | 170.5 |
| C | 14 | 238 | 143435 | 695.56 | 898 | 906 | 204.9 |
| C | 0 | 10 | 19340 | 89.96 | 898 | 906 | 204.9 |
| C | 13 | 61 | 6232 | 25.99 | 898 | 906 | 204.9 |
| D | 1 | 52 | 904389 | 4189.72 | 911 | 886 | 215.6 |
| D | 7 | 238 | 200754 | 926.83 | 911 | 886 | 215.6 |
| D | 13 | 172 | 37812 | 171.23 | 911 | 886 | 215.6 |
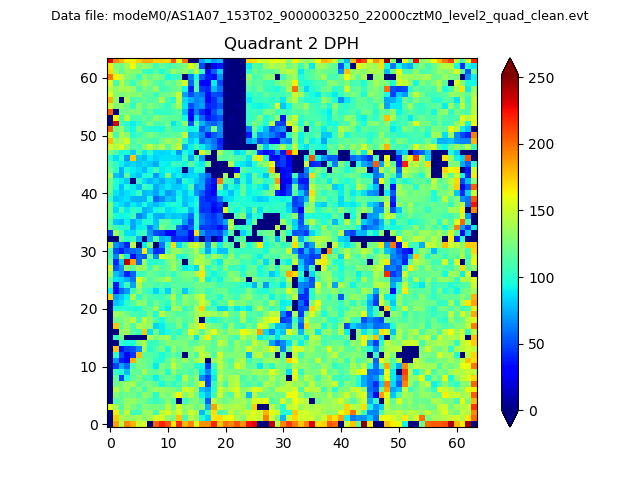
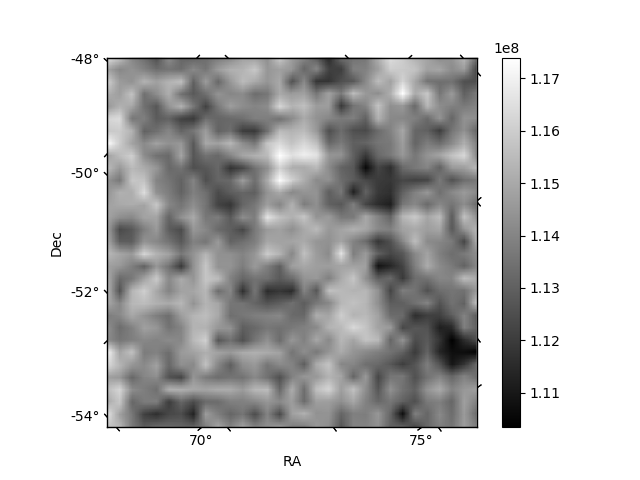
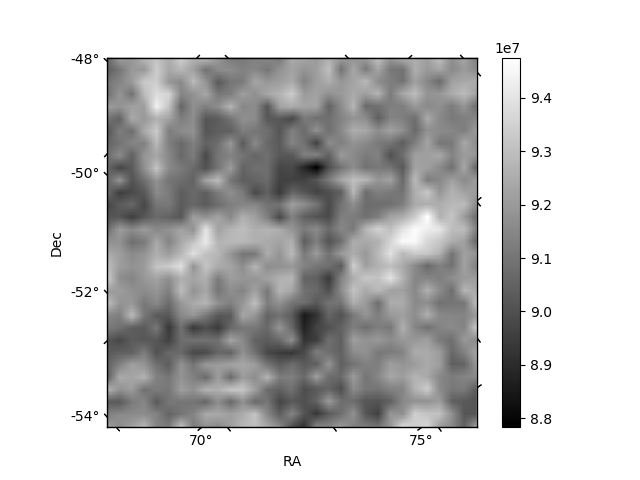
Histogram calculated using DETX and DETY for each event in the final _common_clean file
| Quadrant A | 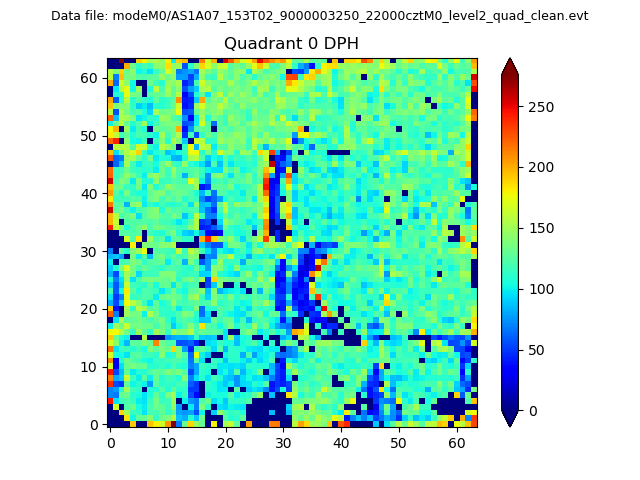 |
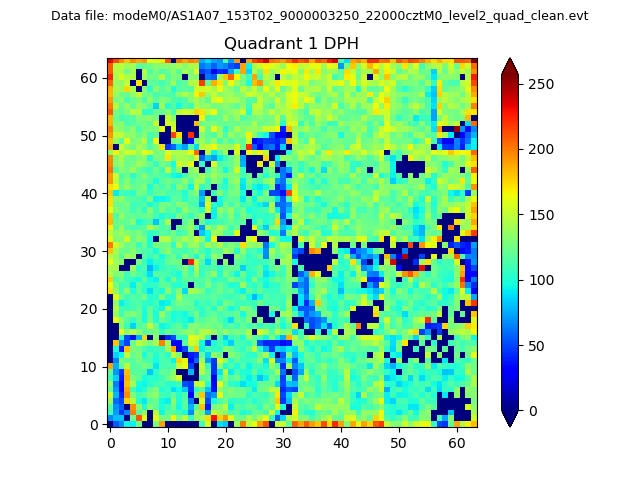 |
Quadrant B |
|---|---|---|---|
| Quadrant D | 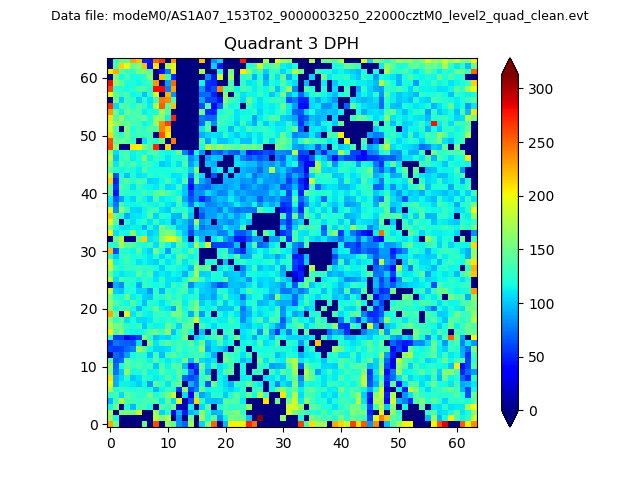 |
 |
Quadrant C |
| Plot type | Count rate plots | Images |
|---|---|---|
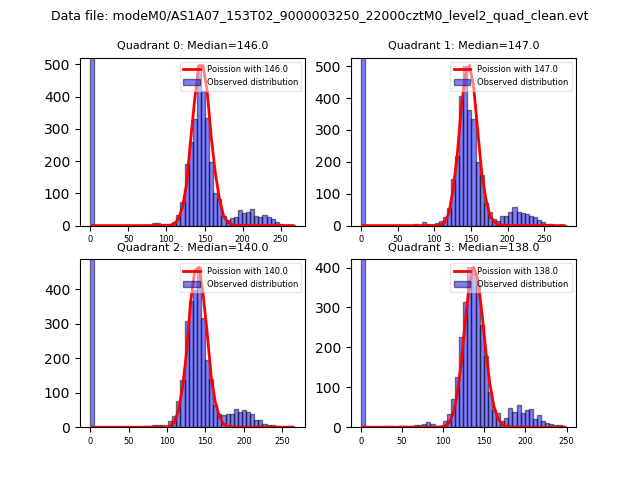
| Comparison with Poisson distribution Blue bars denote a histogram of data divided into 1 sec bins. Red curve is a Poisson curve with rate = median count rate of data. |
 |
 |
| Quadrant-wise count rates Data is divided into 100 sec bins |
 |
|
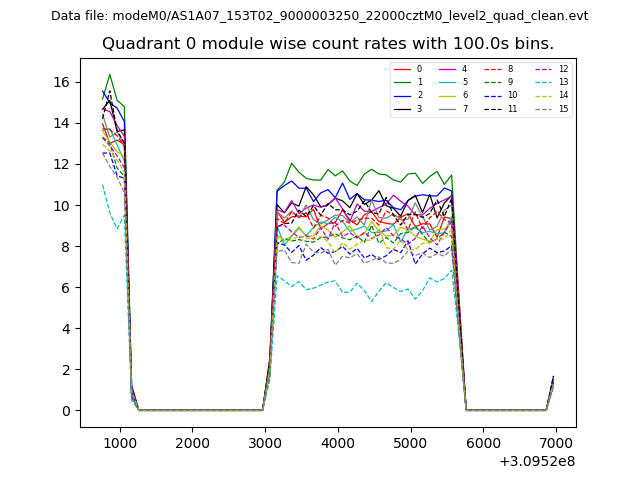
| Module-wise count rates for Quadrant A Data is divided into 100 sec bins |
 |
 |
| Module-wise count rates for Quadrant B Data is divided into 100 sec bins |
 |
 |
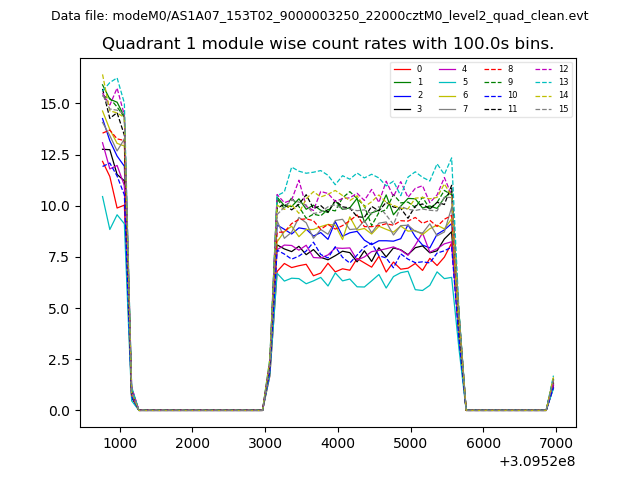
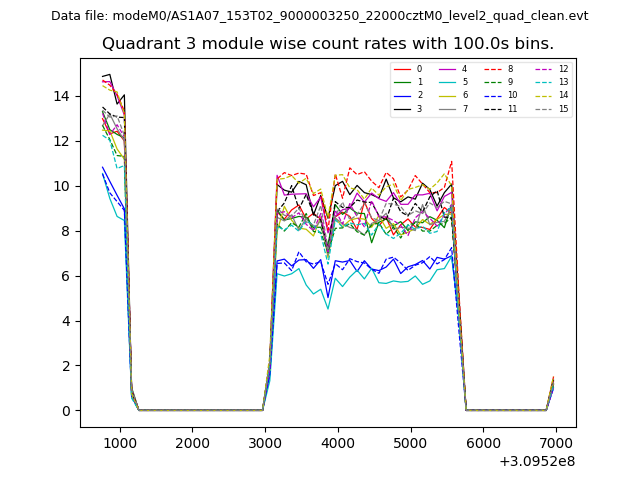
| Module-wise count rates for Quadrant C Data is divided into 100 sec bins |
 |
 |
| Module-wise count rates for Quadrant D Data is divided into 100 sec bins |
 |
 |
| Parameter | Plot |
|---|---|
| CZT HV Monitor |  |
| D_VDD | 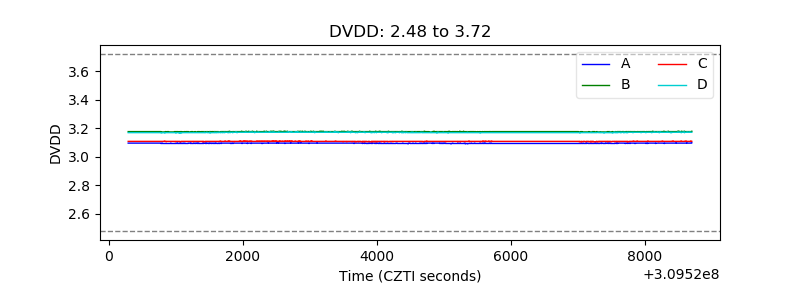 |
| Temperature 1 | 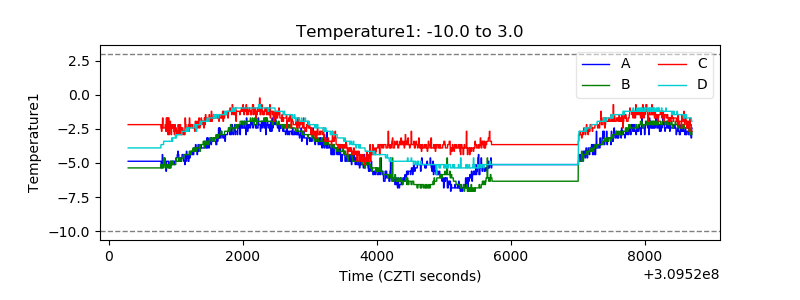 |
| Veto HV Monitor | 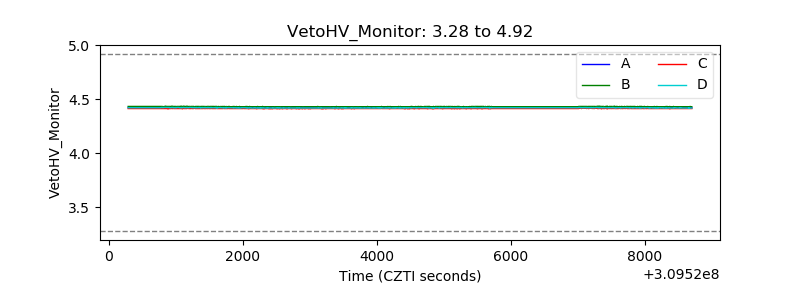 |
| Veto LLD | 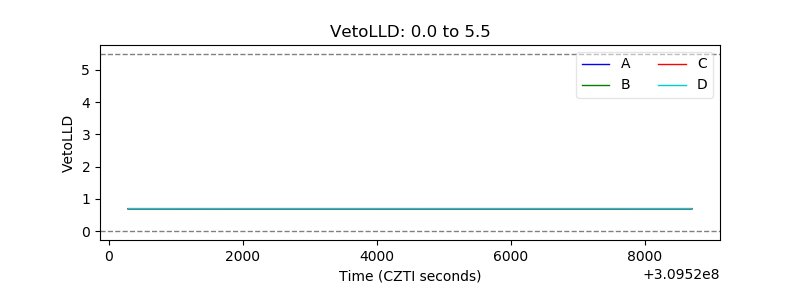 |
| Alpha Counter | 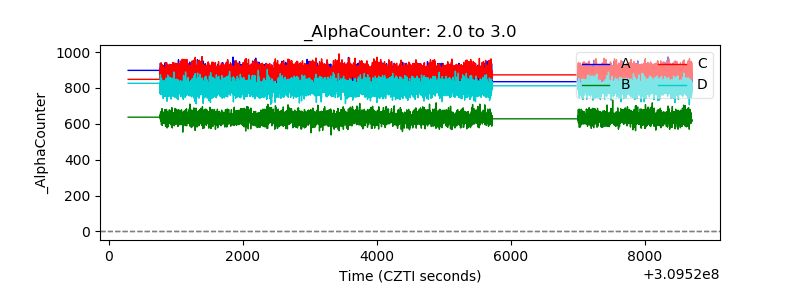 |
| _CPM_Rate | 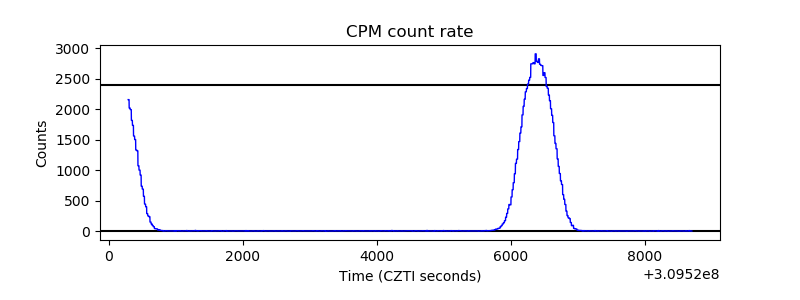 |
| CZT Counter | 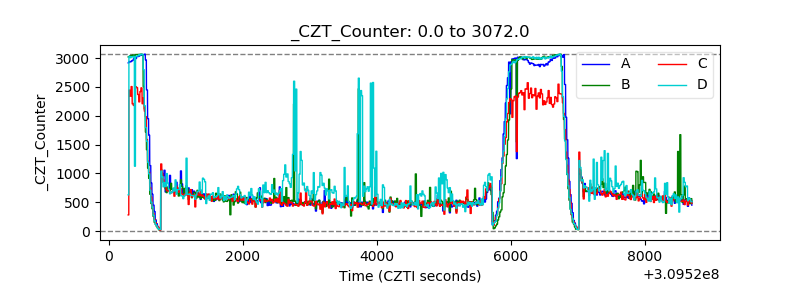 |
| +2.5 Volts monitor |  |
| +5 Volts monitor |  |
| _ROLL_ROT | 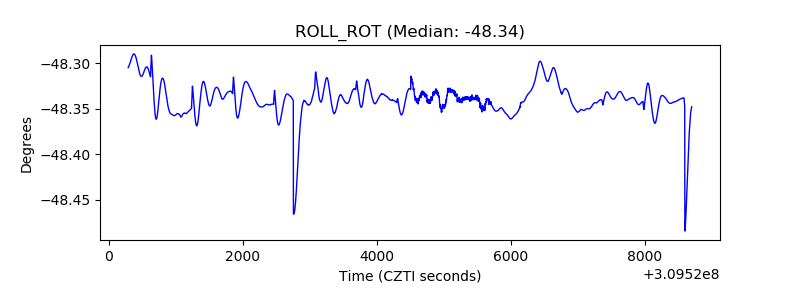 |
| _Roll_DEC | 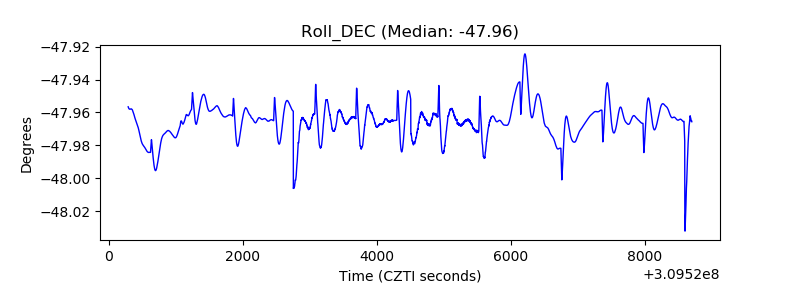 |
| _Roll_RA | 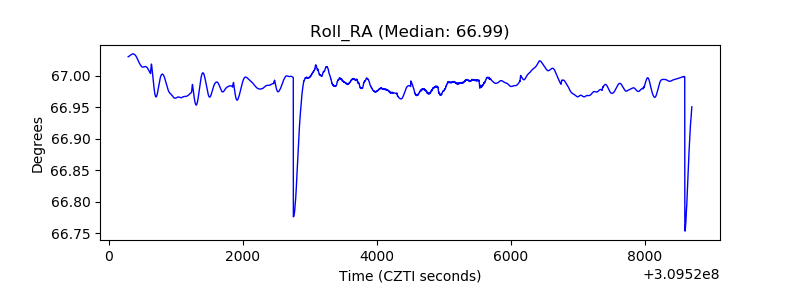 |
| Veto Counter | 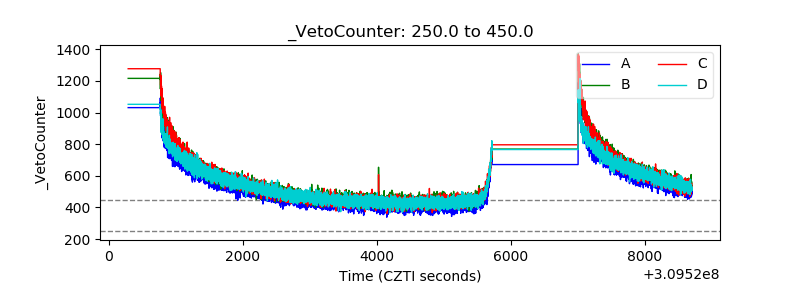 |