| Param | Original file | Final file |
|---|---|---|
| Filename | modeM0/AS1A07_153T02_9000003250_22004cztM0_level2.evt | modeM0/AS1A07_153T02_9000003250_22004cztM0_level2_quad_clean.evt |
| Size (bytes) | 592,637,760 | 102,741,120 |
| Size | 565.2 MB | 98.0 MB |
| Events in quadrant A | 3,377,633 | 686,064 |
| Events in quadrant B | 3,589,649 | 695,723 |
| Events in quadrant C | 3,382,615 | 653,708 |
| Events in quadrant D | 7,131,315 | 595,982 |
| Mode SS | |||
|---|---|---|---|
| Quadrant | BADHDUFLAG | Total packets | Discarded packets |
| A | 0 | 144 | 0 |
| B | 0 | 144 | 0 |
| C | 0 | 144 | 0 |
| D | 0 | 144 | 0 |
| Mode M0 | |||
|---|---|---|---|
| Quadrant | BADHDUFLAG | Total packets | Discarded packets |
| A | 0 | 14342 | 2 |
| B | 0 | 14970 | 2 |
| C | 0 | 14346 | 2 |
| D | 0 | 26028 | 6 |
| Mode M9 | |||
|---|---|---|---|
| Quadrant | BADHDUFLAG | Total packets | Discarded packets |
| A | 0 | 20 | 0 |
| B | 0 | 20 | 0 |
| C | 0 | 20 | 0 |
| D | 0 | 20 | 0 |
| Quadrant | Total seconds | Saturated seconds | Saturation percentage |
|---|---|---|---|
| A | 6878 | 110 | 1.599302% |
| B | 6879 | 171 | 2.485826% |
| C | 6879 | 138 | 2.006106% |
| D | 6878 | 1079 | 15.687700% |
Noise dominated data is calculated using 1-second bins in cleaned event files. If a bin has >2000 counts, and if more than 50% of those come from <1% of pixels, then it is considered to be noise-dominated and hence unusable.
| Quadrant | # 1 sec bins | Bins with >0 counts | Bins with >2000 counts | High rate bins dominated by noise | Noise dominated (total time) | Noise dominated (detector-on time) | Marked lightcurve |
|---|---|---|---|---|---|---|---|
| A | 8968 | 6878 | 3 | 3 | 0.03% | 0.04% | 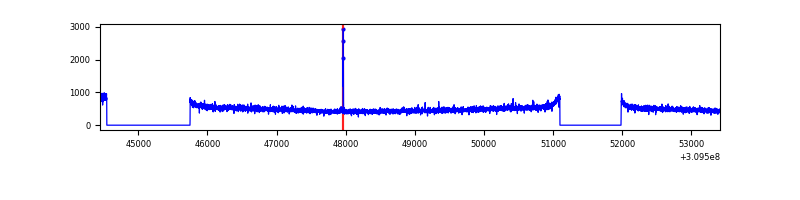 |
| B | 8969 | 6879 | 15 | 15 | 0.17% | 0.22% | 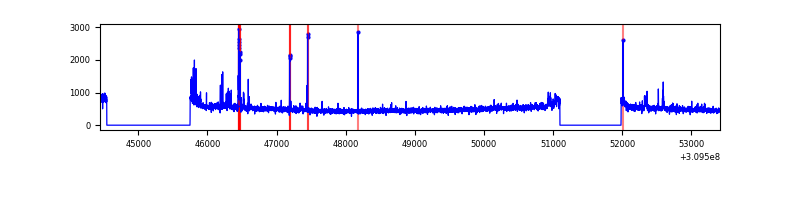 |
| C | 8969 | 6880 | 0 | 0 | 0.00% | 0.00% | 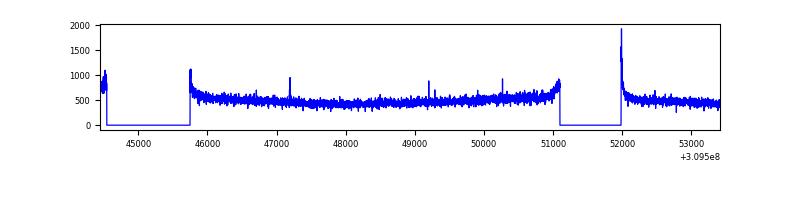 |
| D | 8968 | 6880 | 912 | 912 | 10.17% | 13.26% | 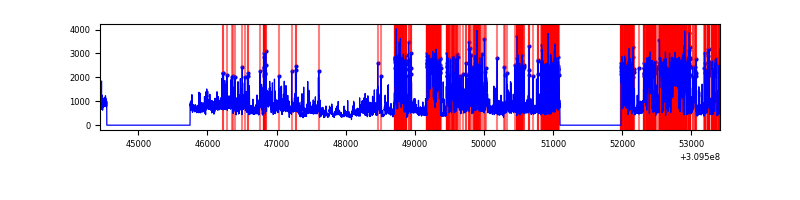 |
Top three noisy pixels from each quadrant. If the there are fewer than three noisy pixels in the level2.evt file, extra rows are filled as -1
| Pixel properties | Quadrant properties | ||||||
|---|---|---|---|---|---|---|---|
| Quadrant | DetID | PixID | Counts | Sigma | Mean | Median | Sigma |
| A | 2 | 79 | 13719 | 74.28 | 872 | 855 | 173.2 |
| A | 13 | 254 | 11614 | 62.12 | 872 | 855 | 173.2 |
| A | 0 | 226 | 7501 | 38.37 | 872 | 855 | 173.2 |
| B | 0 | 190 | 79218 | 481.56 | 869 | 847 | 162.7 |
| B | 3 | 64 | 61998 | 375.75 | 869 | 847 | 162.7 |
| B | 0 | 230 | 19411 | 114.07 | 869 | 847 | 162.7 |
| C | 14 | 238 | 132360 | 687.65 | 828 | 834 | 191.3 |
| C | 0 | 10 | 18601 | 92.89 | 828 | 834 | 191.3 |
| C | 13 | 61 | 5772 | 25.81 | 828 | 834 | 191.3 |
| D | 7 | 238 | 3502379 | 18434.12 | 789 | 767 | 190.0 |
| D | 11 | 176 | 413383 | 2172.2 | 789 | 767 | 190.0 |
| D | 1 | 52 | 124400 | 650.86 | 789 | 767 | 190.0 |
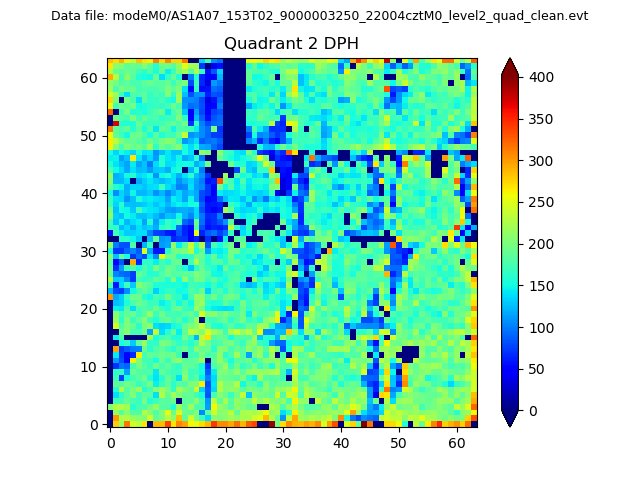
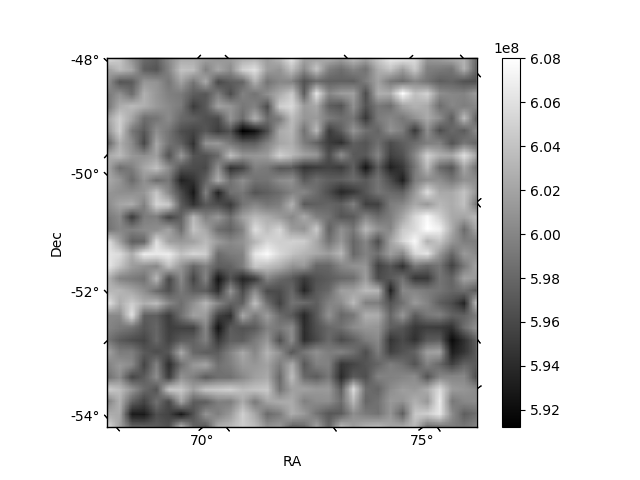
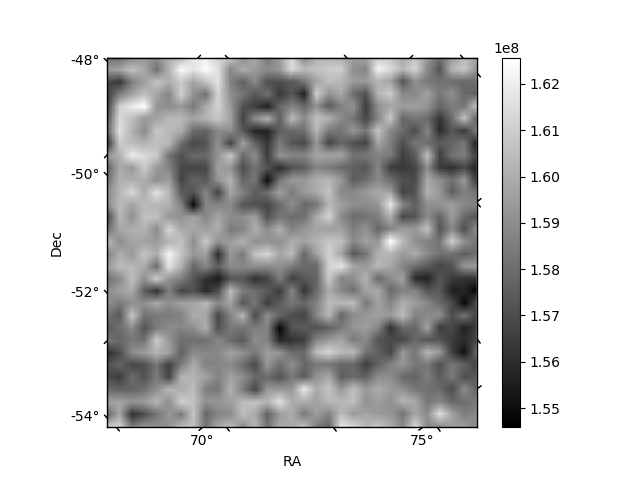
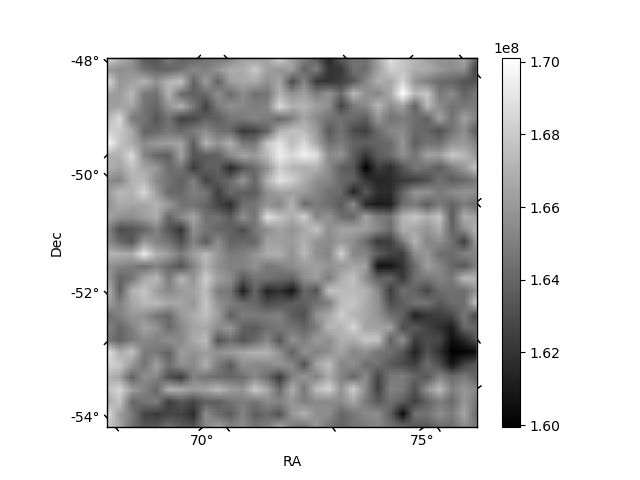
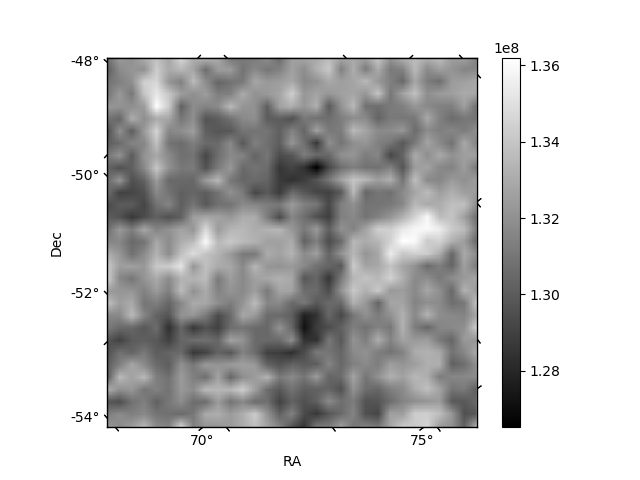
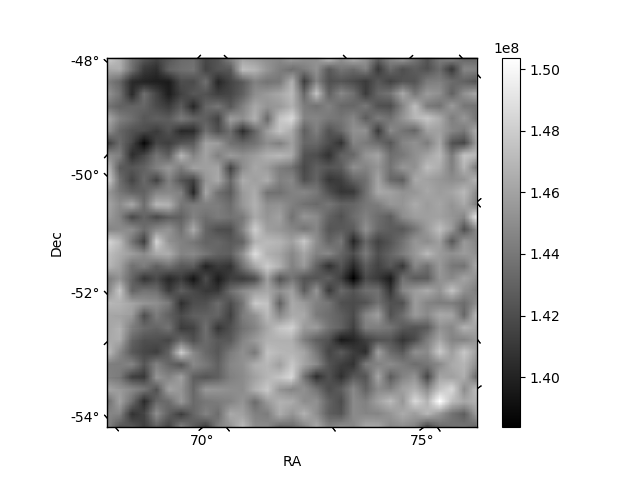
Histogram calculated using DETX and DETY for each event in the final _common_clean file
| Quadrant A | 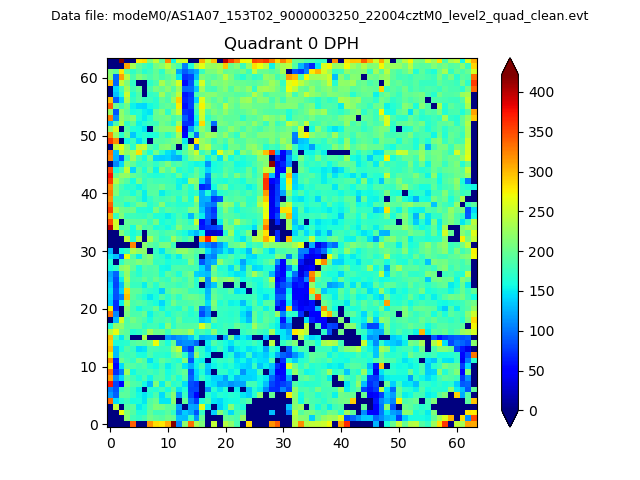 |
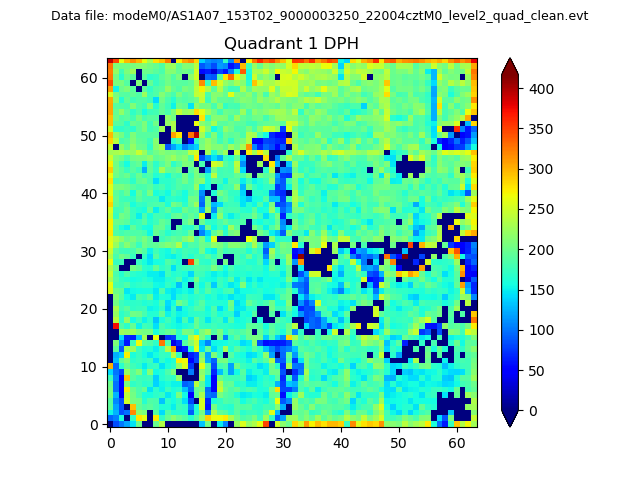 |
Quadrant B |
|---|---|---|---|
| Quadrant D | 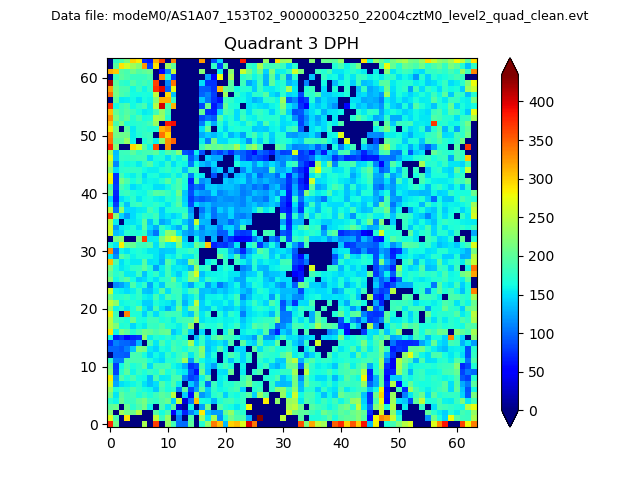 |
 |
Quadrant C |
| Plot type | Count rate plots | Images |
|---|---|---|
| Comparison with Poisson distribution Blue bars denote a histogram of data divided into 1 sec bins. Red curve is a Poisson curve with rate = median count rate of data. |
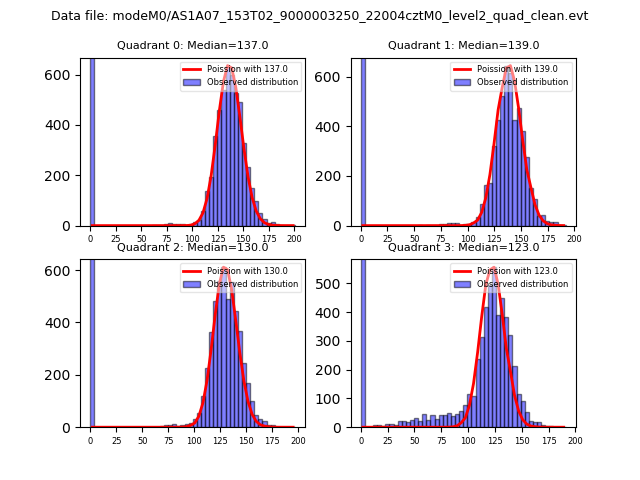 |
 |
| Quadrant-wise count rates Data is divided into 100 sec bins |
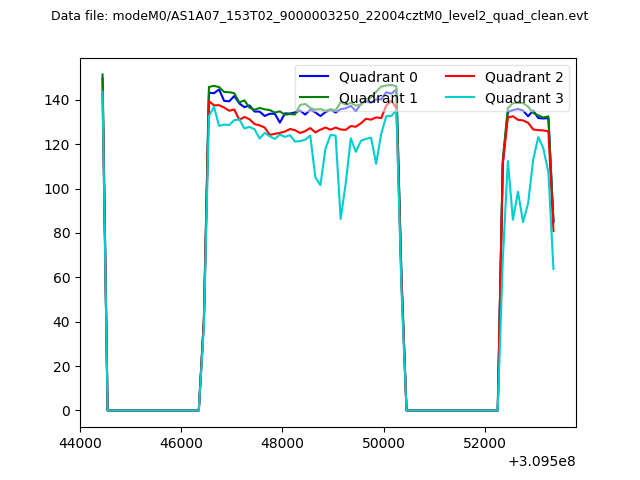 |
|
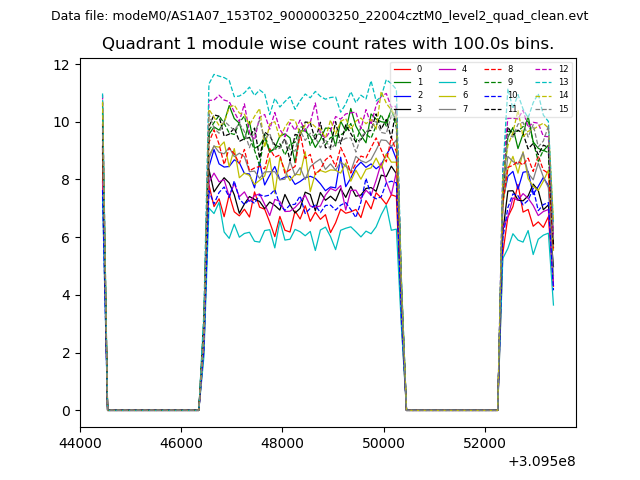
| Module-wise count rates for Quadrant A Data is divided into 100 sec bins |
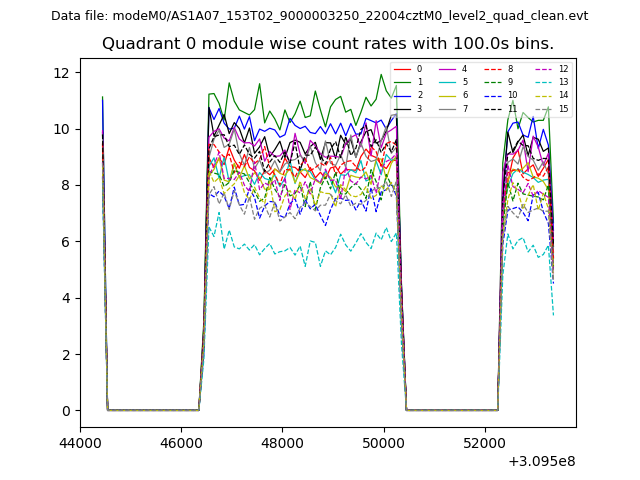 |
 |
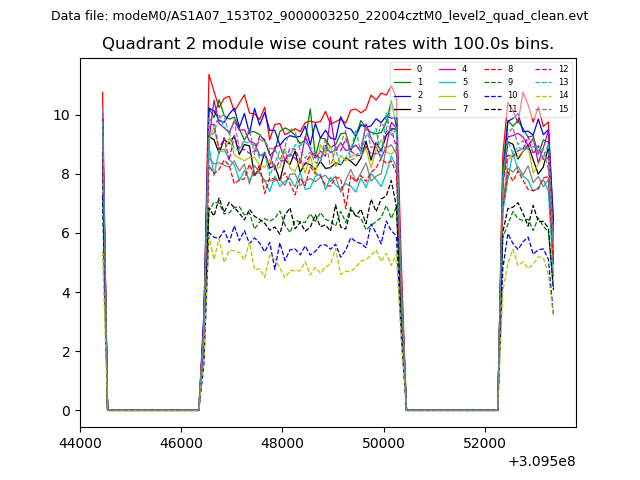
| Module-wise count rates for Quadrant B Data is divided into 100 sec bins |
 |
 |
| Module-wise count rates for Quadrant C Data is divided into 100 sec bins |
 |
 |
| Module-wise count rates for Quadrant D Data is divided into 100 sec bins |
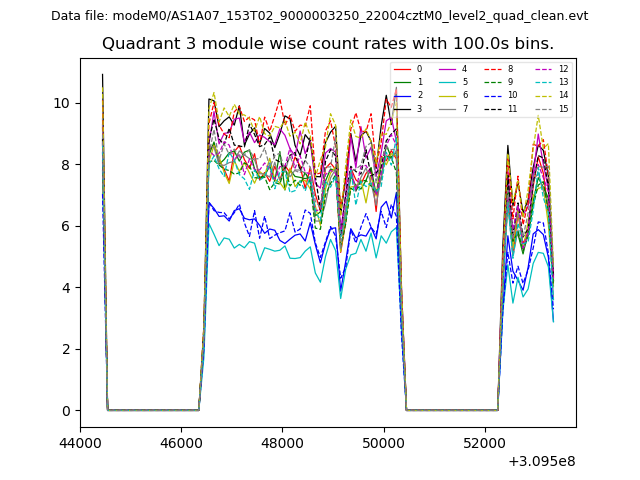 |
 |
| Parameter | Plot |
|---|---|
| CZT HV Monitor | 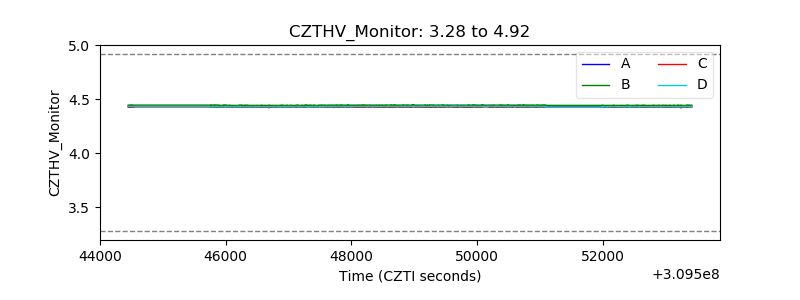 |
| D_VDD | 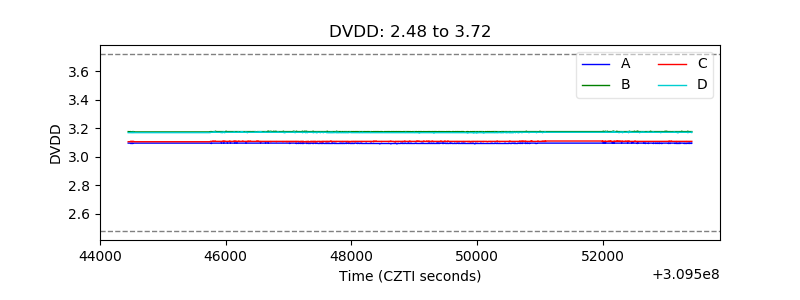 |
| Temperature 1 | 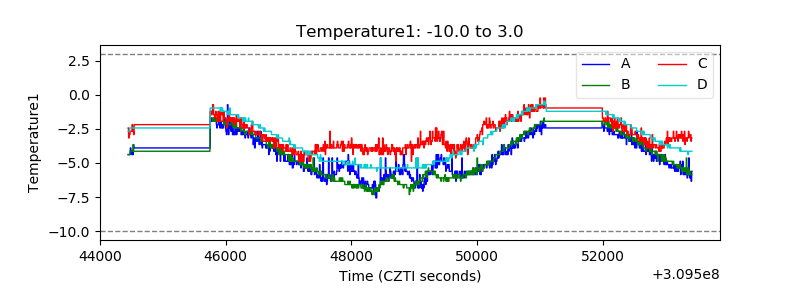 |
| Veto HV Monitor |  |
| Veto LLD | 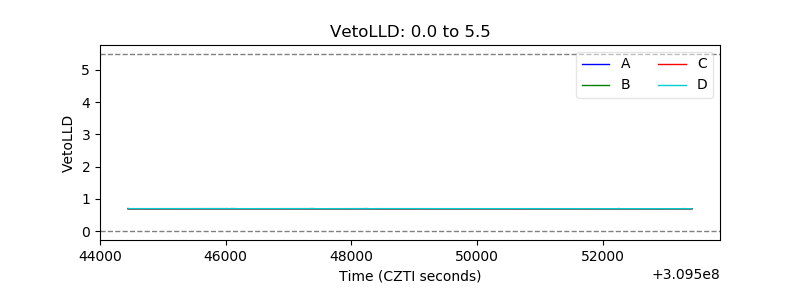 |
| Alpha Counter | 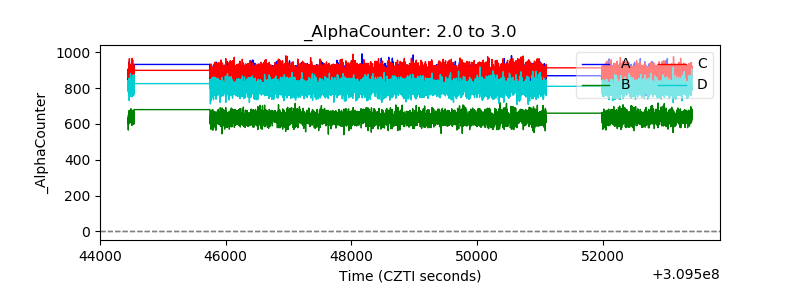 |
| _CPM_Rate |  |
| CZT Counter | 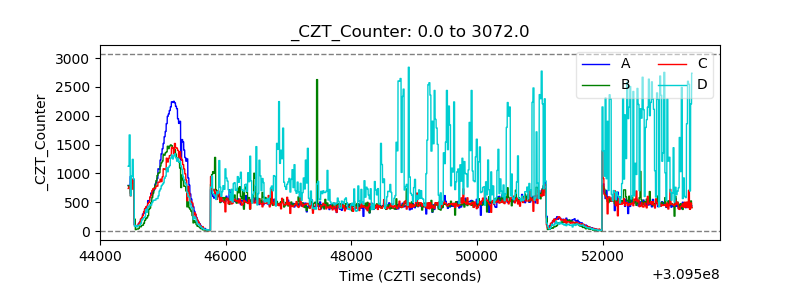 |
| +2.5 Volts monitor |  |
| +5 Volts monitor |  |
| _ROLL_ROT | 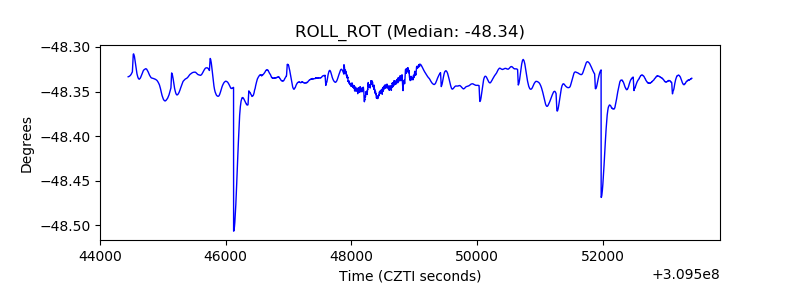 |
| _Roll_DEC | 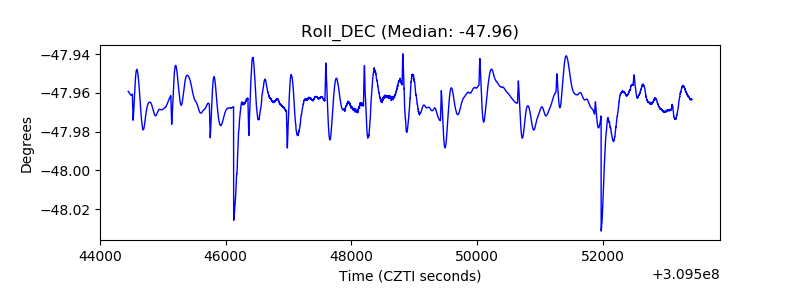 |
| _Roll_RA | 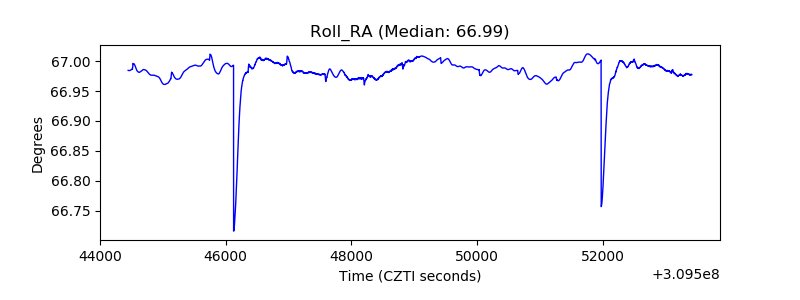 |
| Veto Counter | 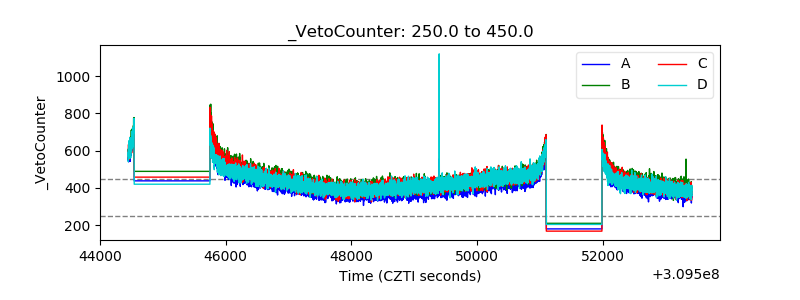 |