| Param | Original file | Final file |
|---|---|---|
| Filename | modeM0/AS1A07_153T02_9000003250_22005cztM0_level2.evt | modeM0/AS1A07_153T02_9000003250_22005cztM0_level2_quad_clean.evt |
| Size (bytes) | 591,978,240 | 104,774,400 |
| Size | 564.6 MB | 99.9 MB |
| Events in quadrant A | 3,529,765 | 694,544 |
| Events in quadrant B | 3,660,876 | 705,534 |
| Events in quadrant C | 3,534,018 | 662,890 |
| Events in quadrant D | 6,704,029 | 597,364 |
| Mode SS | |||
|---|---|---|---|
| Quadrant | BADHDUFLAG | Total packets | Discarded packets |
| A | 0 | 154 | 0 |
| B | 0 | 154 | 0 |
| C | 0 | 154 | 0 |
| D | 0 | 154 | 0 |
| Mode M0 | |||
|---|---|---|---|
| Quadrant | BADHDUFLAG | Total packets | Discarded packets |
| A | 0 | 15261 | 2 |
| B | 0 | 15625 | 2 |
| C | 0 | 15239 | 2 |
| D | 0 | 24903 | 2 |
| Mode M9 | |||
|---|---|---|---|
| Quadrant | BADHDUFLAG | Total packets | Discarded packets |
| A | 0 | 12 | 0 |
| B | 0 | 12 | 0 |
| C | 0 | 12 | 0 |
| D | 0 | 12 | 0 |
| Quadrant | Total seconds | Saturated seconds | Saturation percentage |
|---|---|---|---|
| A | 7353 | 62 | 0.843193% |
| B | 7352 | 121 | 1.645811% |
| C | 7352 | 112 | 1.523395% |
| D | 7352 | 1095 | 14.893906% |
Noise dominated data is calculated using 1-second bins in cleaned event files. If a bin has >2000 counts, and if more than 50% of those come from <1% of pixels, then it is considered to be noise-dominated and hence unusable.
| Quadrant | # 1 sec bins | Bins with >0 counts | Bins with >2000 counts | High rate bins dominated by noise | Noise dominated (total time) | Noise dominated (detector-on time) | Marked lightcurve |
|---|---|---|---|---|---|---|---|
| A | 8673 | 7354 | 1 | 1 | 0.01% | 0.01% | 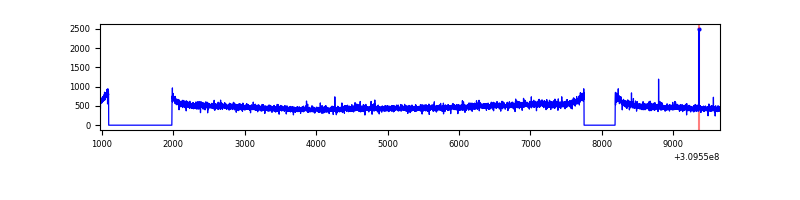 |
| B | 8672 | 7353 | 1 | 1 | 0.01% | 0.01% | 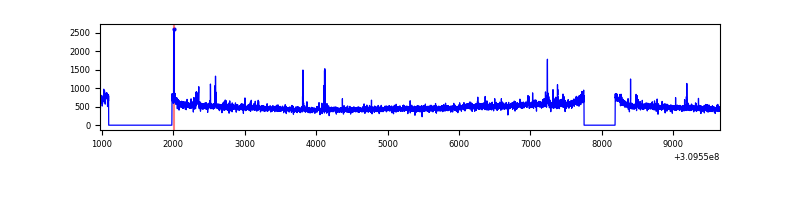 |
| C | 8672 | 7354 | 0 | 0 | 0.00% | 0.00% | 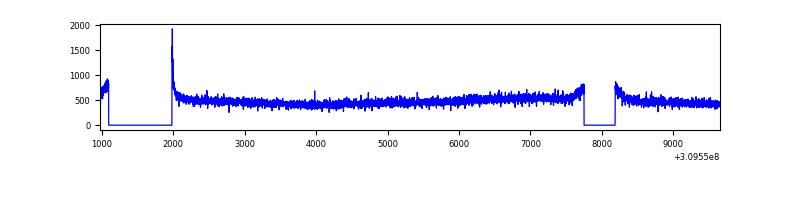 |
| D | 8672 | 7354 | 946 | 946 | 10.91% | 12.86% | 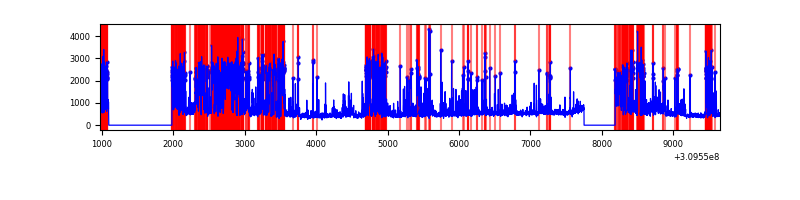 |
Top three noisy pixels from each quadrant. If the there are fewer than three noisy pixels in the level2.evt file, extra rows are filled as -1
| Pixel properties | Quadrant properties | ||||||
|---|---|---|---|---|---|---|---|
| Quadrant | DetID | PixID | Counts | Sigma | Mean | Median | Sigma |
| A | 15 | 236 | 20074 | 104.77 | 908 | 889 | 183.1 |
| A | 13 | 254 | 12736 | 64.69 | 908 | 889 | 183.1 |
| A | 3 | 137 | 7742 | 37.42 | 908 | 889 | 183.1 |
| B | 0 | 190 | 31070 | 174.43 | 910 | 885 | 173.0 |
| B | 3 | 64 | 28000 | 156.69 | 910 | 885 | 173.0 |
| B | 0 | 230 | 23629 | 131.43 | 910 | 885 | 173.0 |
| C | 14 | 238 | 136965 | 672.75 | 867 | 873 | 202.3 |
| C | 0 | 10 | 14107 | 65.42 | 867 | 873 | 202.3 |
| C | 13 | 61 | 6041 | 25.55 | 867 | 873 | 202.3 |
| D | 7 | 238 | 2783040 | 14004.8 | 824 | 799 | 198.7 |
| D | 11 | 176 | 526626 | 2646.82 | 824 | 799 | 198.7 |
| D | 1 | 52 | 113280 | 566.19 | 824 | 799 | 198.7 |
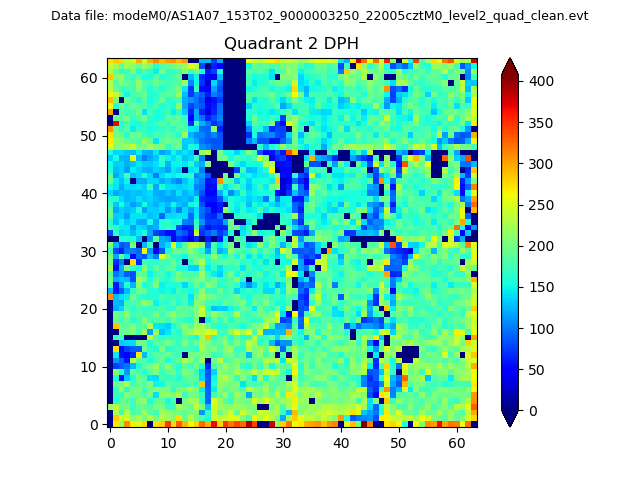
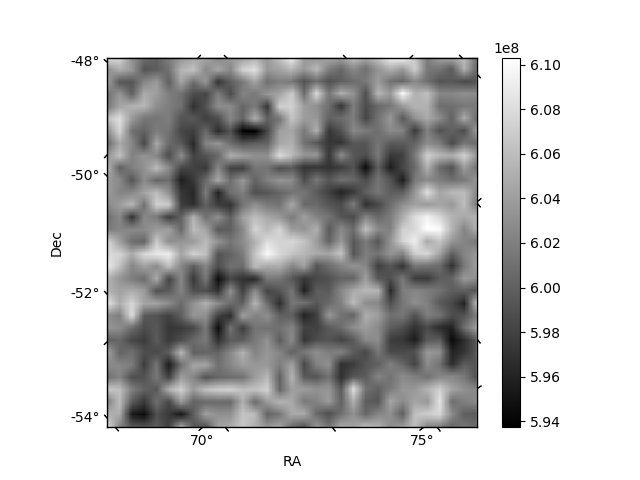
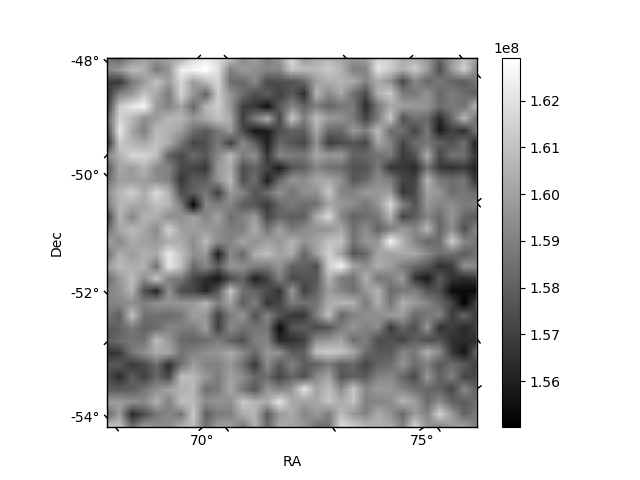
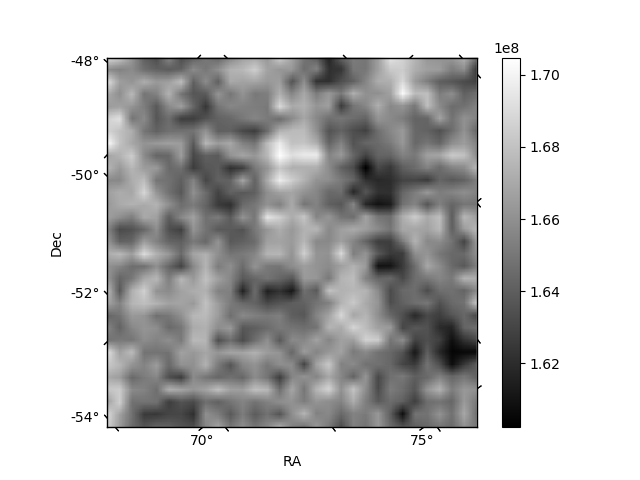
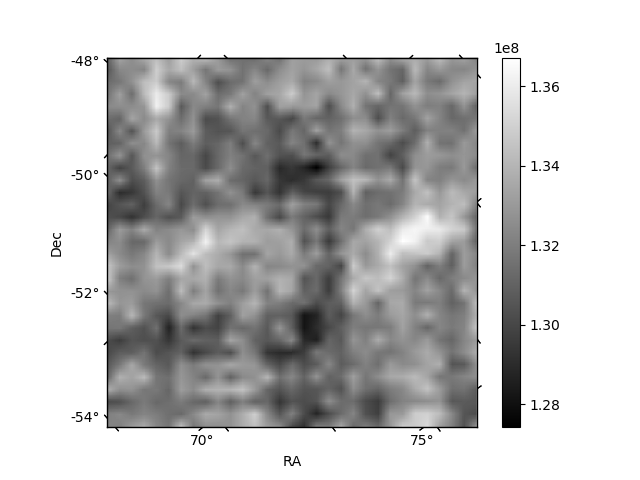
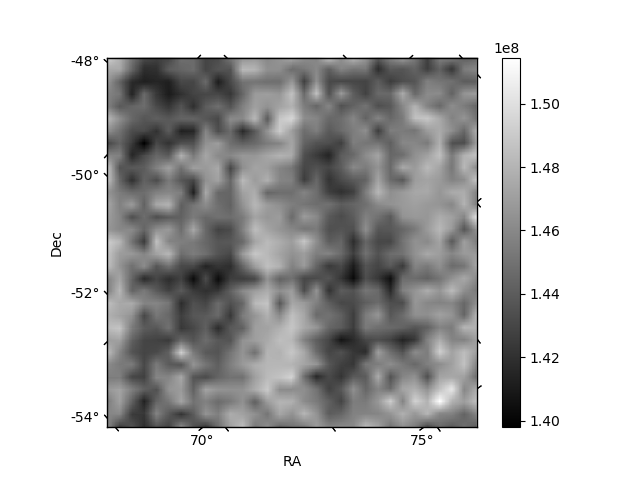
Histogram calculated using DETX and DETY for each event in the final _common_clean file
| Quadrant A | 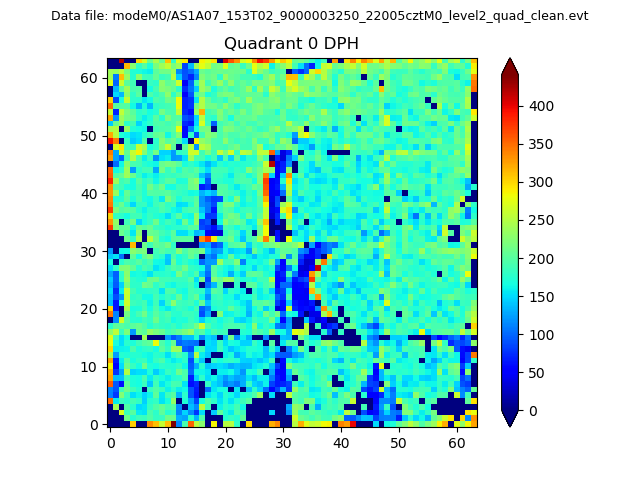 |
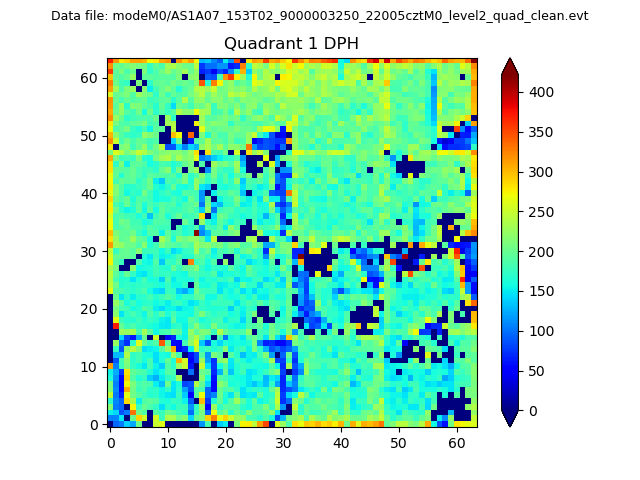 |
Quadrant B |
|---|---|---|---|
| Quadrant D | 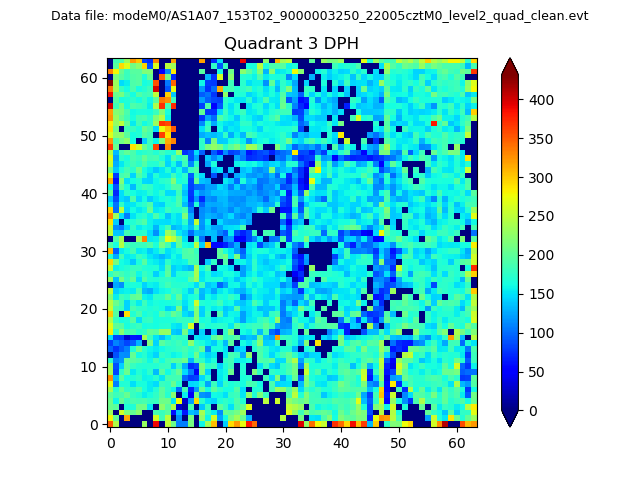 |
 |
Quadrant C |
| Plot type | Count rate plots | Images |
|---|---|---|
| Comparison with Poisson distribution Blue bars denote a histogram of data divided into 1 sec bins. Red curve is a Poisson curve with rate = median count rate of data. |
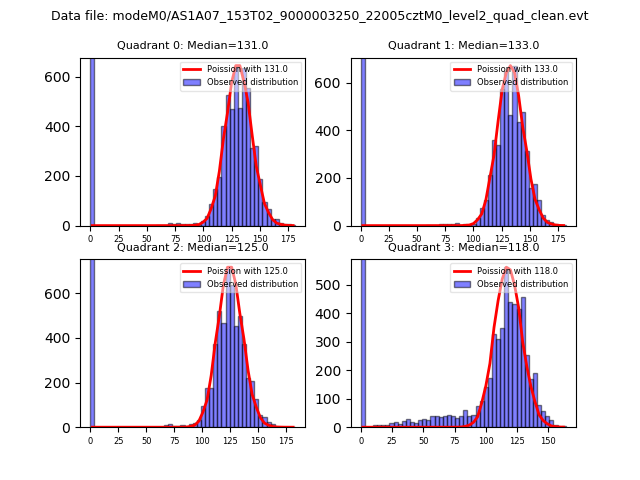 |
 |
| Quadrant-wise count rates Data is divided into 100 sec bins |
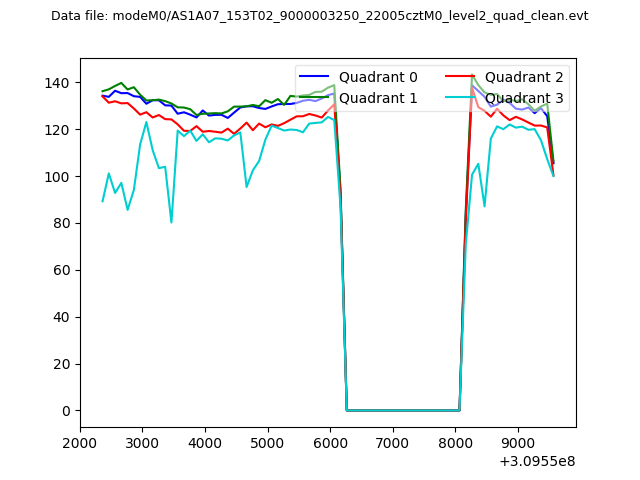 |
|
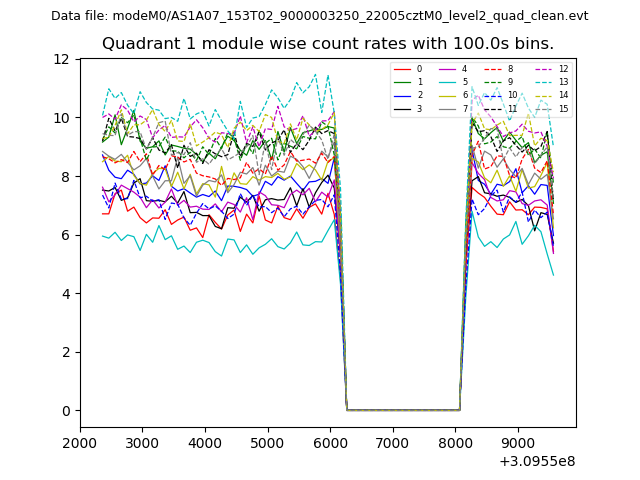
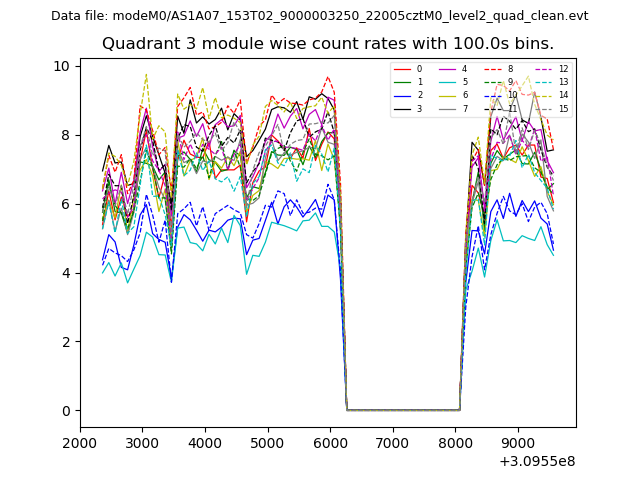
| Module-wise count rates for Quadrant A Data is divided into 100 sec bins |
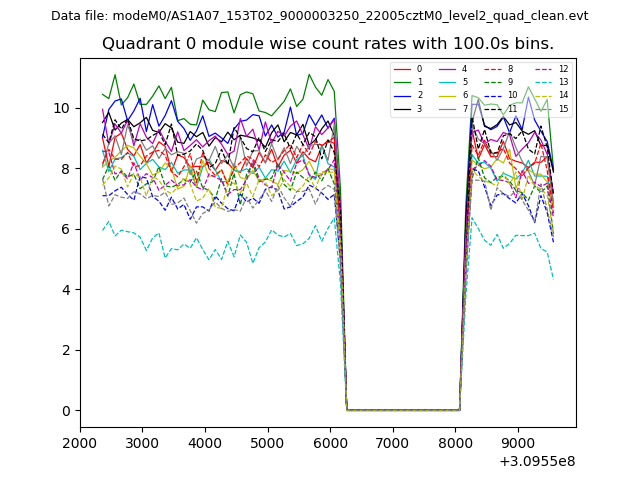 |
 |
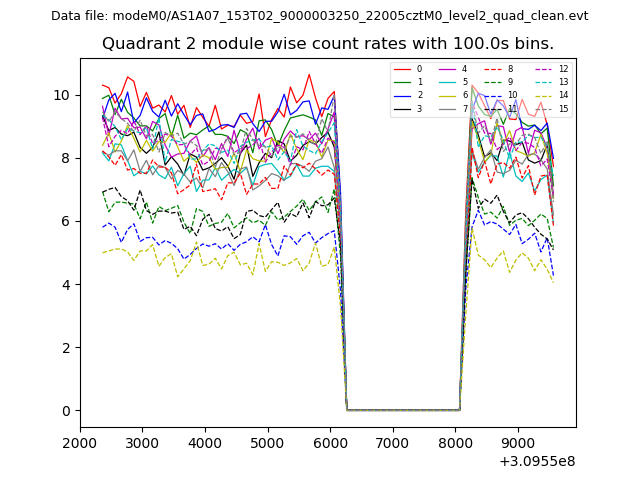
| Module-wise count rates for Quadrant B Data is divided into 100 sec bins |
 |
 |
| Module-wise count rates for Quadrant C Data is divided into 100 sec bins |
 |
 |
| Module-wise count rates for Quadrant D Data is divided into 100 sec bins |
 |
 |
| Parameter | Plot |
|---|---|
| CZT HV Monitor |  |
| D_VDD | 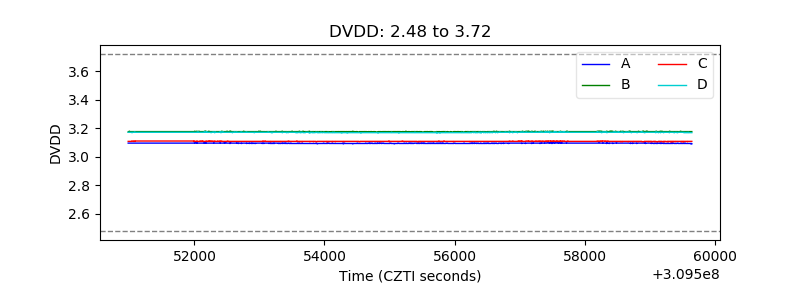 |
| Temperature 1 | 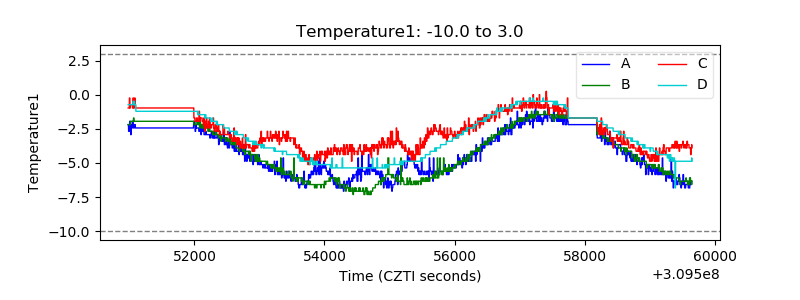 |
| Veto HV Monitor | 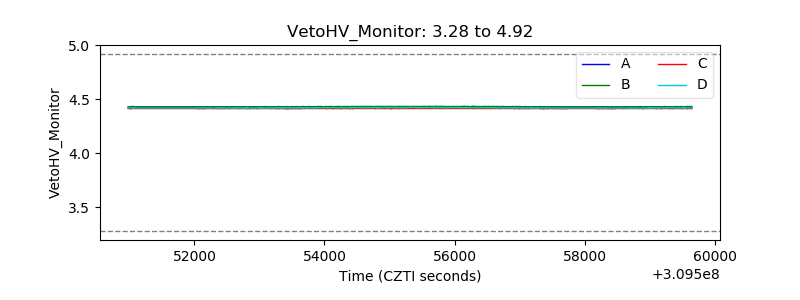 |
| Veto LLD | 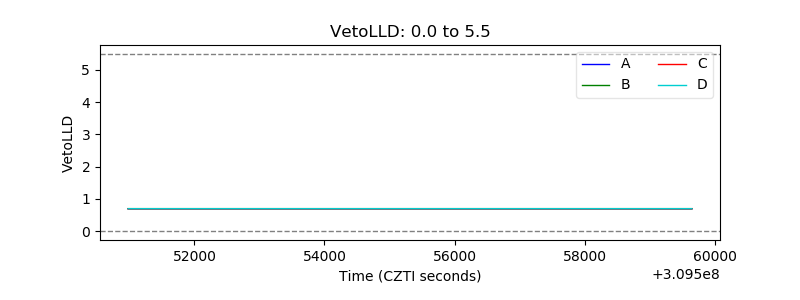 |
| Alpha Counter | 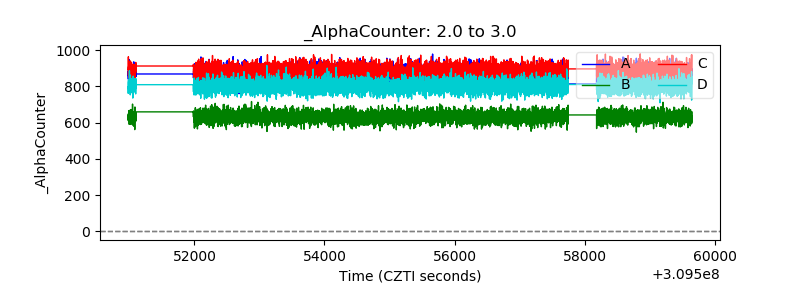 |
| _CPM_Rate | 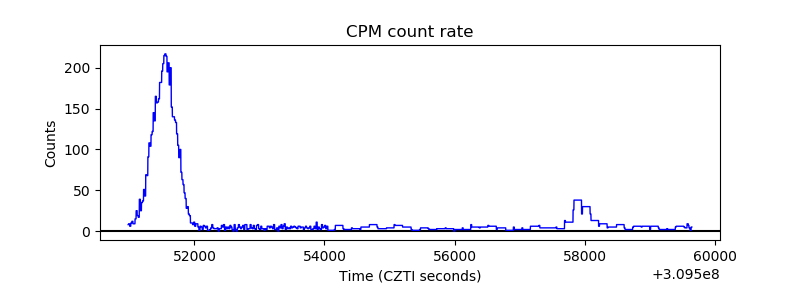 |
| CZT Counter | 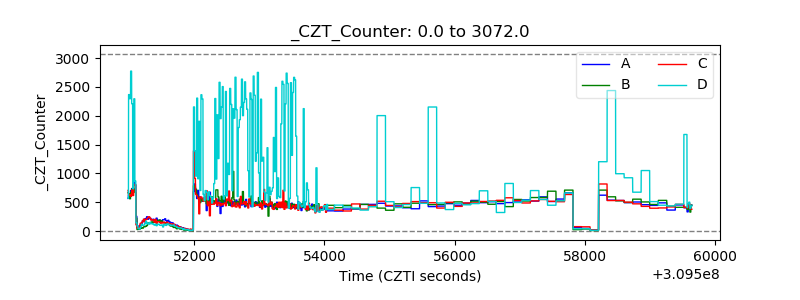 |
| +2.5 Volts monitor | 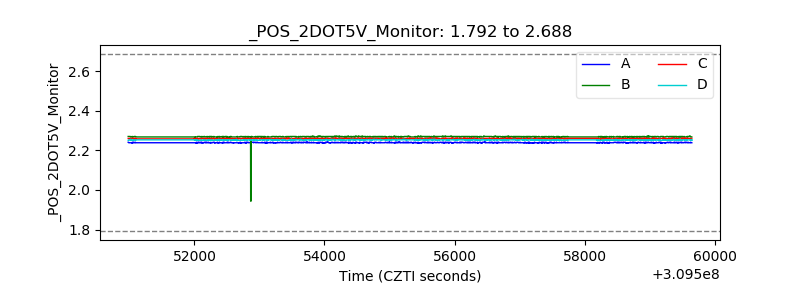 |
| +5 Volts monitor | 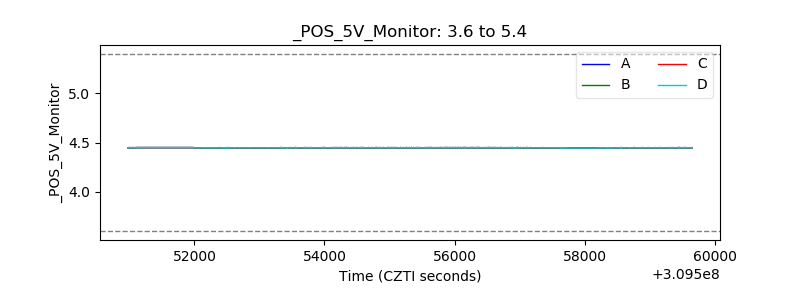 |
| _ROLL_ROT | 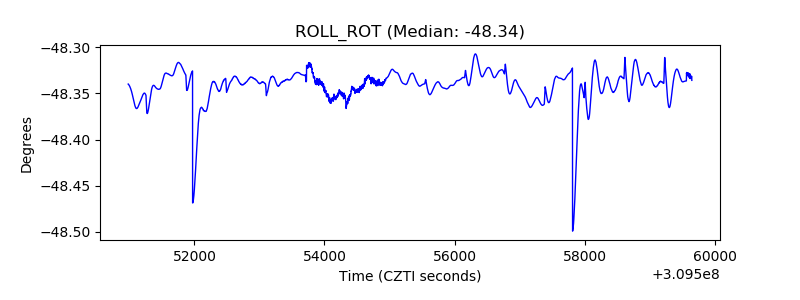 |
| _Roll_DEC | 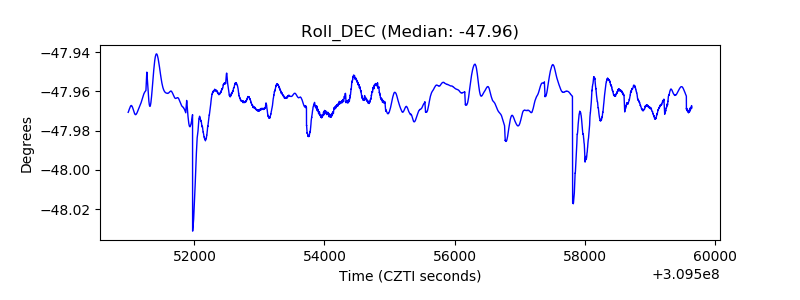 |
| _Roll_RA | 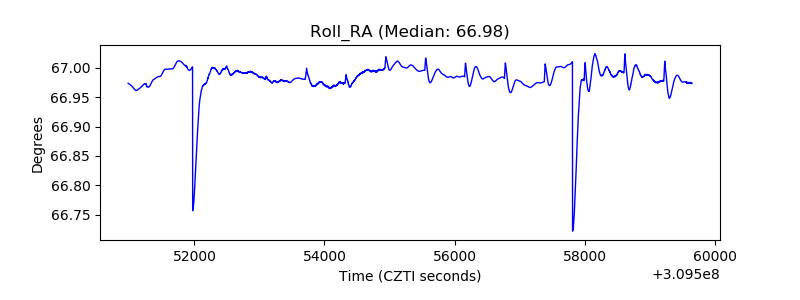 |
| Veto Counter | 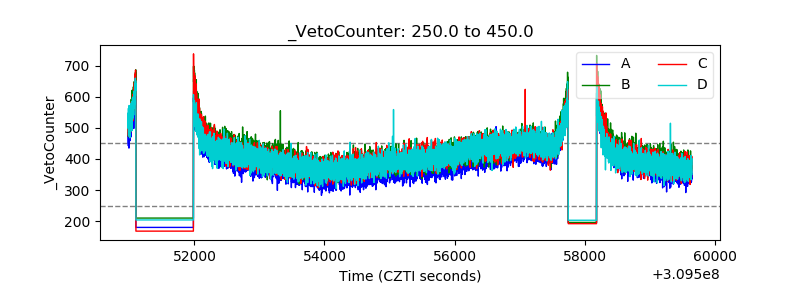 |