| Param | Original file | Final file |
|---|---|---|
| Filename | modeM0/AS1A07_153T02_9000003250_22009cztM0_level2.evt | modeM0/AS1A07_153T02_9000003250_22009cztM0_level2_quad_clean.evt |
| Size (bytes) | 1,037,384,640 | 191,854,080 |
| Size | 989.3 MB | 183.0 MB |
| Events in quadrant A | 6,536,450 | 1,240,934 |
| Events in quadrant B | 6,918,166 | 1,261,526 |
| Events in quadrant C | 6,685,744 | 1,192,419 |
| Events in quadrant D | 10,332,430 | 1,151,115 |
| Mode SS | |||
|---|---|---|---|
| Quadrant | BADHDUFLAG | Total packets | Discarded packets |
| A | 0 | 288 | 0 |
| B | 0 | 288 | 0 |
| C | 0 | 288 | 0 |
| D | 0 | 288 | 0 |
| Mode M0 | |||
|---|---|---|---|
| Quadrant | BADHDUFLAG | Total packets | Discarded packets |
| A | 0 | 28648 | 2 |
| B | 0 | 29583 | 2 |
| C | 0 | 28807 | 2 |
| D | 0 | 40389 | 2 |
| Mode M9 | |||
|---|---|---|---|
| Quadrant | BADHDUFLAG | Total packets | Discarded packets |
| A | 0 | 11 | 0 |
| B | 0 | 11 | 0 |
| C | 0 | 11 | 0 |
| D | 0 | 11 | 0 |
| Quadrant | Total seconds | Saturated seconds | Saturation percentage |
|---|---|---|---|
| A | 13966 | 68 | 0.486897% |
| B | 13967 | 162 | 1.159877% |
| C | 13967 | 194 | 1.388988% |
| D | 13967 | 819 | 5.863822% |
Noise dominated data is calculated using 1-second bins in cleaned event files. If a bin has >2000 counts, and if more than 50% of those come from <1% of pixels, then it is considered to be noise-dominated and hence unusable.
| Quadrant | # 1 sec bins | Bins with >0 counts | Bins with >2000 counts | High rate bins dominated by noise | Noise dominated (total time) | Noise dominated (detector-on time) | Marked lightcurve |
|---|---|---|---|---|---|---|---|
| A | 15051 | 13969 | 0 | 0 | 0.00% | 0.00% |  |
| B | 15052 | 13969 | 17 | 17 | 0.11% | 0.12% |  |
| C | 15052 | 13968 | 2 | 2 | 0.01% | 0.01% |  |
| D | 15052 | 13969 | 552 | 552 | 3.67% | 3.95% | 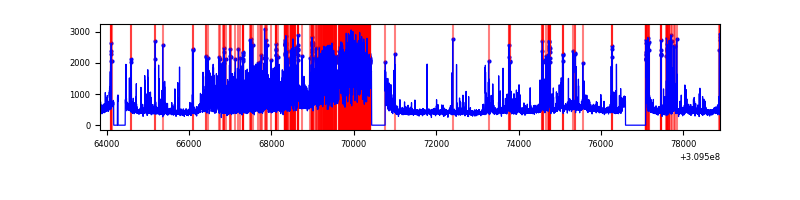 |
Top three noisy pixels from each quadrant. If the there are fewer than three noisy pixels in the level2.evt file, extra rows are filled as -1
| Pixel properties | Quadrant properties | ||||||
|---|---|---|---|---|---|---|---|
| Quadrant | DetID | PixID | Counts | Sigma | Mean | Median | Sigma |
| A | 3 | 1 | 42885 | 122.8 | 1678 | 1639 | 335.9 |
| A | 13 | 254 | 23507 | 65.1 | 1678 | 1639 | 335.9 |
| A | 15 | 236 | 20895 | 57.33 | 1678 | 1639 | 335.9 |
| B | 3 | 64 | 135786 | 420.8 | 1682 | 1635 | 318.8 |
| B | 0 | 230 | 84061 | 258.55 | 1682 | 1635 | 318.8 |
| B | 0 | 190 | 46114 | 139.52 | 1682 | 1635 | 318.8 |
| C | 14 | 238 | 254186 | 670.79 | 1618 | 1623 | 376.5 |
| C | 0 | 239 | 116870 | 306.09 | 1618 | 1623 | 376.5 |
| C | 13 | 61 | 11338 | 25.8 | 1618 | 1623 | 376.5 |
| D | 7 | 238 | 3368915 | 8755.5 | 1605 | 1560 | 384.6 |
| D | 1 | 52 | 740982 | 1922.58 | 1605 | 1560 | 384.6 |
| D | 2 | 234 | 60636 | 153.6 | 1605 | 1560 | 384.6 |
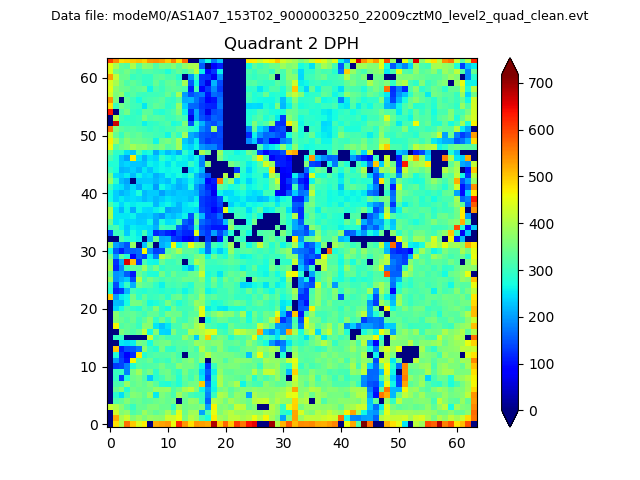
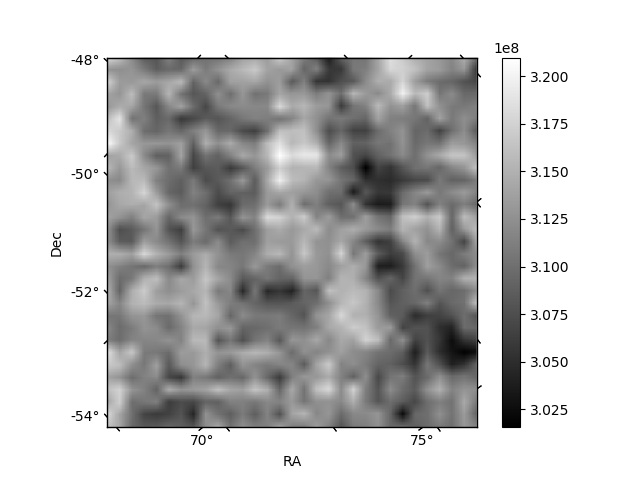
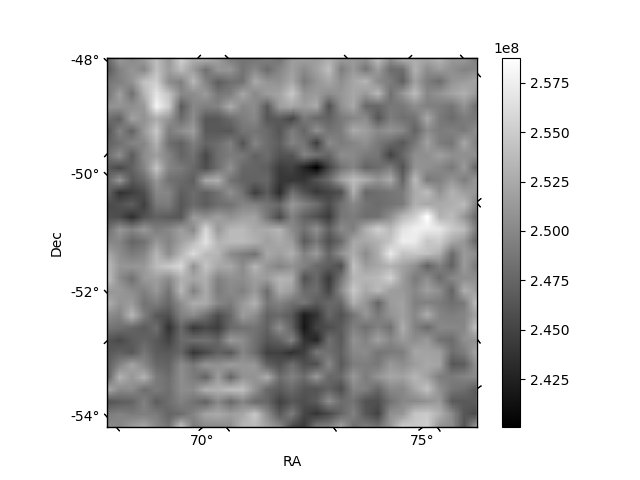
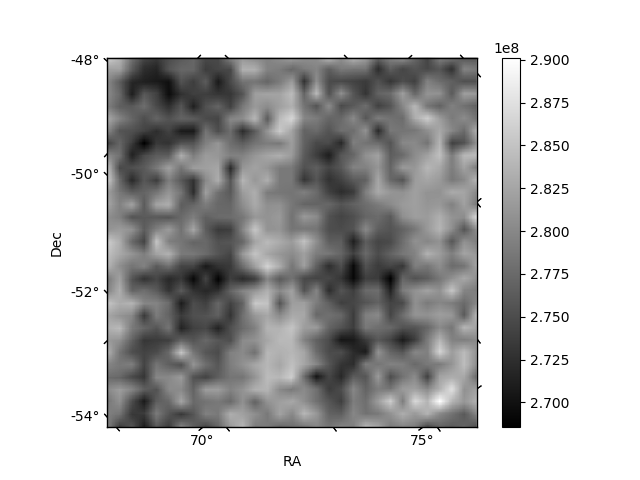
Histogram calculated using DETX and DETY for each event in the final _common_clean file
| Quadrant A | 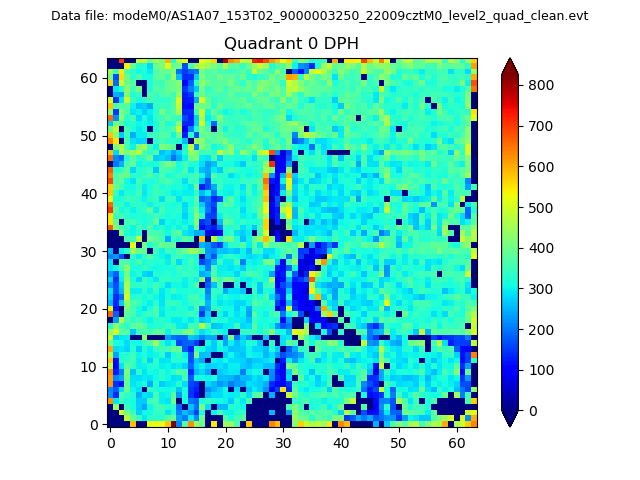 |
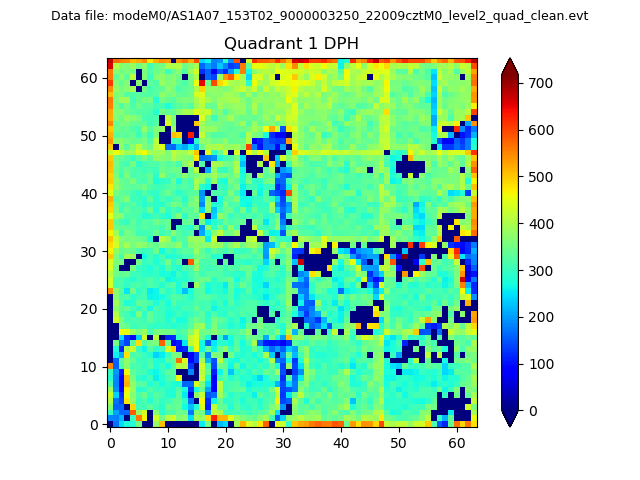 |
Quadrant B |
|---|---|---|---|
| Quadrant D | 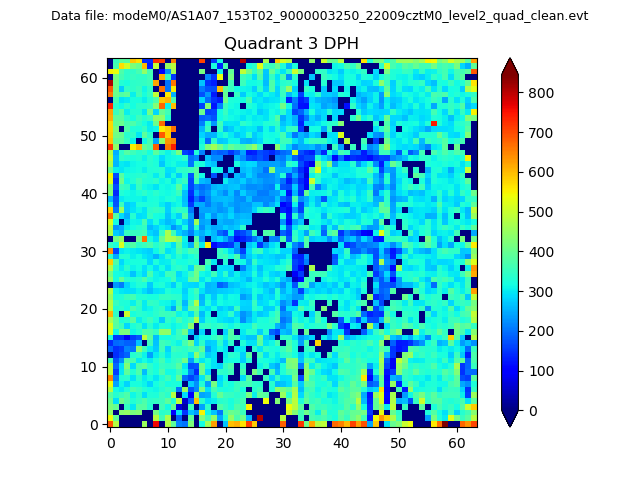 |
 |
Quadrant C |
| Plot type | Count rate plots | Images |
|---|---|---|
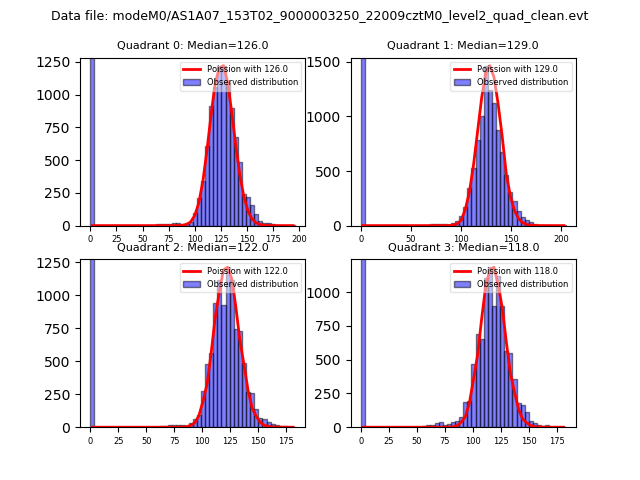
| Comparison with Poisson distribution Blue bars denote a histogram of data divided into 1 sec bins. Red curve is a Poisson curve with rate = median count rate of data. |
 |
 |
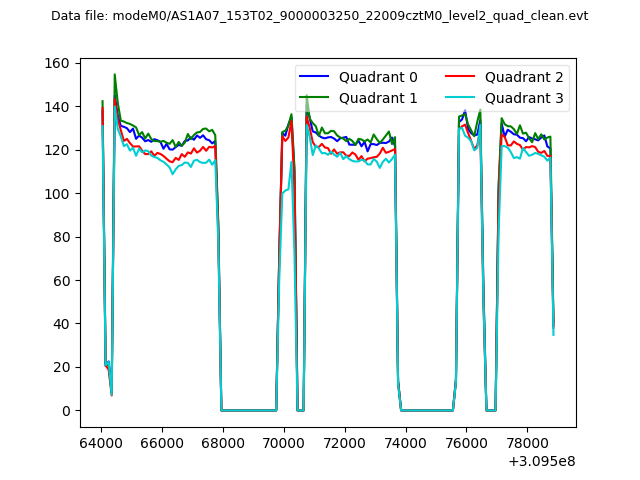
| Quadrant-wise count rates Data is divided into 100 sec bins |
 |
|
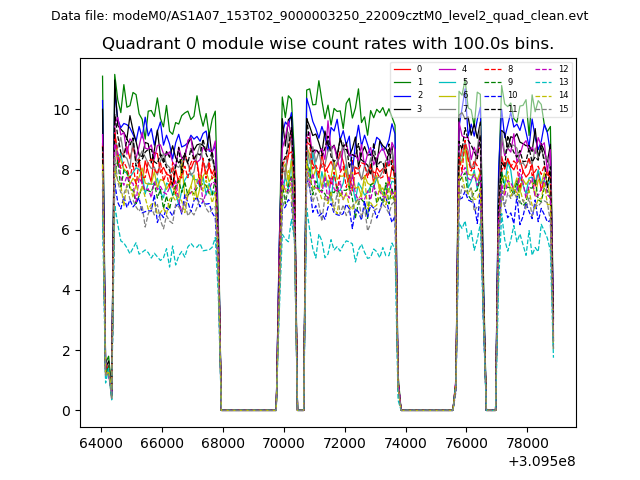
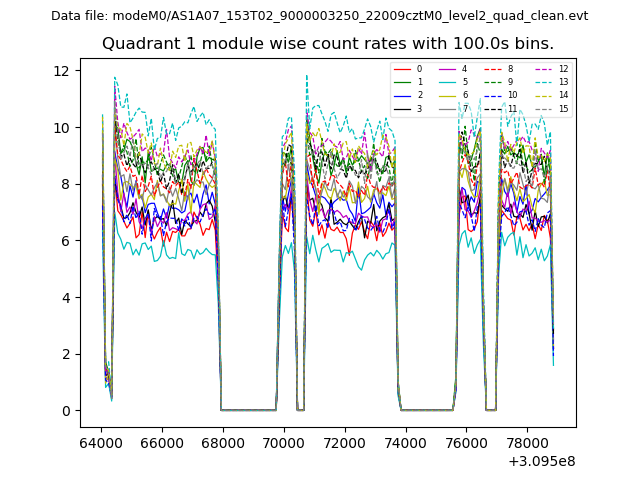
| Module-wise count rates for Quadrant A Data is divided into 100 sec bins |
 |
 |
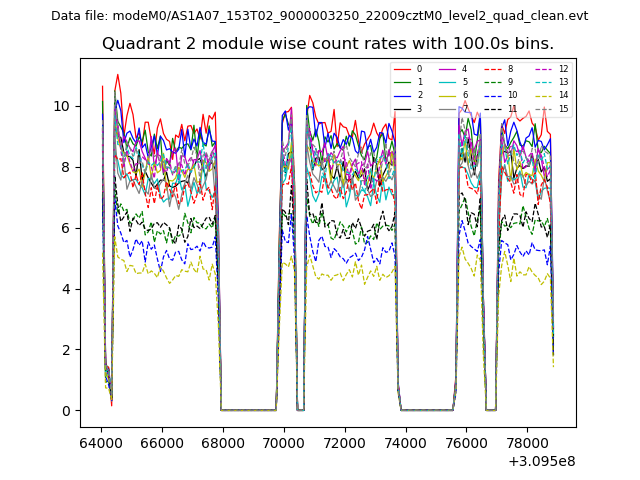
| Module-wise count rates for Quadrant B Data is divided into 100 sec bins |
 |
 |
| Module-wise count rates for Quadrant C Data is divided into 100 sec bins |
 |
 |
| Module-wise count rates for Quadrant D Data is divided into 100 sec bins |
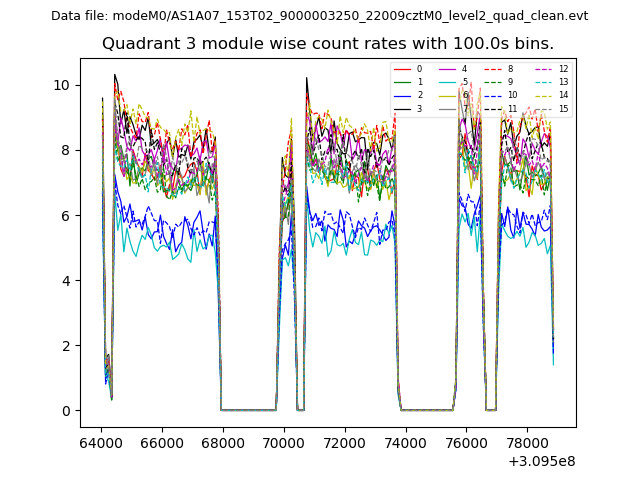 |
 |
| Parameter | Plot |
|---|---|
| CZT HV Monitor | 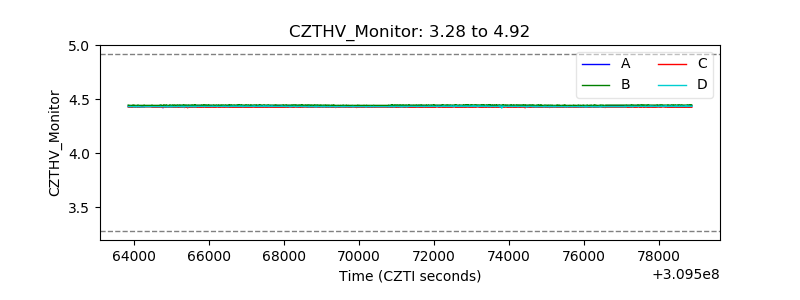 |
| D_VDD | 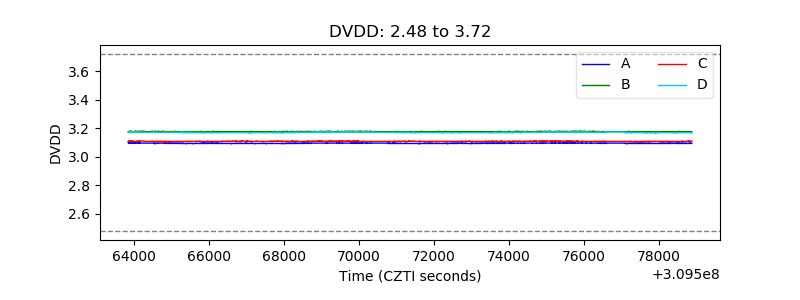 |
| Temperature 1 | 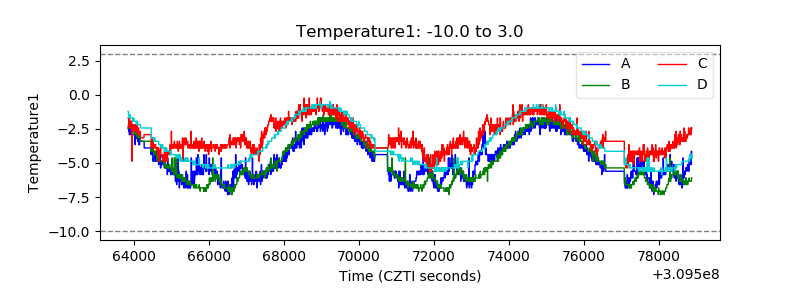 |
| Veto HV Monitor | 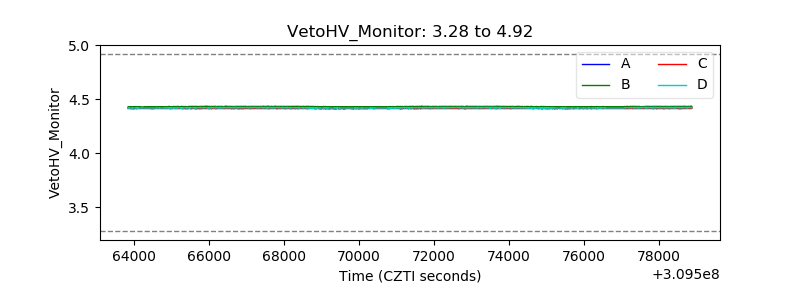 |
| Veto LLD | 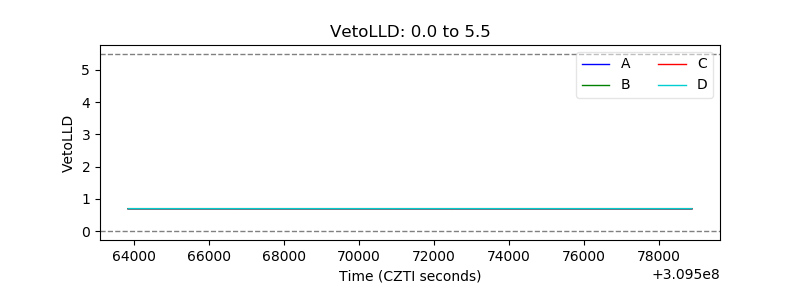 |
| Alpha Counter | 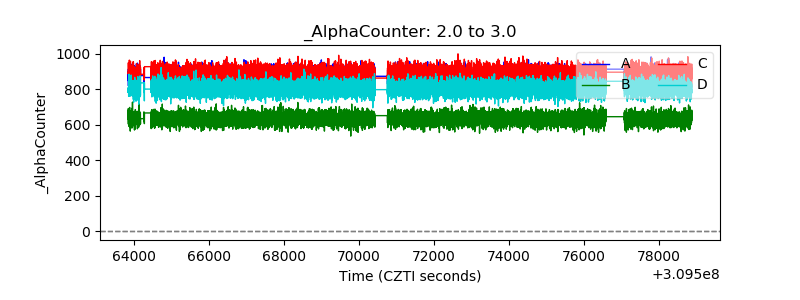 |
| _CPM_Rate | 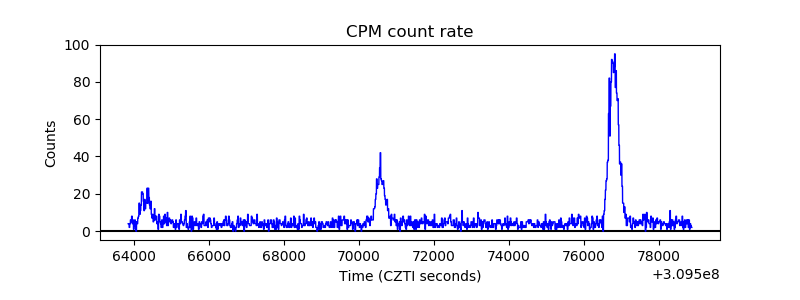 |
| CZT Counter | 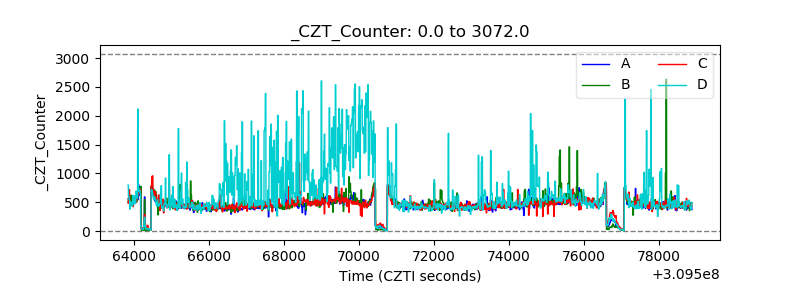 |
| +2.5 Volts monitor |  |
| +5 Volts monitor | 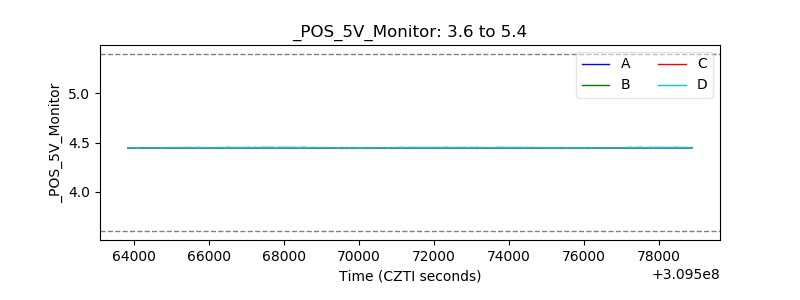 |
| _ROLL_ROT | 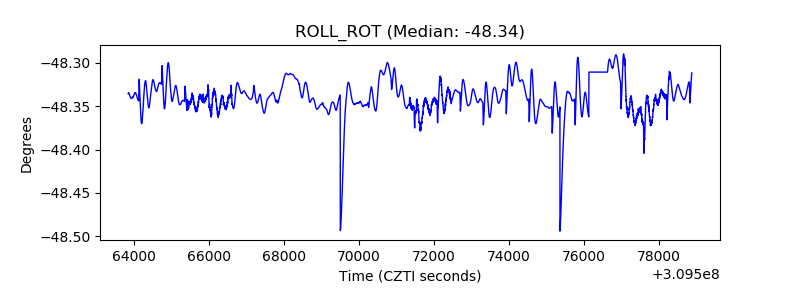 |
| _Roll_DEC | 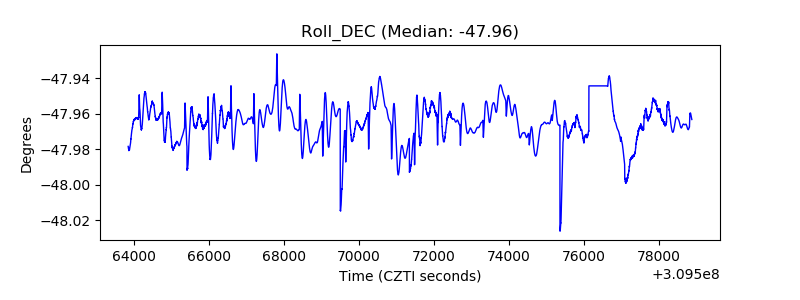 |
| _Roll_RA | 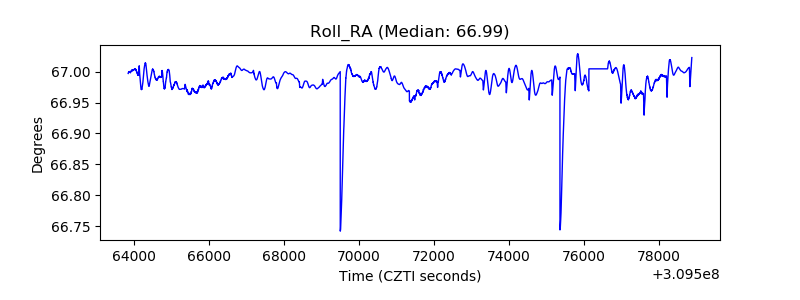 |
| Veto Counter | 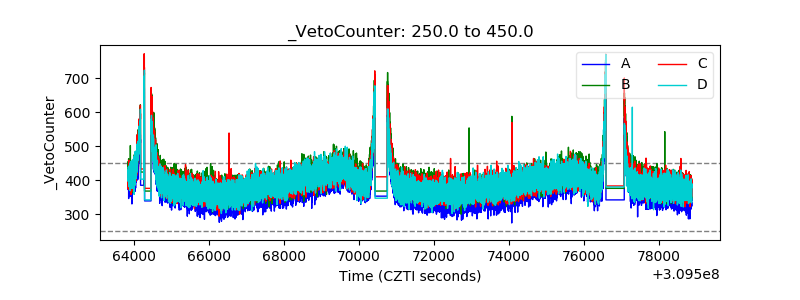 |