| Param | Original file | Final file |
|---|---|---|
| Filename | modeM0/AS1A07_153T02_9000003250_22011cztM0_level2.evt | modeM0/AS1A07_153T02_9000003250_22011cztM0_level2_quad_clean.evt |
| Size (bytes) | 435,888,000 | 80,029,440 |
| Size | 415.7 MB | 76.3 MB |
| Events in quadrant A | 2,849,664 | 513,860 |
| Events in quadrant B | 2,932,234 | 523,924 |
| Events in quadrant C | 2,877,607 | 498,164 |
| Events in quadrant D | 4,138,649 | 473,453 |
| Mode SS | |||
|---|---|---|---|
| Quadrant | BADHDUFLAG | Total packets | Discarded packets |
| A | 0 | 120 | 0 |
| B | 0 | 120 | 0 |
| C | 0 | 120 | 0 |
| D | 0 | 120 | 0 |
| Mode M0 | |||
|---|---|---|---|
| Quadrant | BADHDUFLAG | Total packets | Discarded packets |
| A | 0 | 12248 | 1 |
| B | 0 | 12384 | 1 |
| C | 0 | 12286 | 1 |
| D | 0 | 16222 | 1 |
| Mode M9 | |||
|---|---|---|---|
| Quadrant | BADHDUFLAG | Total packets | Discarded packets |
| A | 0 | 11 | 0 |
| B | 0 | 11 | 0 |
| C | 0 | 11 | 0 |
| D | 0 | 11 | 0 |
| Quadrant | Total seconds | Saturated seconds | Saturation percentage |
|---|---|---|---|
| A | 5926 | 27 | 0.455619% |
| B | 5926 | 38 | 0.641242% |
| C | 5927 | 60 | 1.012317% |
| D | 5927 | 275 | 4.639784% |
Noise dominated data is calculated using 1-second bins in cleaned event files. If a bin has >2000 counts, and if more than 50% of those come from <1% of pixels, then it is considered to be noise-dominated and hence unusable.
| Quadrant | # 1 sec bins | Bins with >0 counts | Bins with >2000 counts | High rate bins dominated by noise | Noise dominated (total time) | Noise dominated (detector-on time) | Marked lightcurve |
|---|---|---|---|---|---|---|---|
| A | 6956 | 5926 | 0 | 0 | 0.00% | 0.00% | 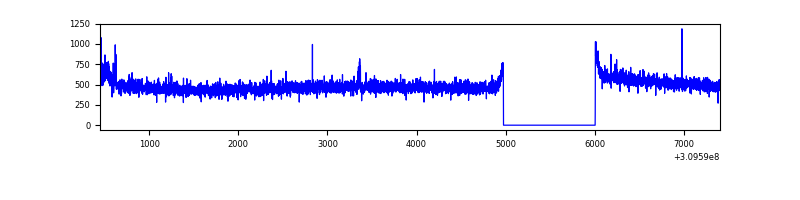 |
| B | 6956 | 5926 | 8 | 8 | 0.12% | 0.13% | 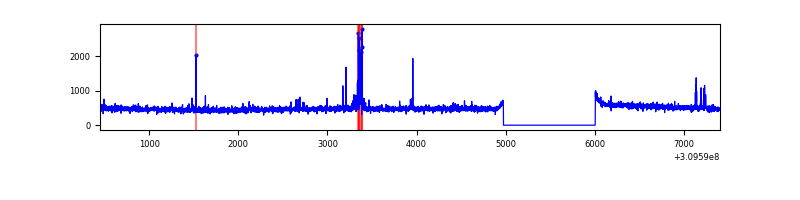 |
| C | 6957 | 5927 | 0 | 0 | 0.00% | 0.00% | 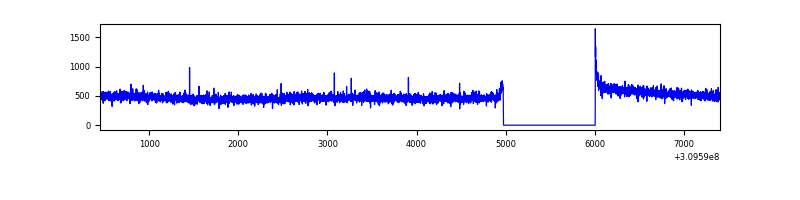 |
| D | 6957 | 5927 | 253 | 253 | 3.64% | 4.27% | 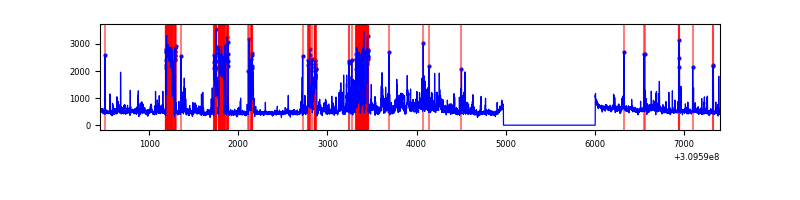 |
Top three noisy pixels from each quadrant. If the there are fewer than three noisy pixels in the level2.evt file, extra rows are filled as -1
| Pixel properties | Quadrant properties | ||||||
|---|---|---|---|---|---|---|---|
| Quadrant | DetID | PixID | Counts | Sigma | Mean | Median | Sigma |
| A | 15 | 236 | 30370 | 203.17 | 730 | 716 | 146.0 |
| A | 13 | 254 | 10148 | 64.62 | 730 | 716 | 146.0 |
| A | 0 | 226 | 6272 | 38.07 | 730 | 716 | 146.0 |
| B | 3 | 64 | 77578 | 560.46 | 725 | 706 | 137.2 |
| B | 12 | 111 | 16153 | 112.62 | 725 | 706 | 137.2 |
| B | 11 | 111 | 14843 | 103.07 | 725 | 706 | 137.2 |
| C | 14 | 238 | 112253 | 670.41 | 708 | 711 | 166.4 |
| C | 0 | 10 | 5610 | 29.44 | 708 | 711 | 166.4 |
| C | 13 | 61 | 4845 | 24.85 | 708 | 711 | 166.4 |
| D | 7 | 238 | 857270 | 5021.77 | 702 | 681 | 170.6 |
| D | 1 | 52 | 415793 | 2433.6 | 702 | 681 | 170.6 |
| D | 13 | 172 | 109185 | 636.11 | 702 | 681 | 170.6 |
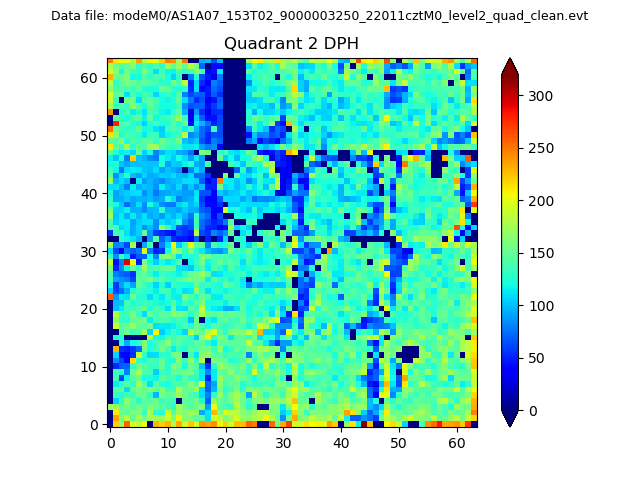
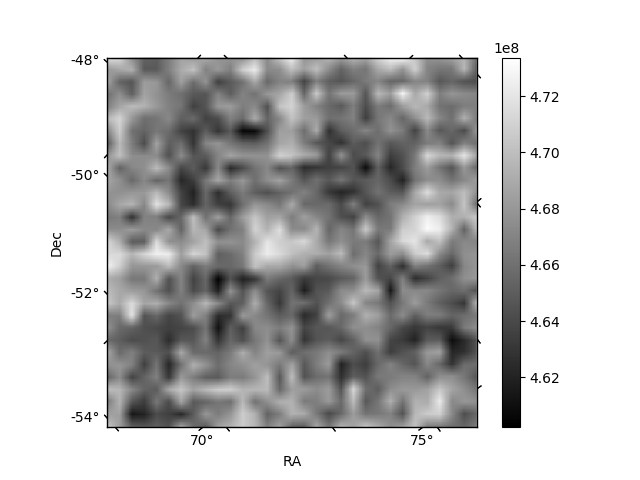
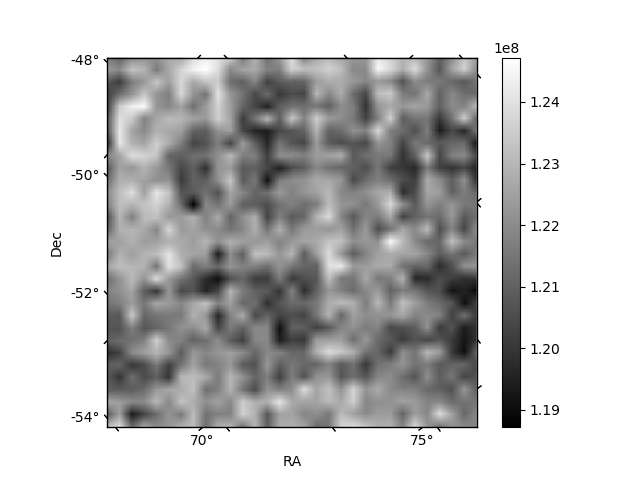
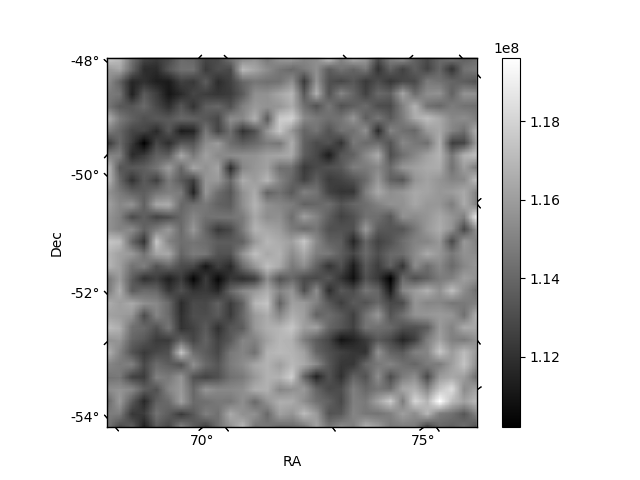
Histogram calculated using DETX and DETY for each event in the final _common_clean file
| Quadrant A | 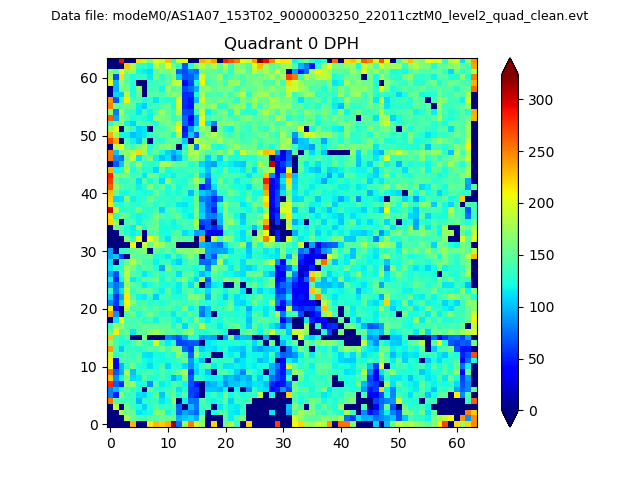 |
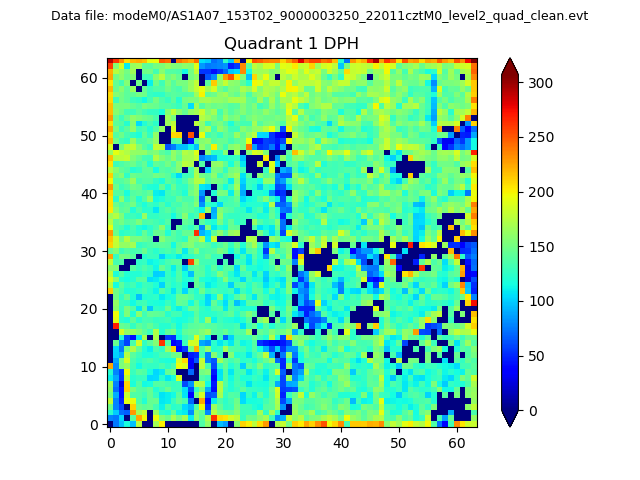 |
Quadrant B |
|---|---|---|---|
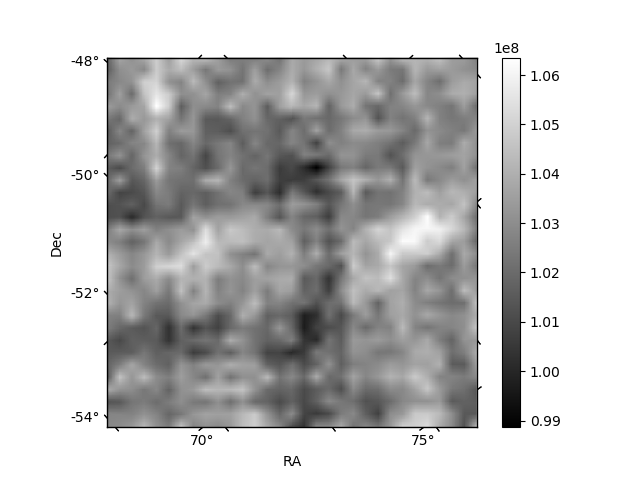
| Quadrant D | 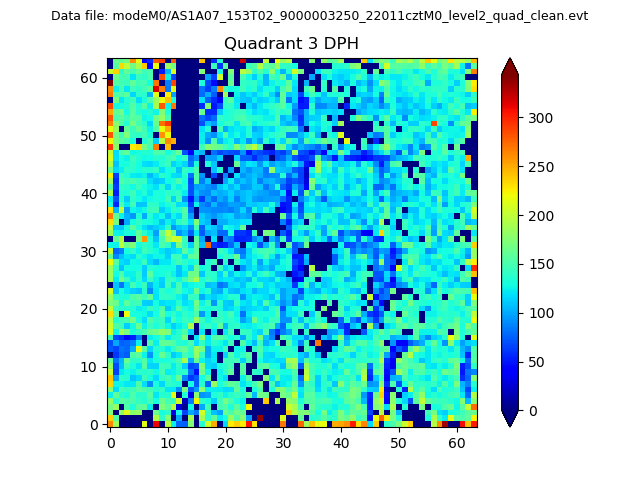 |
 |
Quadrant C |
| Plot type | Count rate plots | Images |
|---|---|---|
| Comparison with Poisson distribution Blue bars denote a histogram of data divided into 1 sec bins. Red curve is a Poisson curve with rate = median count rate of data. |
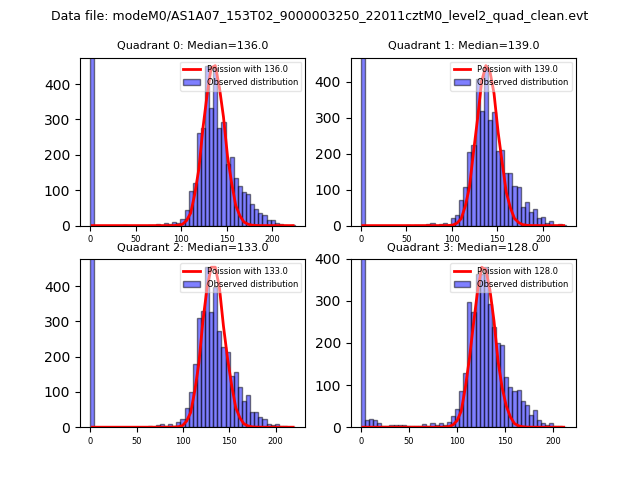 |
 |
| Quadrant-wise count rates Data is divided into 100 sec bins |
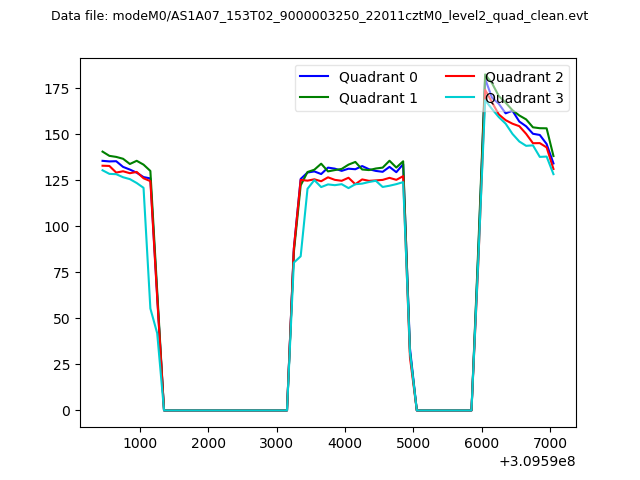 |
|
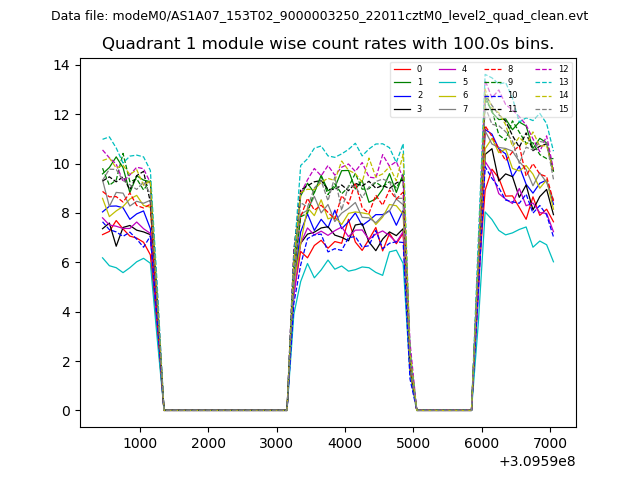
| Module-wise count rates for Quadrant A Data is divided into 100 sec bins |
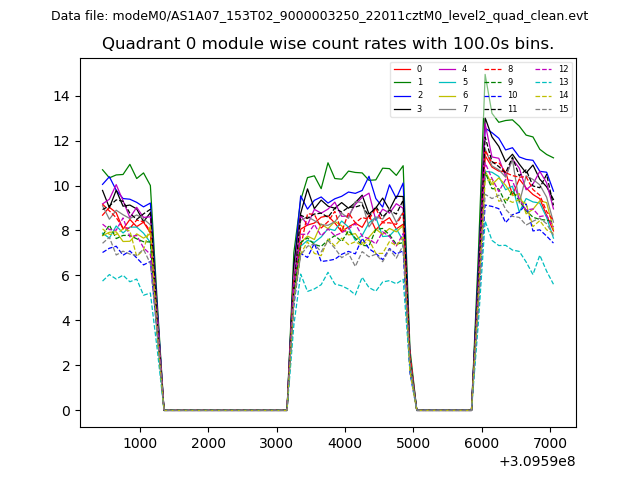 |
 |
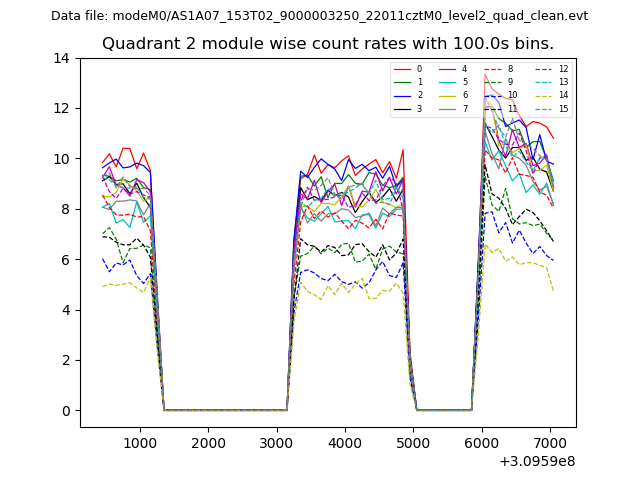
| Module-wise count rates for Quadrant B Data is divided into 100 sec bins |
 |
 |
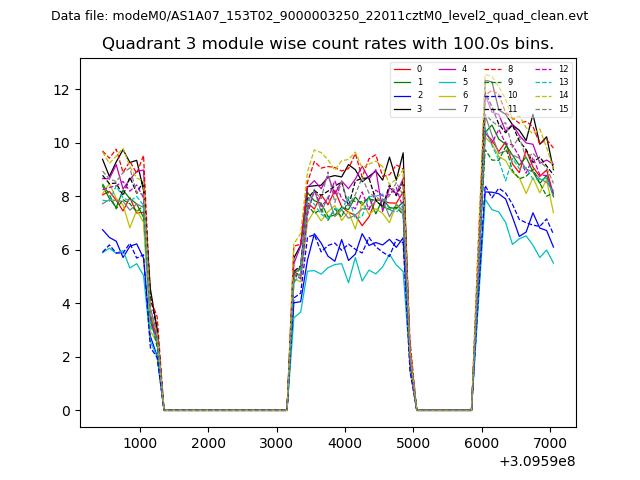
| Module-wise count rates for Quadrant C Data is divided into 100 sec bins |
 |
 |
| Module-wise count rates for Quadrant D Data is divided into 100 sec bins |
 |
 |
| Parameter | Plot |
|---|---|
| CZT HV Monitor | 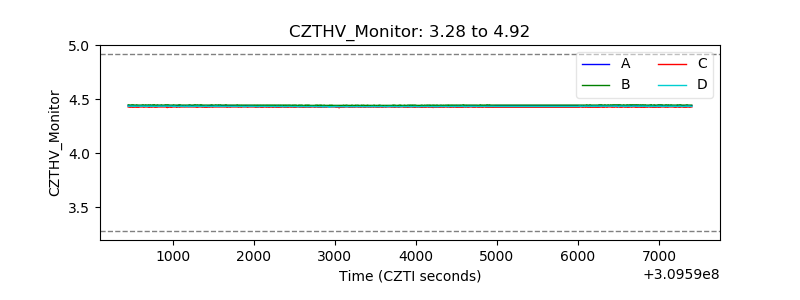 |
| D_VDD |  |
| Temperature 1 | 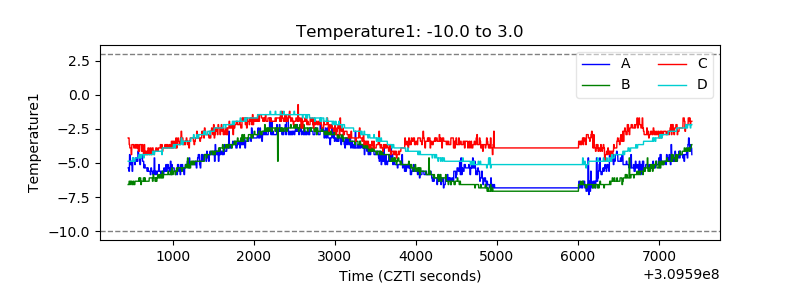 |
| Veto HV Monitor | 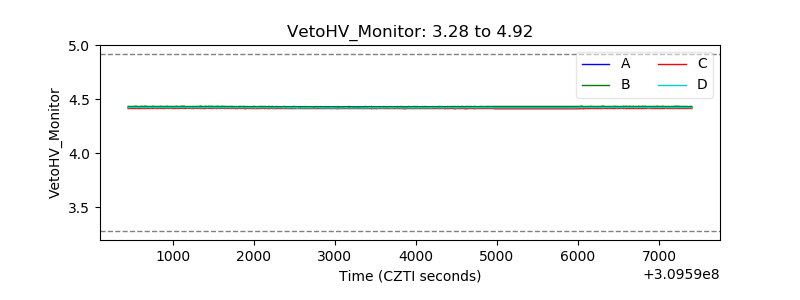 |
| Veto LLD | 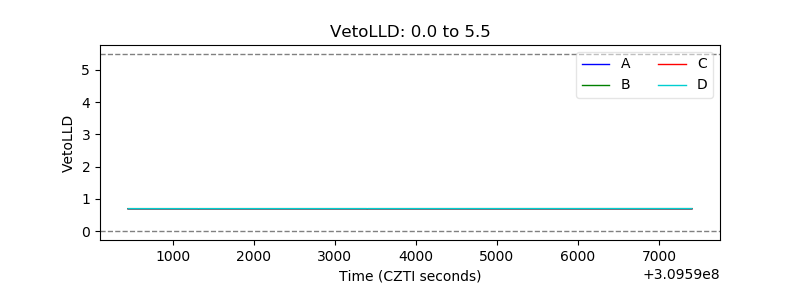 |
| Alpha Counter | 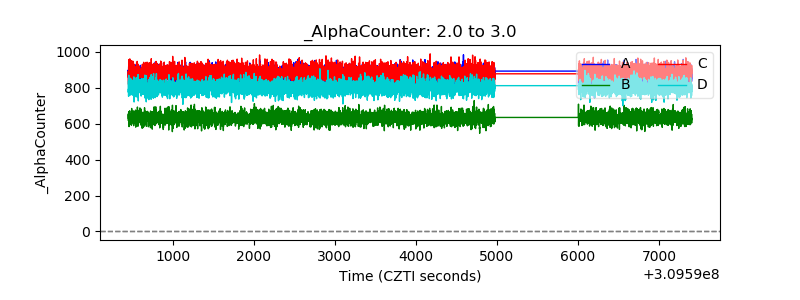 |
| _CPM_Rate |  |
| CZT Counter | 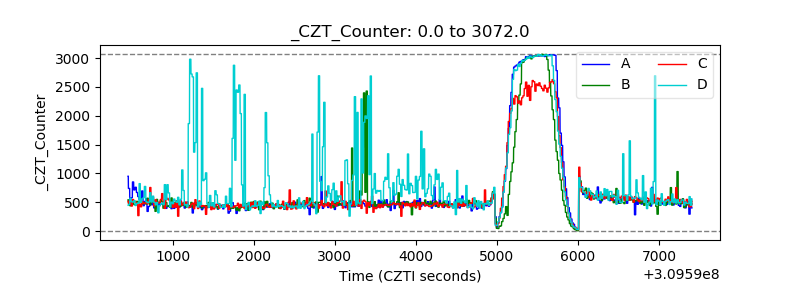 |
| +2.5 Volts monitor |  |
| +5 Volts monitor |  |
| _ROLL_ROT | 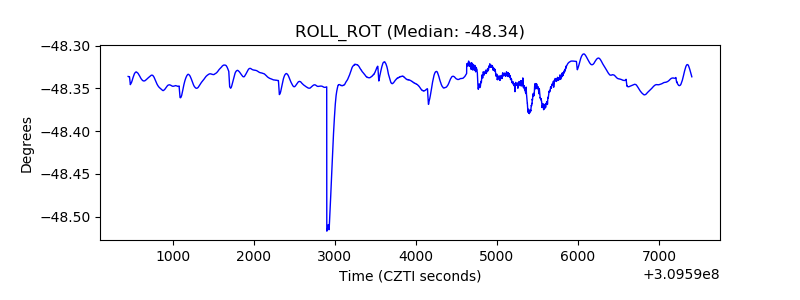 |
| _Roll_DEC | 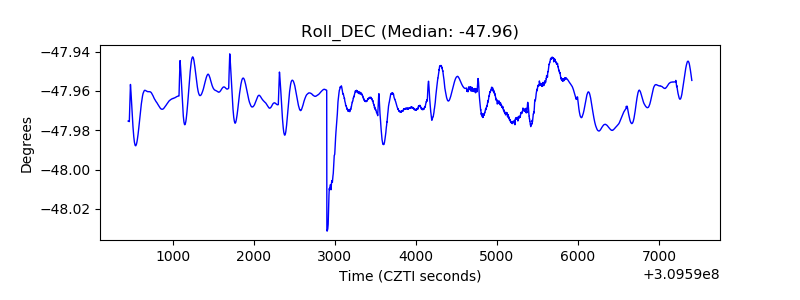 |
| _Roll_RA | 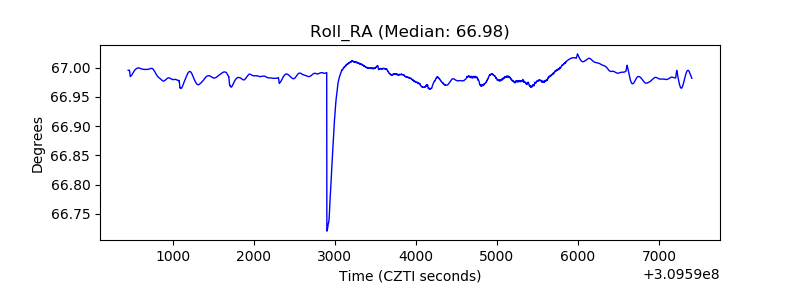 |
| Veto Counter | 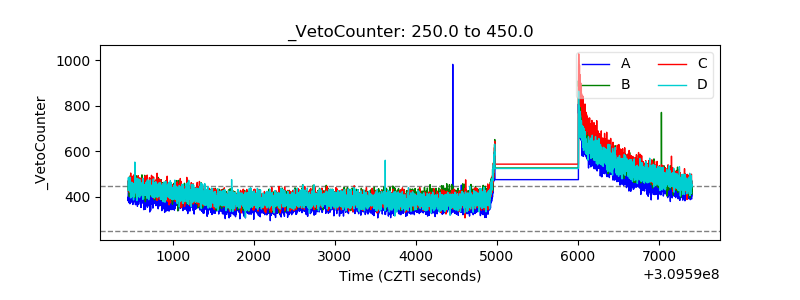 |