| Param | Original file | Final file |
|---|---|---|
| Filename | modeM0/AS1A07_153T02_9000003250_22013cztM0_level2.evt | modeM0/AS1A07_153T02_9000003250_22013cztM0_level2_quad_clean.evt |
| Size (bytes) | 430,188,480 | 79,865,280 |
| Size | 410.3 MB | 76.2 MB |
| Events in quadrant A | 2,958,944 | 511,674 |
| Events in quadrant B | 3,051,615 | 520,425 |
| Events in quadrant C | 3,000,135 | 492,133 |
| Events in quadrant D | 3,615,462 | 480,834 |
| Mode SS | |||
|---|---|---|---|
| Quadrant | BADHDUFLAG | Total packets | Discarded packets |
| A | 0 | 122 | 0 |
| B | 0 | 122 | 0 |
| C | 0 | 122 | 0 |
| D | 0 | 122 | 0 |
| Mode M0 | |||
|---|---|---|---|
| Quadrant | BADHDUFLAG | Total packets | Discarded packets |
| A | 0 | 12520 | 1 |
| B | 0 | 12737 | 1 |
| C | 0 | 12670 | 2 |
| D | 0 | 14694 | 1 |
| Mode M9 | |||
|---|---|---|---|
| Quadrant | BADHDUFLAG | Total packets | Discarded packets |
| A | 0 | 11 | 0 |
| B | 0 | 11 | 0 |
| C | 0 | 11 | 0 |
| D | 0 | 11 | 0 |
| Quadrant | Total seconds | Saturated seconds | Saturation percentage |
|---|---|---|---|
| A | 5910 | 66 | 1.116751% |
| B | 5911 | 75 | 1.268821% |
| C | 5910 | 107 | 1.810491% |
| D | 5910 | 134 | 2.267343% |
Noise dominated data is calculated using 1-second bins in cleaned event files. If a bin has >2000 counts, and if more than 50% of those come from <1% of pixels, then it is considered to be noise-dominated and hence unusable.
| Quadrant | # 1 sec bins | Bins with >0 counts | Bins with >2000 counts | High rate bins dominated by noise | Noise dominated (total time) | Noise dominated (detector-on time) | Marked lightcurve |
|---|---|---|---|---|---|---|---|
| A | 7045 | 5910 | 0 | 0 | 0.00% | 0.00% | 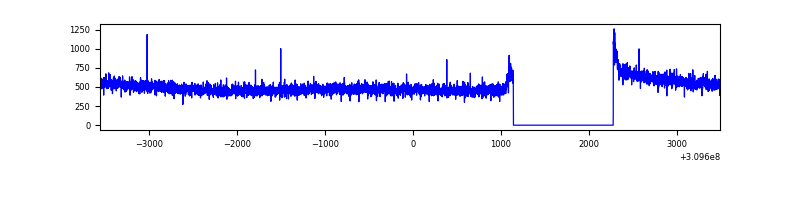 |
| B | 7046 | 5911 | 2 | 2 | 0.03% | 0.03% | 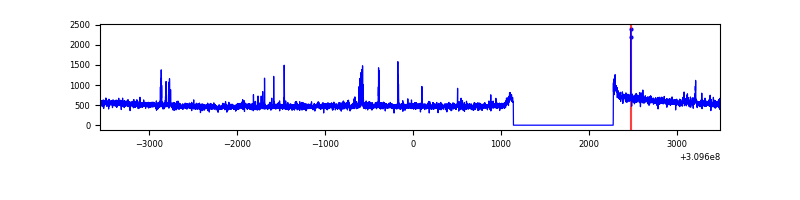 |
| C | 7045 | 5910 | 1 | 1 | 0.01% | 0.02% | 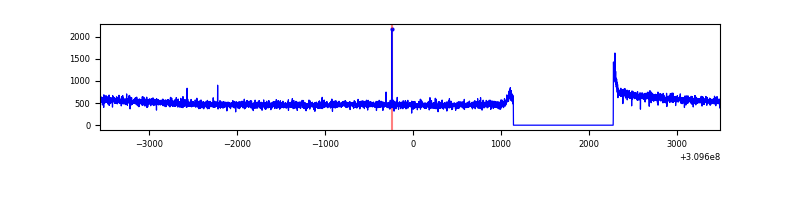 |
| D | 7045 | 5910 | 67 | 67 | 0.95% | 1.13% | 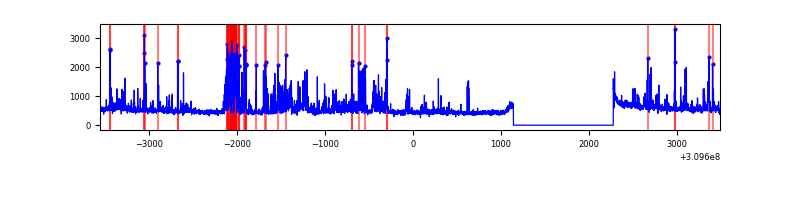 |
Top three noisy pixels from each quadrant. If the there are fewer than three noisy pixels in the level2.evt file, extra rows are filled as -1
| Pixel properties | Quadrant properties | ||||||
|---|---|---|---|---|---|---|---|
| Quadrant | DetID | PixID | Counts | Sigma | Mean | Median | Sigma |
| A | 13 | 254 | 9836 | 59.49 | 766 | 752 | 152.7 |
| A | 0 | 226 | 6591 | 38.24 | 766 | 752 | 152.7 |
| A | 3 | 137 | 6136 | 35.26 | 766 | 752 | 152.7 |
| B | 3 | 64 | 50742 | 353.41 | 756 | 737 | 141.5 |
| B | 0 | 230 | 18226 | 123.6 | 756 | 737 | 141.5 |
| B | 12 | 111 | 16689 | 112.74 | 756 | 737 | 141.5 |
| C | 14 | 238 | 117065 | 679.51 | 735 | 741 | 171.2 |
| C | 0 | 10 | 13747 | 75.97 | 735 | 741 | 171.2 |
| C | 13 | 61 | 4925 | 24.44 | 735 | 741 | 171.2 |
| D | 1 | 52 | 505896 | 2813.51 | 746 | 725 | 179.6 |
| D | 2 | 136 | 105715 | 584.73 | 746 | 725 | 179.6 |
| D | 13 | 172 | 57112 | 314.04 | 746 | 725 | 179.6 |
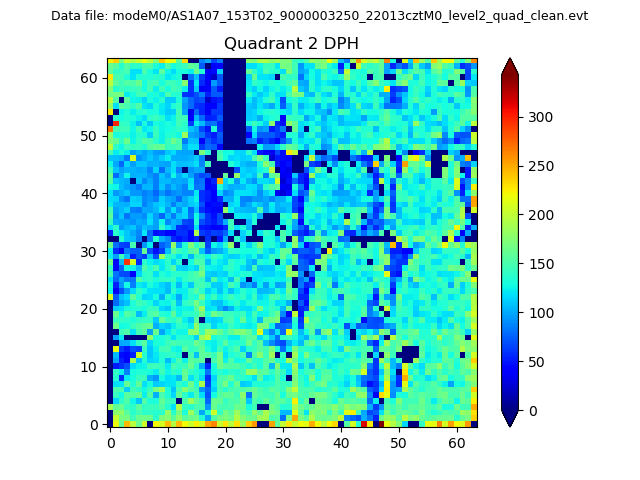
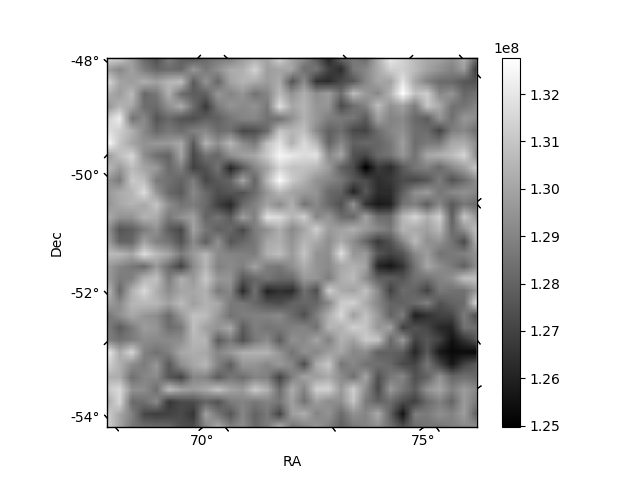
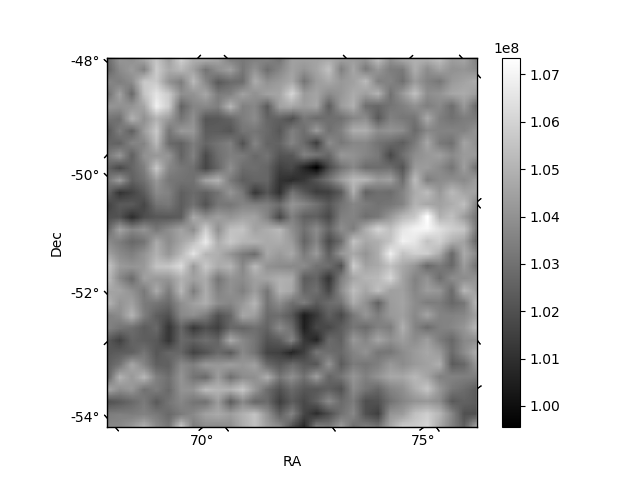
Histogram calculated using DETX and DETY for each event in the final _common_clean file
| Quadrant A | 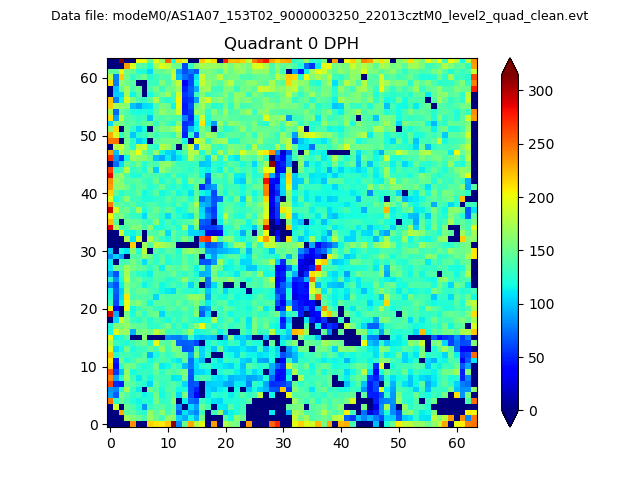 |
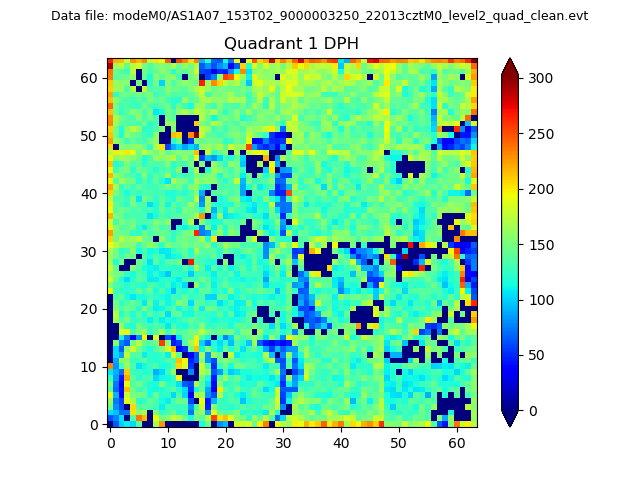 |
Quadrant B |
|---|---|---|---|
| Quadrant D | 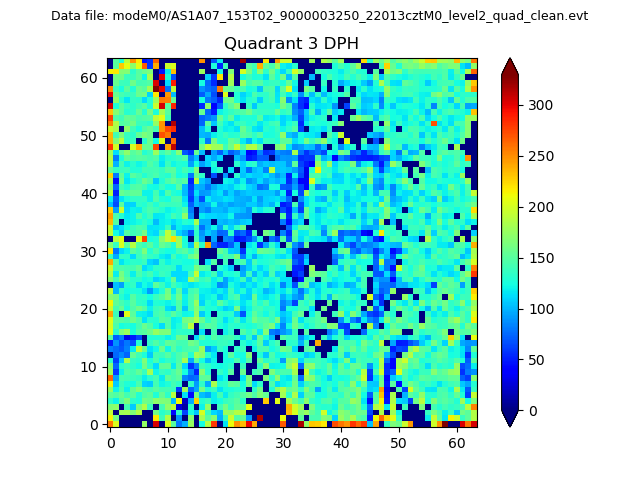 |
 |
Quadrant C |
| Plot type | Count rate plots | Images |
|---|---|---|
| Comparison with Poisson distribution Blue bars denote a histogram of data divided into 1 sec bins. Red curve is a Poisson curve with rate = median count rate of data. |
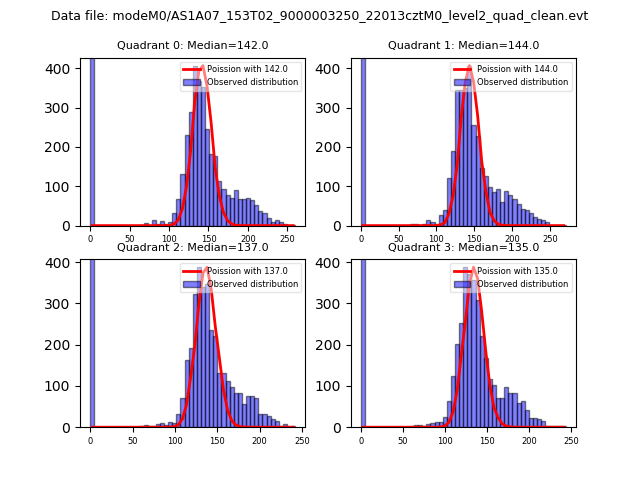 |
 |
| Quadrant-wise count rates Data is divided into 100 sec bins |
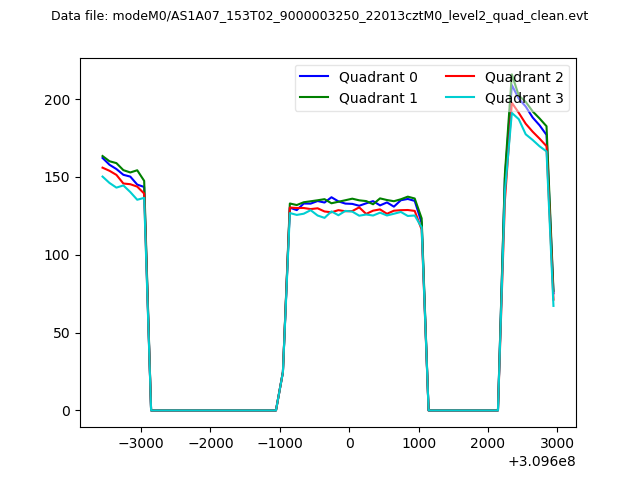 |
|
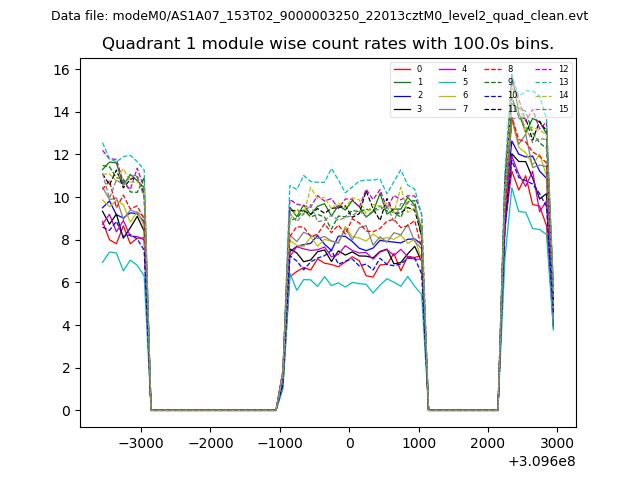
| Module-wise count rates for Quadrant A Data is divided into 100 sec bins |
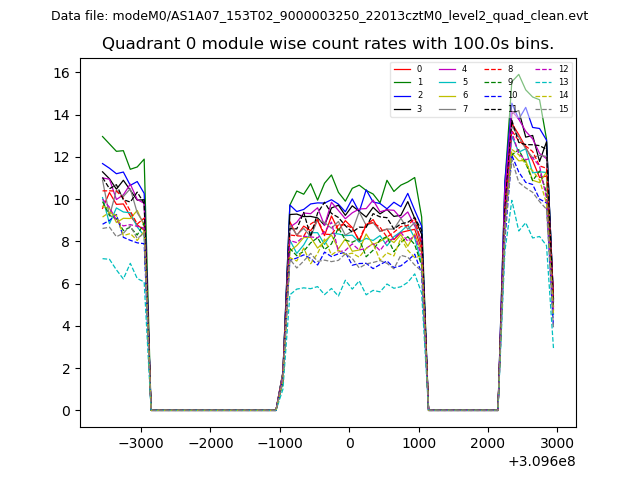 |
 |
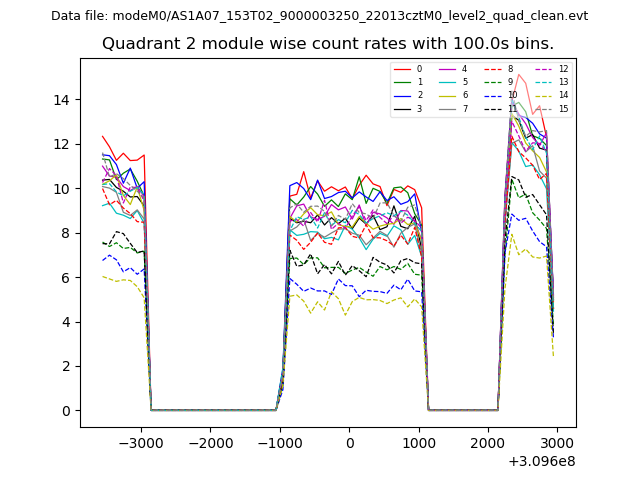
| Module-wise count rates for Quadrant B Data is divided into 100 sec bins |
 |
 |
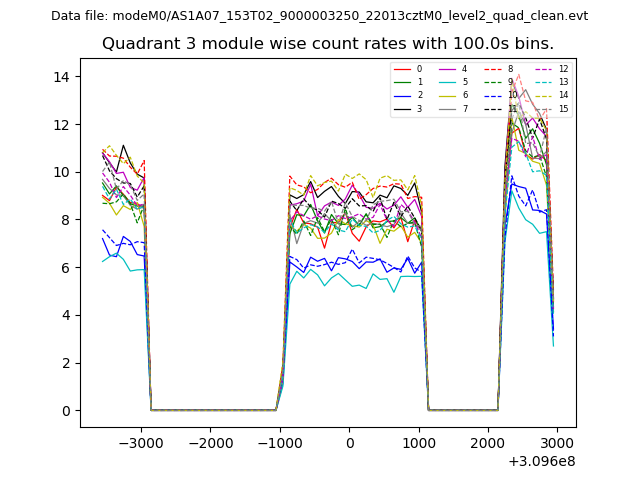
| Module-wise count rates for Quadrant C Data is divided into 100 sec bins |
 |
 |
| Module-wise count rates for Quadrant D Data is divided into 100 sec bins |
 |
 |
| Parameter | Plot |
|---|---|
| CZT HV Monitor | 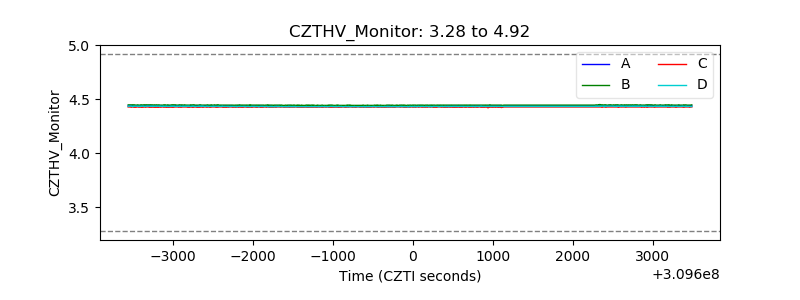 |
| D_VDD |  |
| Temperature 1 | 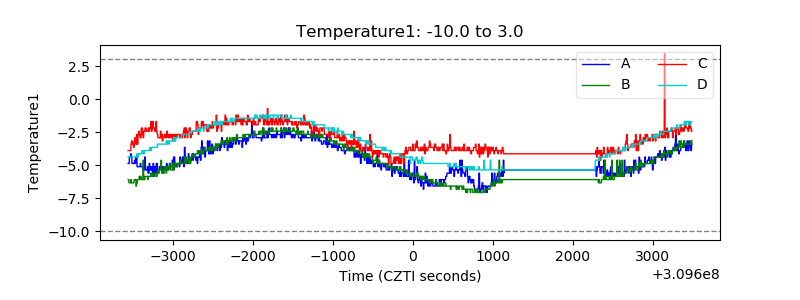 |
| Veto HV Monitor |  |
| Veto LLD | 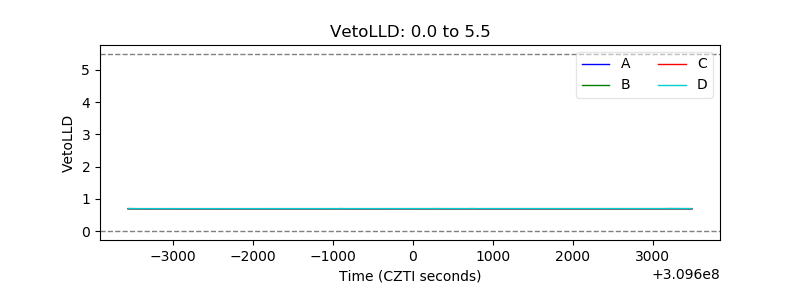 |
| Alpha Counter | 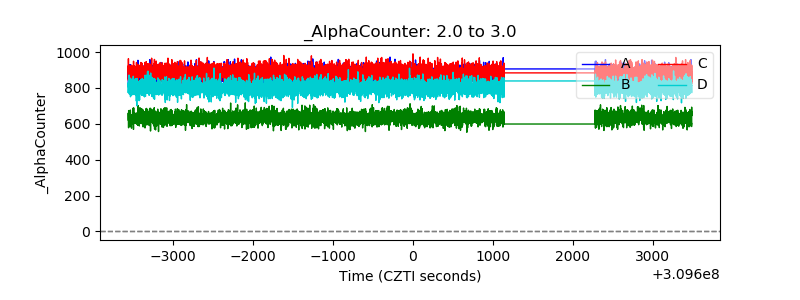 |
| _CPM_Rate | 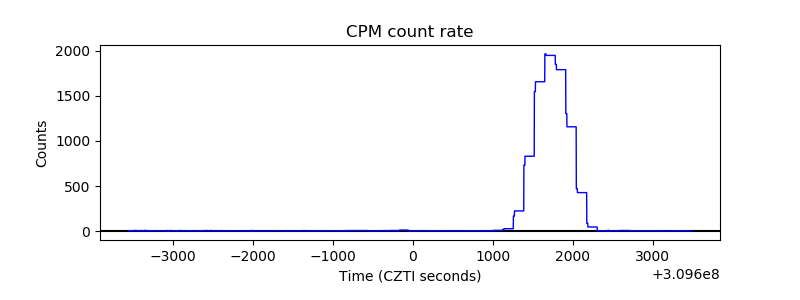 |
| CZT Counter | 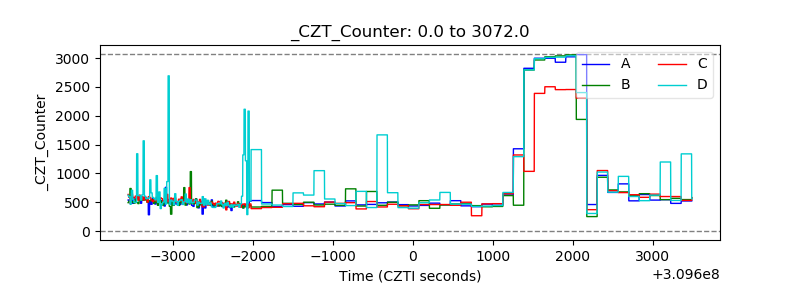 |
| +2.5 Volts monitor |  |
| +5 Volts monitor | 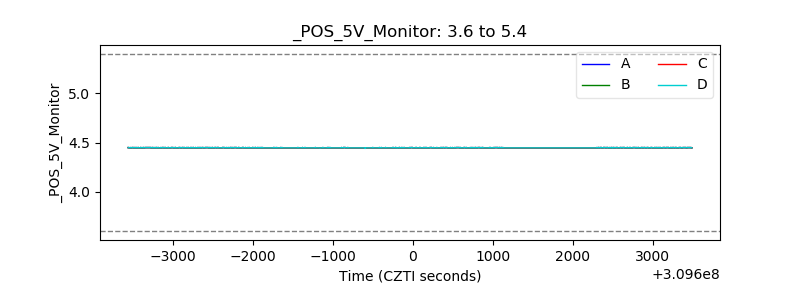 |
| _ROLL_ROT | 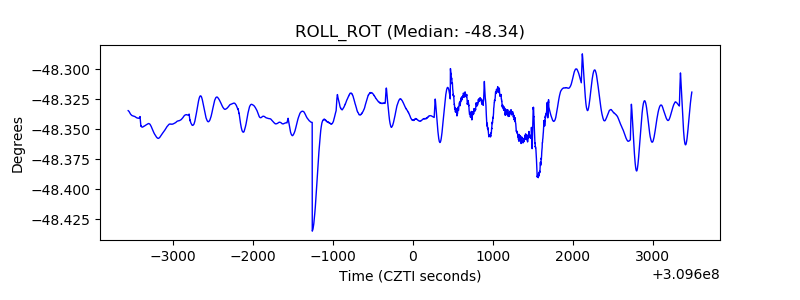 |
| _Roll_DEC | 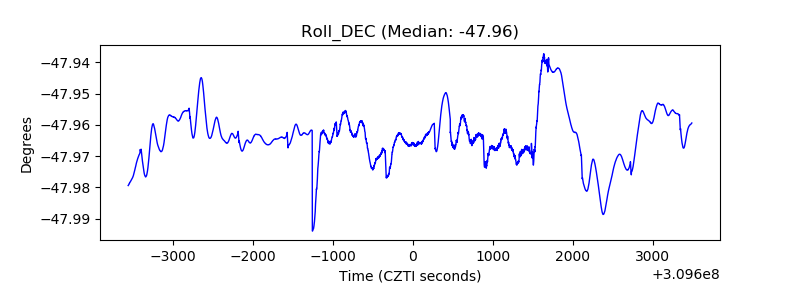 |
| _Roll_RA |  |
| Veto Counter | 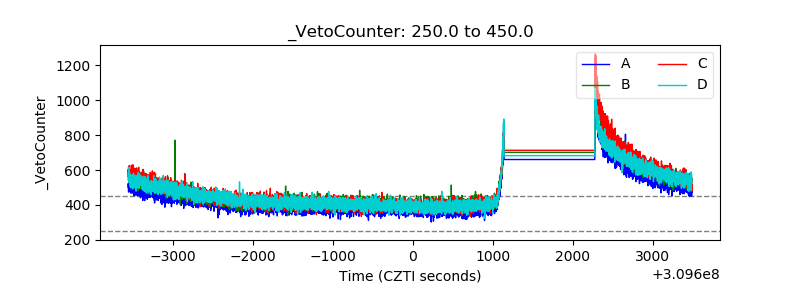 |