| Param | Original file | Final file |
|---|---|---|
| Filename | modeM0/AS1A07_153T02_9000003250_22016cztM0_level2.evt | modeM0/AS1A07_153T02_9000003250_22016cztM0_level2_quad_clean.evt |
| Size (bytes) | 519,624,000 | 76,553,280 |
| Size | 495.6 MB | 73.0 MB |
| Events in quadrant A | 3,688,361 | 482,245 |
| Events in quadrant B | 3,800,340 | 484,115 |
| Events in quadrant C | 3,584,501 | 454,206 |
| Events in quadrant D | 4,221,587 | 442,859 |
| Mode SS | |||
|---|---|---|---|
| Quadrant | BADHDUFLAG | Total packets | Discarded packets |
| A | 0 | 132 | 0 |
| B | 0 | 132 | 0 |
| C | 0 | 132 | 0 |
| D | 0 | 132 | 0 |
| Mode M0 | |||
|---|---|---|---|
| Quadrant | BADHDUFLAG | Total packets | Discarded packets |
| A | 0 | 15079 | 2 |
| B | 0 | 15576 | 2 |
| C | 0 | 14781 | 2 |
| D | 0 | 16963 | 2 |
| Mode M9 | |||
|---|---|---|---|
| Quadrant | BADHDUFLAG | Total packets | Discarded packets |
| A | 0 | 17 | 0 |
| B | 0 | 18 | 0 |
| C | 0 | 18 | 0 |
| D | 0 | 18 | 0 |
| Quadrant | Total seconds | Saturated seconds | Saturation percentage |
|---|---|---|---|
| A | 6518 | 145 | 2.224609% |
| B | 6518 | 162 | 2.485425% |
| C | 6517 | 181 | 2.777352% |
| D | 6517 | 208 | 3.191653% |
Noise dominated data is calculated using 1-second bins in cleaned event files. If a bin has >2000 counts, and if more than 50% of those come from <1% of pixels, then it is considered to be noise-dominated and hence unusable.
| Quadrant | # 1 sec bins | Bins with >0 counts | Bins with >2000 counts | High rate bins dominated by noise | Noise dominated (total time) | Noise dominated (detector-on time) | Marked lightcurve |
|---|---|---|---|---|---|---|---|
| A | 7828 | 6518 | 1 | 1 | 0.01% | 0.02% | 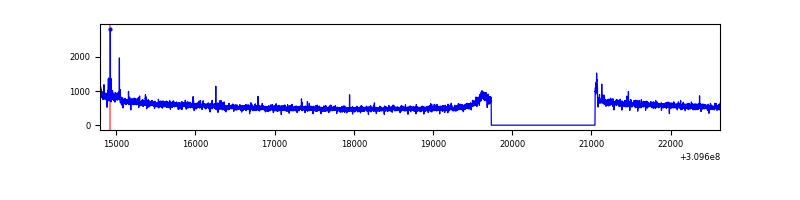 |
| B | 7828 | 6518 | 13 | 13 | 0.17% | 0.20% | 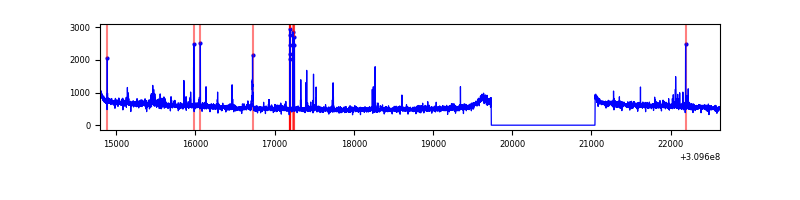 |
| C | 7827 | 6517 | 0 | 0 | 0.00% | 0.00% | 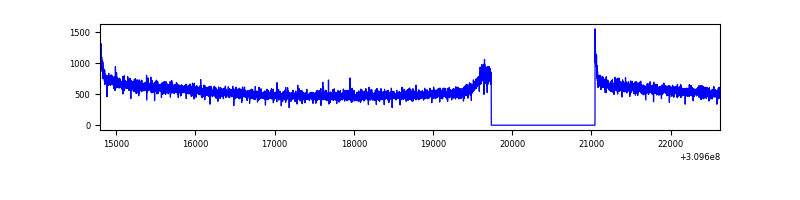 |
| D | 7827 | 6517 | 79 | 79 | 1.01% | 1.21% | 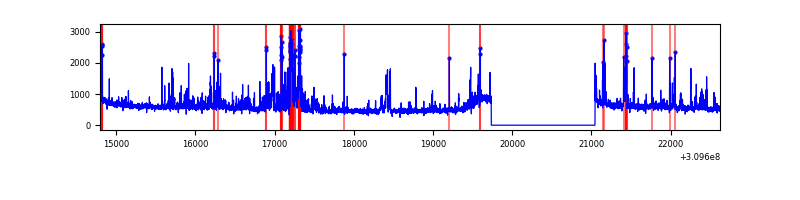 |
Top three noisy pixels from each quadrant. If the there are fewer than three noisy pixels in the level2.evt file, extra rows are filled as -1
| Pixel properties | Quadrant properties | ||||||
|---|---|---|---|---|---|---|---|
| Quadrant | DetID | PixID | Counts | Sigma | Mean | Median | Sigma |
| A | 15 | 236 | 49115 | 264.93 | 940 | 925 | 181.9 |
| A | 3 | 1 | 17964 | 93.67 | 940 | 925 | 181.9 |
| A | 13 | 254 | 11374 | 57.44 | 940 | 925 | 181.9 |
| B | 3 | 64 | 103863 | 604.96 | 926 | 907 | 170.2 |
| B | 0 | 230 | 29742 | 169.43 | 926 | 907 | 170.2 |
| B | 12 | 111 | 19512 | 109.32 | 926 | 907 | 170.2 |
| C | 14 | 238 | 142594 | 710.16 | 879 | 888 | 199.5 |
| C | 0 | 10 | 13577 | 63.59 | 879 | 888 | 199.5 |
| C | 13 | 61 | 6277 | 27.01 | 879 | 888 | 199.5 |
| D | 11 | 176 | 291859 | 1370.17 | 895 | 871 | 212.4 |
| D | 7 | 238 | 172524 | 808.26 | 895 | 871 | 212.4 |
| D | 1 | 52 | 148713 | 696.14 | 895 | 871 | 212.4 |
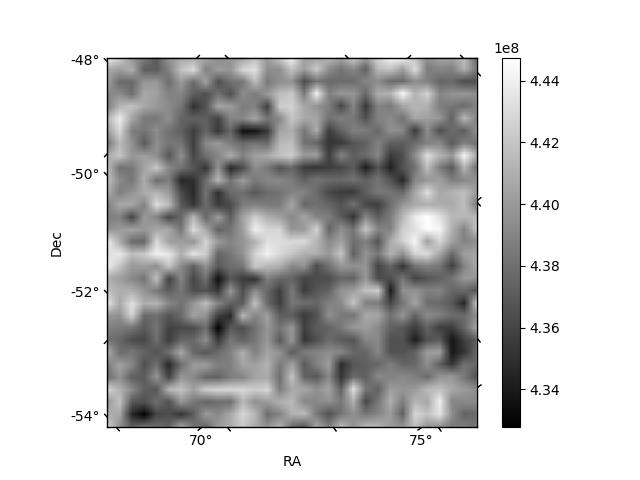
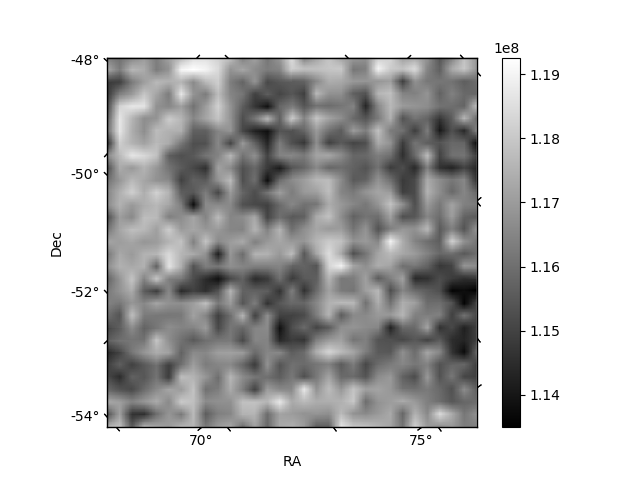
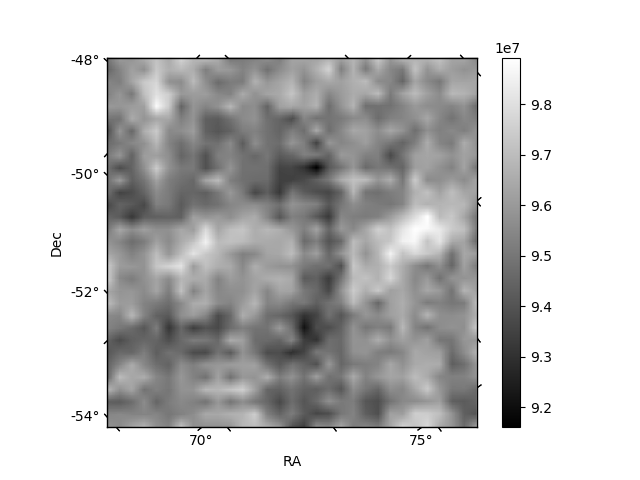
Histogram calculated using DETX and DETY for each event in the final _common_clean file
| Quadrant A | 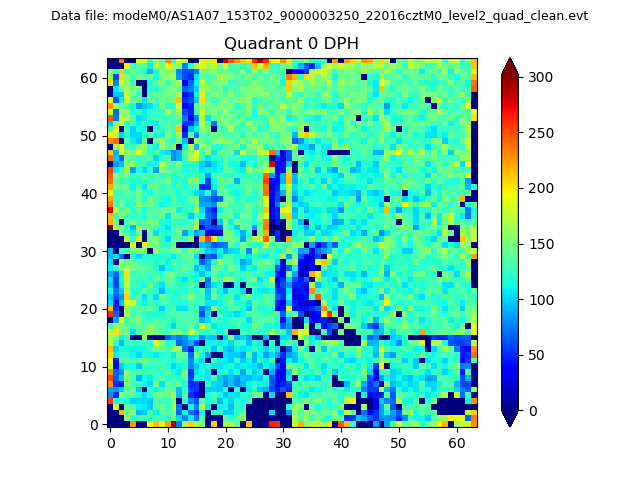 |
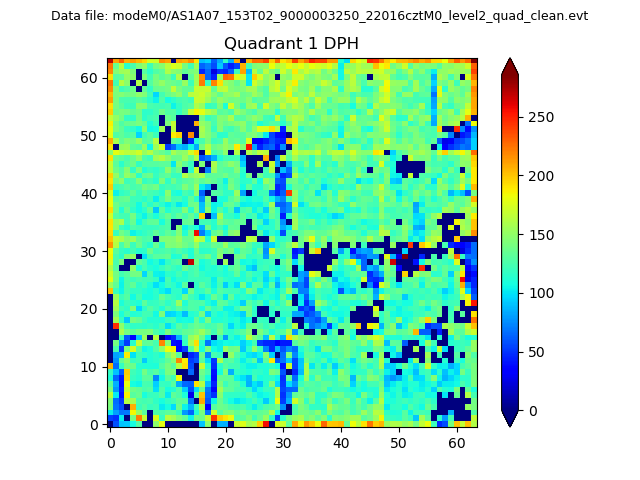 |
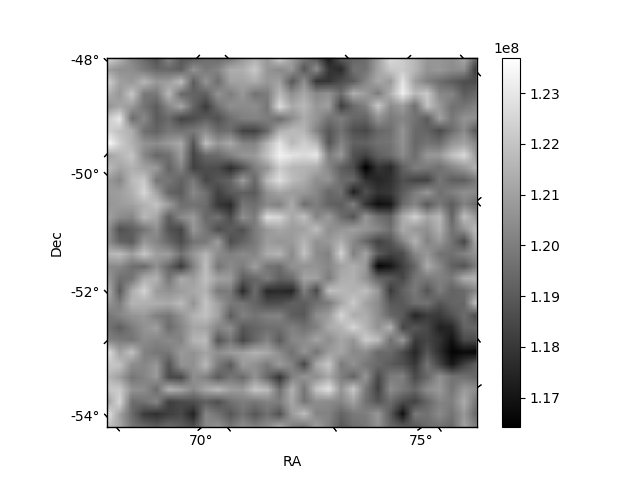
Quadrant B |
|---|---|---|---|
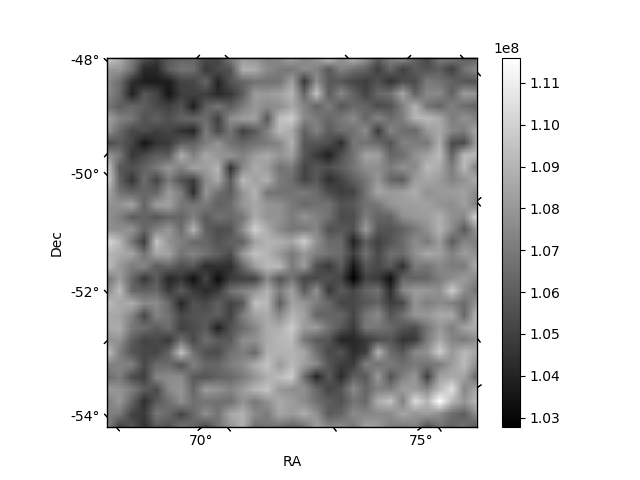
| Quadrant D | 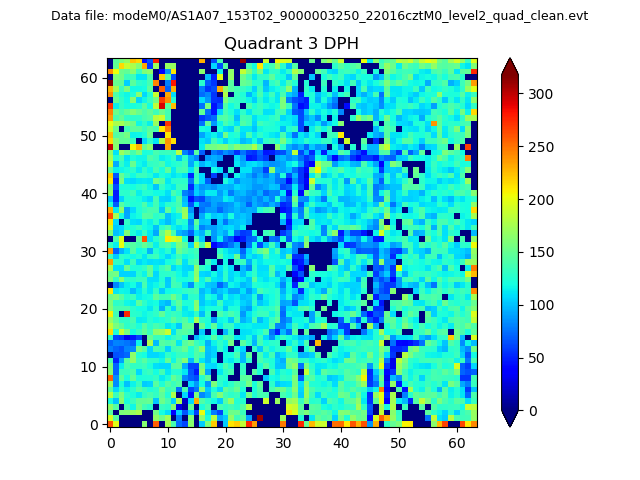 |
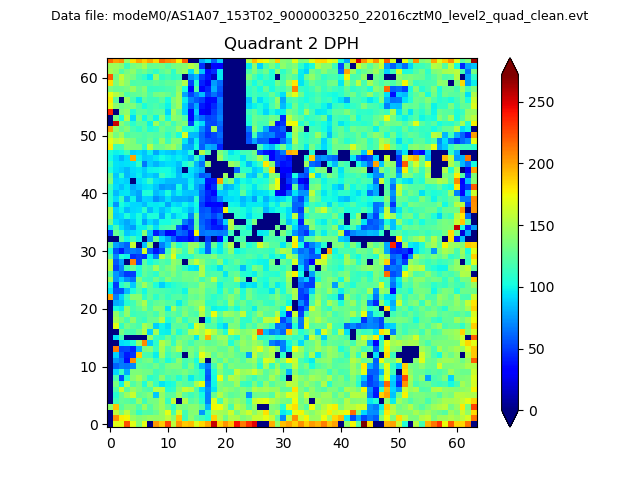 |
Quadrant C |
| Plot type | Count rate plots | Images |
|---|---|---|
| Comparison with Poisson distribution Blue bars denote a histogram of data divided into 1 sec bins. Red curve is a Poisson curve with rate = median count rate of data. |
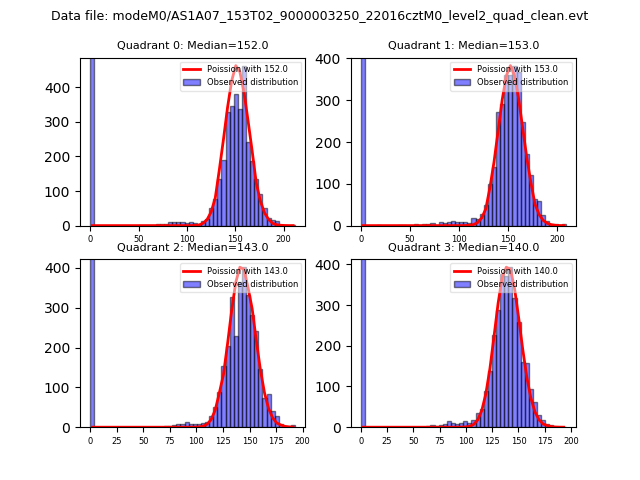 |
 |
| Quadrant-wise count rates Data is divided into 100 sec bins |
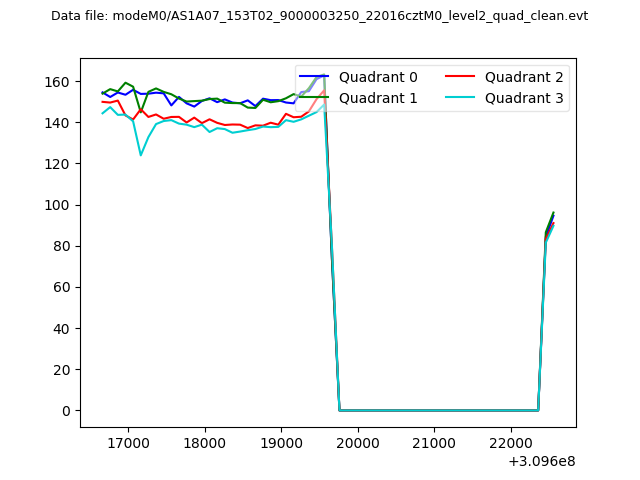 |
|
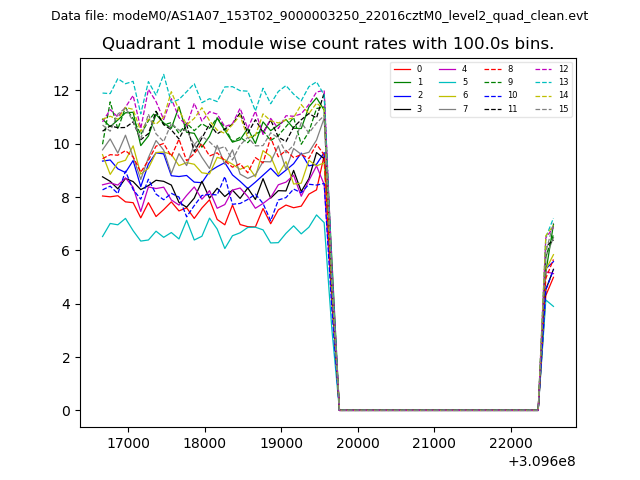
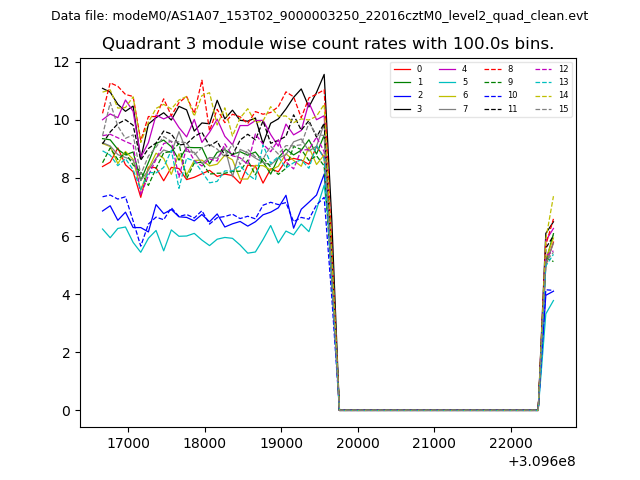
| Module-wise count rates for Quadrant A Data is divided into 100 sec bins |
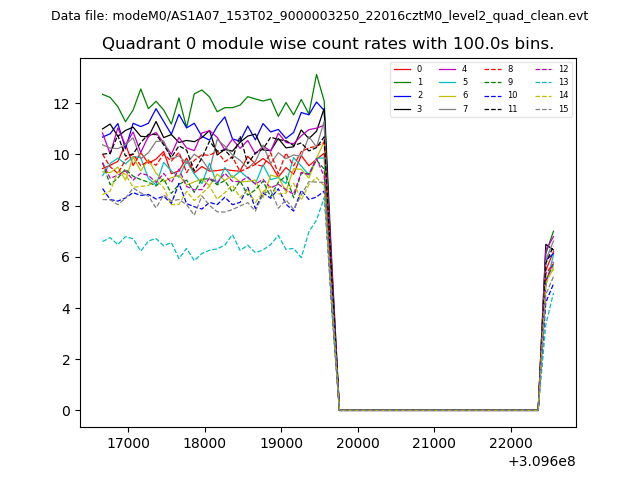 |
 |
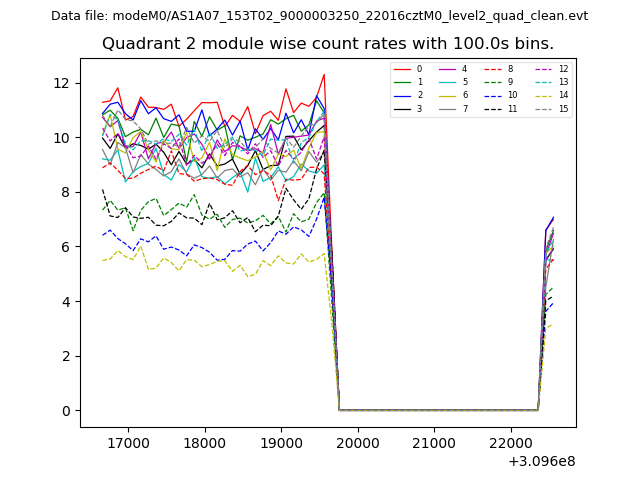
| Module-wise count rates for Quadrant B Data is divided into 100 sec bins |
 |
 |
| Module-wise count rates for Quadrant C Data is divided into 100 sec bins |
 |
 |
| Module-wise count rates for Quadrant D Data is divided into 100 sec bins |
 |
 |
| Parameter | Plot |
|---|---|
| CZT HV Monitor | 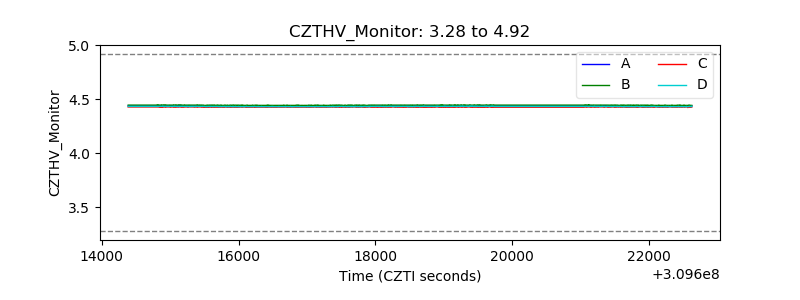 |
| D_VDD | 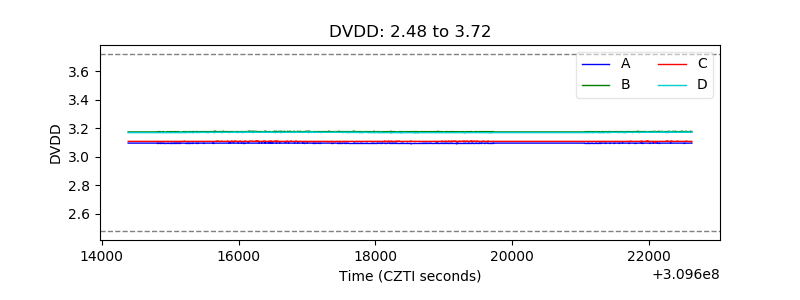 |
| Temperature 1 | 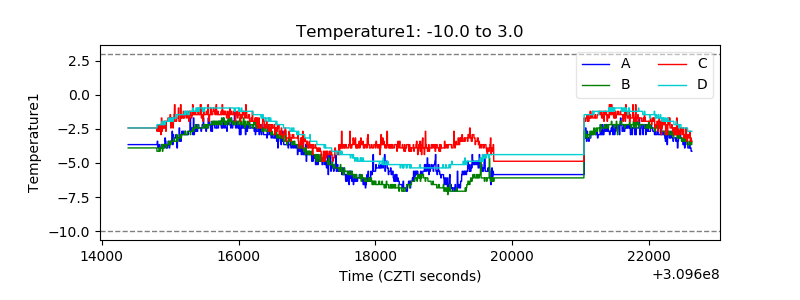 |
| Veto HV Monitor | 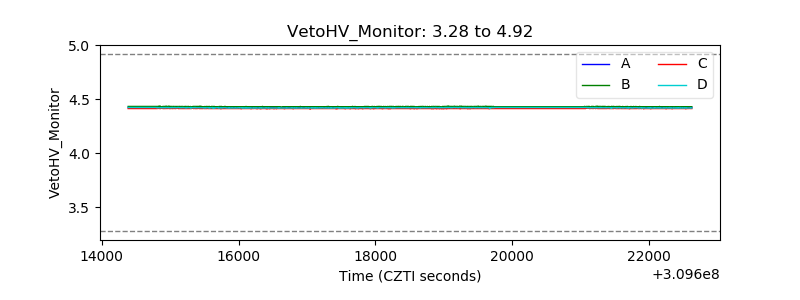 |
| Veto LLD | 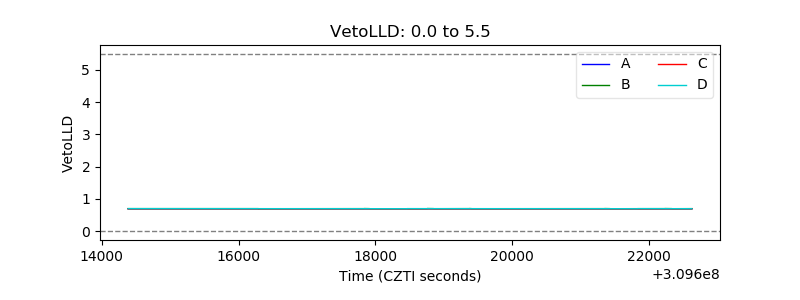 |
| Alpha Counter | 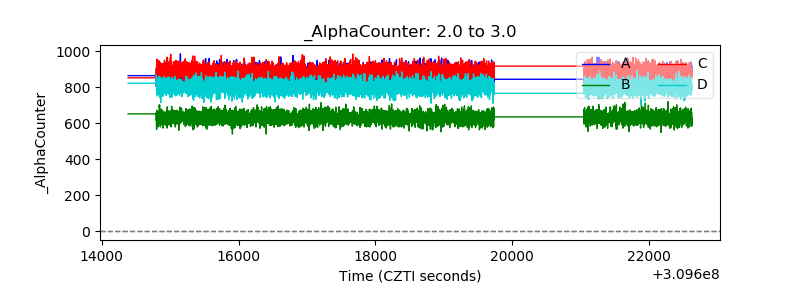 |
| _CPM_Rate | 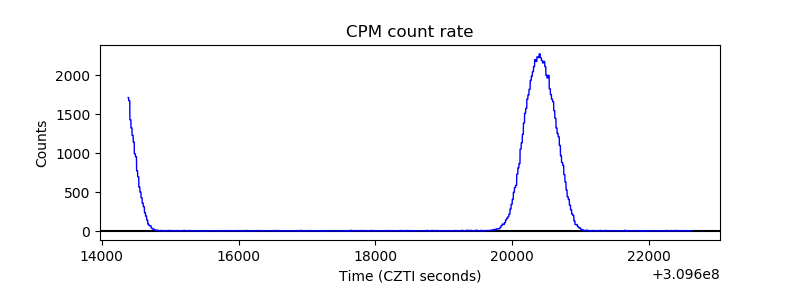 |
| CZT Counter | 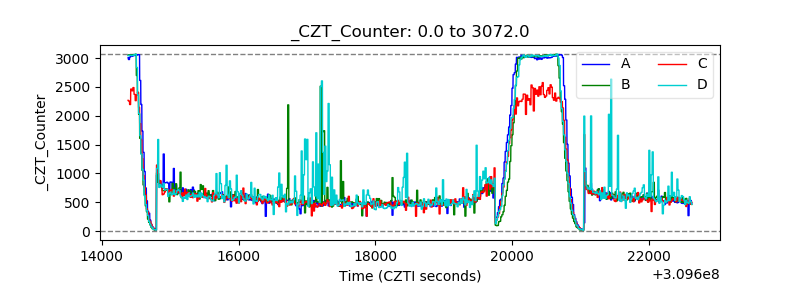 |
| +2.5 Volts monitor |  |
| +5 Volts monitor |  |
| _ROLL_ROT | 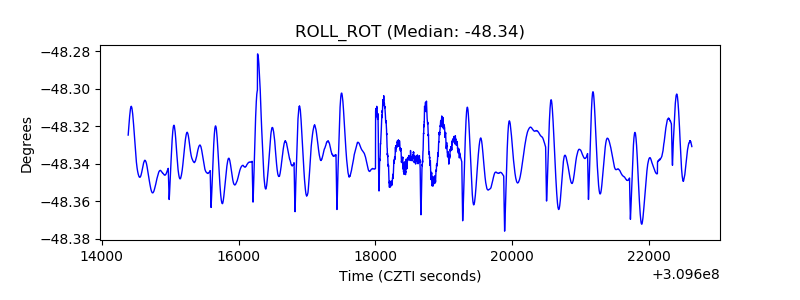 |
| _Roll_DEC | 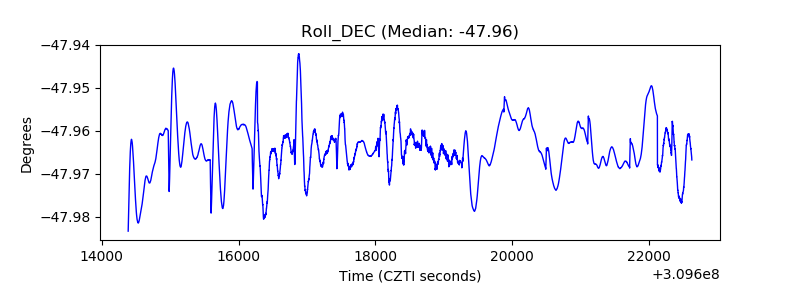 |
| _Roll_RA | 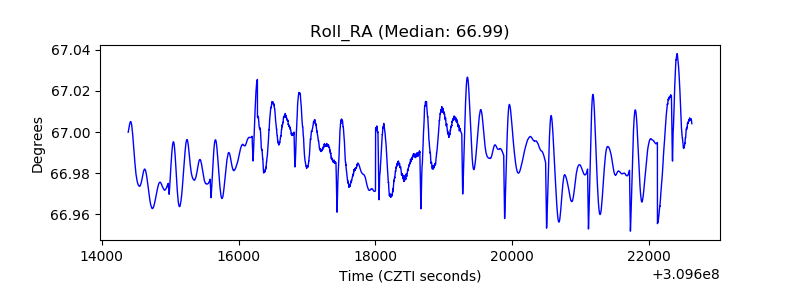 |
| Veto Counter | 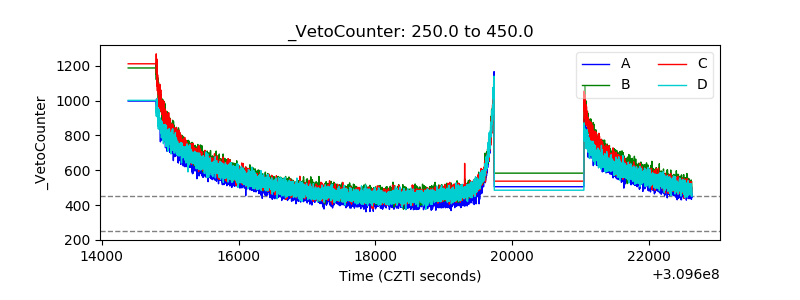 |