| Param | Original file | Final file |
|---|---|---|
| Filename | modeM0/AS1A07_153T02_9000003250_22018cztM0_level2.evt | modeM0/AS1A07_153T02_9000003250_22018cztM0_level2_quad_clean.evt |
| Size (bytes) | 186,284,160 | 31,409,280 |
| Size | 177.7 MB | 30.0 MB |
| Events in quadrant A | 1,288,698 | 198,911 |
| Events in quadrant B | 1,458,457 | 199,505 |
| Events in quadrant C | 1,251,347 | 189,559 |
| Events in quadrant D | 1,472,648 | 184,620 |
| Mode SS | |||
|---|---|---|---|
| Quadrant | BADHDUFLAG | Total packets | Discarded packets |
| A | 0 | 52 | 0 |
| B | 0 | 52 | 0 |
| C | 0 | 52 | 0 |
| D | 0 | 52 | 0 |
| Mode M0 | |||
|---|---|---|---|
| Quadrant | BADHDUFLAG | Total packets | Discarded packets |
| A | 0 | 5342 | 0 |
| B | 0 | 5910 | 0 |
| C | 0 | 5243 | 0 |
| D | 0 | 6014 | 0 |
| Mode M9 | |||
|---|---|---|---|
| Quadrant | BADHDUFLAG | Total packets | Discarded packets |
| A | 0 | 13 | 0 |
| B | 0 | 13 | 0 |
| C | 0 | 13 | 0 |
| D | 0 | 13 | 0 |
| Quadrant | Total seconds | Saturated seconds | Saturation percentage |
|---|---|---|---|
| A | 2474 | 49 | 1.980598% |
| B | 2475 | 101 | 4.080808% |
| C | 2475 | 63 | 2.545455% |
| D | 2475 | 82 | 3.313131% |
Noise dominated data is calculated using 1-second bins in cleaned event files. If a bin has >2000 counts, and if more than 50% of those come from <1% of pixels, then it is considered to be noise-dominated and hence unusable.
| Quadrant | # 1 sec bins | Bins with >0 counts | Bins with >2000 counts | High rate bins dominated by noise | Noise dominated (total time) | Noise dominated (detector-on time) | Marked lightcurve |
|---|---|---|---|---|---|---|---|
| A | 3729 | 2474 | 0 | 0 | 0.00% | 0.00% | 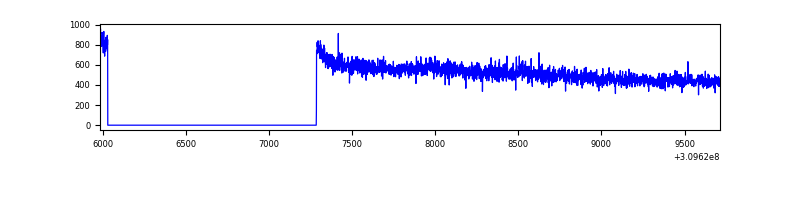 |
| B | 3730 | 2475 | 40 | 40 | 1.07% | 1.62% | 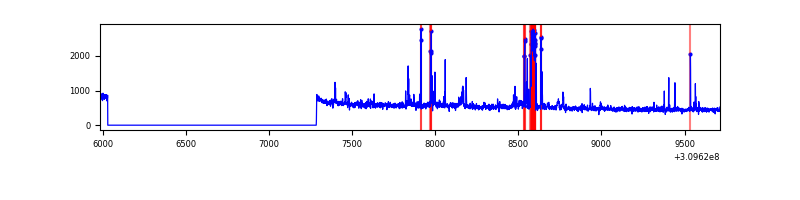 |
| C | 3730 | 2475 | 0 | 0 | 0.00% | 0.00% | 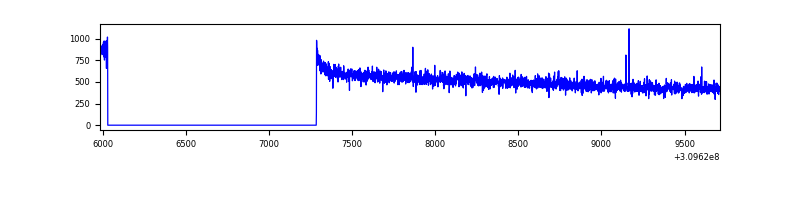 |
| D | 3730 | 2475 | 29 | 29 | 0.78% | 1.17% | 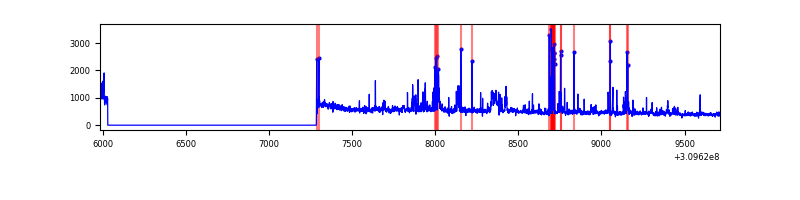 |
Top three noisy pixels from each quadrant. If the there are fewer than three noisy pixels in the level2.evt file, extra rows are filled as -1
| Pixel properties | Quadrant properties | ||||||
|---|---|---|---|---|---|---|---|
| Quadrant | DetID | PixID | Counts | Sigma | Mean | Median | Sigma |
| A | 3 | 1 | 14308 | 205.42 | 330 | 323 | 68.1 |
| A | 13 | 254 | 4778 | 65.44 | 330 | 323 | 68.1 |
| A | 0 | 226 | 2968 | 38.85 | 330 | 323 | 68.1 |
| B | 3 | 64 | 130861 | 2067.62 | 326 | 318 | 63.1 |
| B | 0 | 190 | 29503 | 462.25 | 326 | 318 | 63.1 |
| B | 0 | 245 | 12637 | 195.12 | 326 | 318 | 63.1 |
| C | 14 | 238 | 49845 | 684.55 | 307 | 309 | 72.4 |
| C | 13 | 61 | 2201 | 26.15 | 307 | 309 | 72.4 |
| C | 10 | 22 | 1979 | 23.08 | 307 | 309 | 72.4 |
| D | 7 | 238 | 111056 | 1447.5 | 310 | 302 | 76.5 |
| D | 1 | 52 | 82450 | 1073.63 | 310 | 302 | 76.5 |
| D | 13 | 172 | 52883 | 687.21 | 310 | 302 | 76.5 |
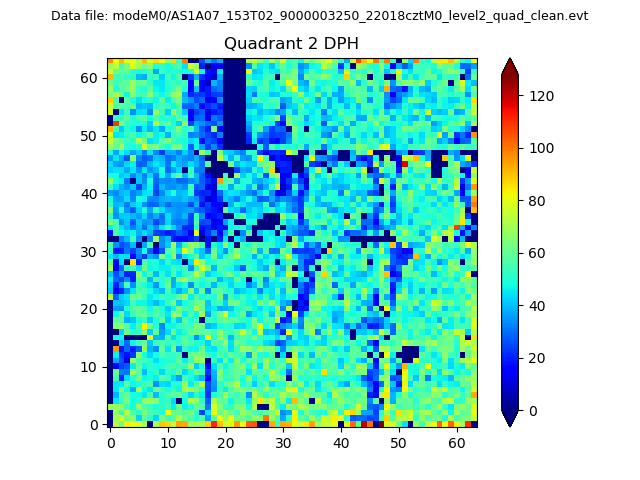
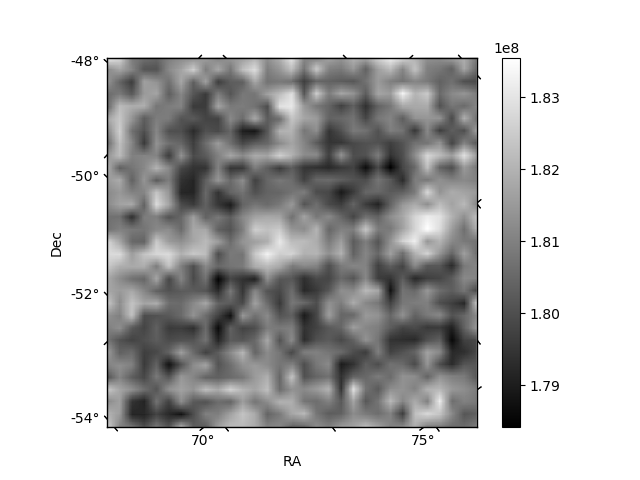
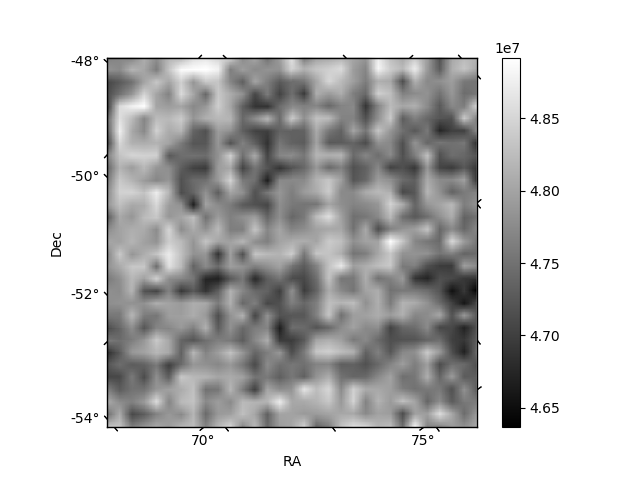
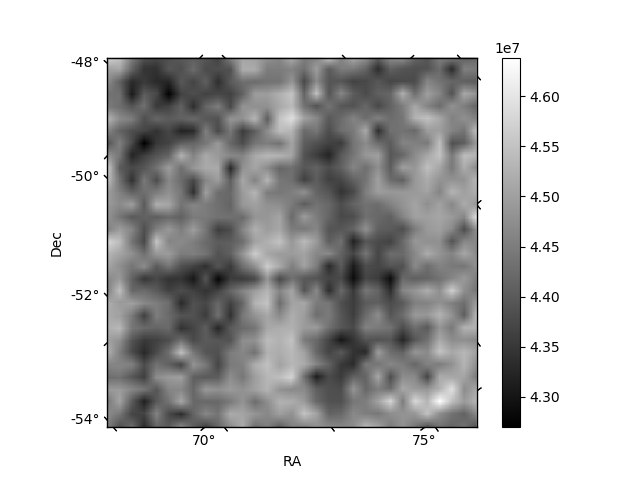
Histogram calculated using DETX and DETY for each event in the final _common_clean file
| Quadrant A | 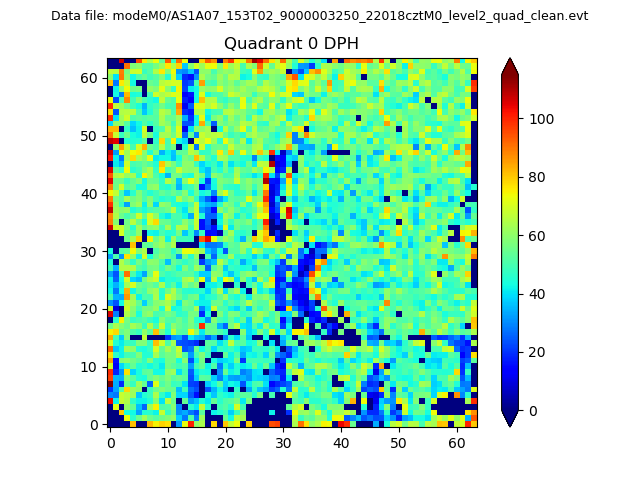 |
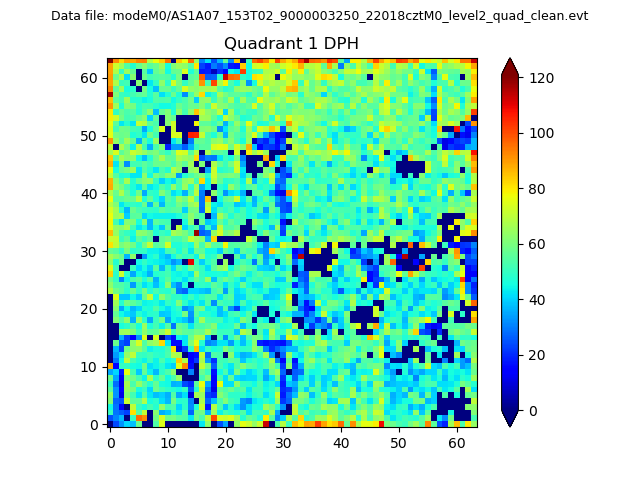 |
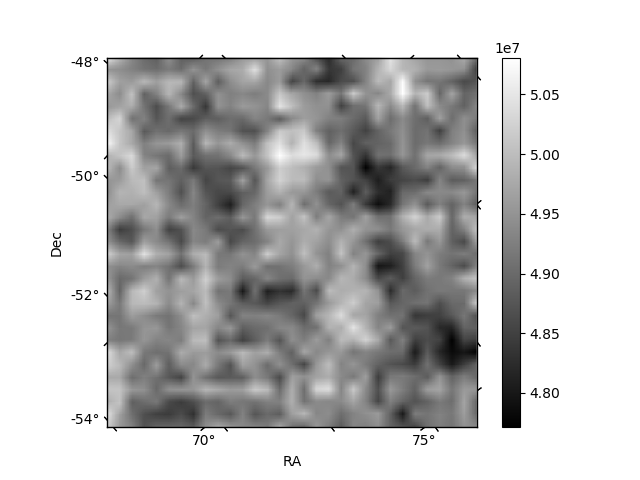
Quadrant B |
|---|---|---|---|
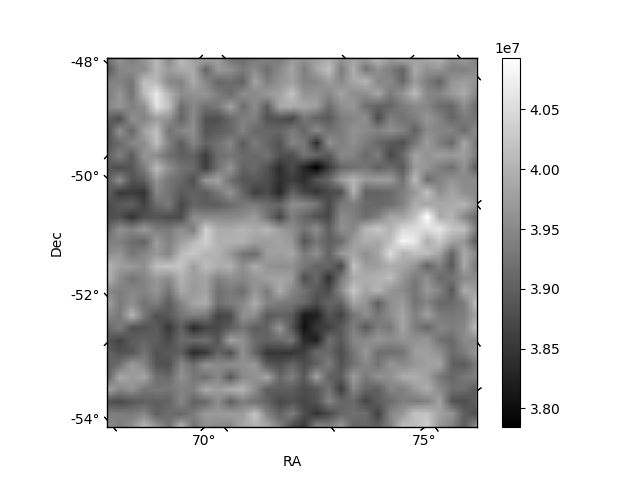
| Quadrant D | 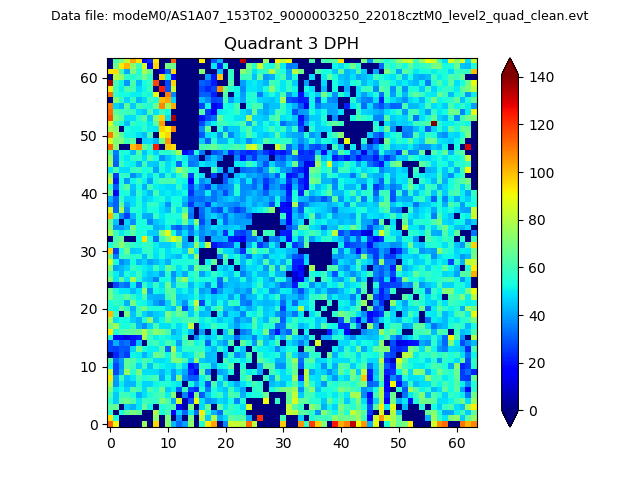 |
 |
Quadrant C |
| Plot type | Count rate plots | Images |
|---|---|---|
| Comparison with Poisson distribution Blue bars denote a histogram of data divided into 1 sec bins. Red curve is a Poisson curve with rate = median count rate of data. |
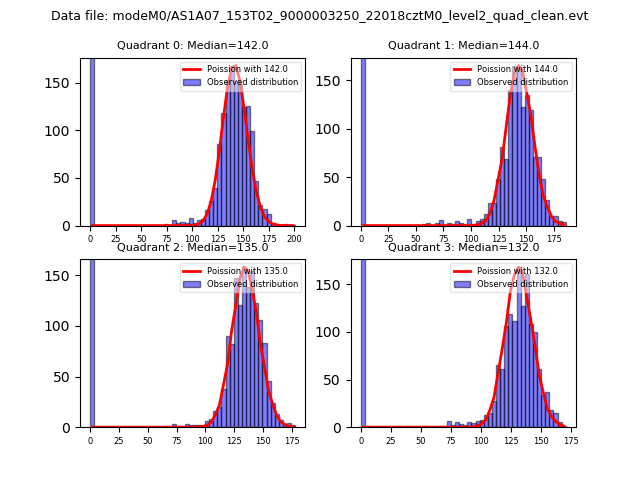 |
 |
| Quadrant-wise count rates Data is divided into 100 sec bins |
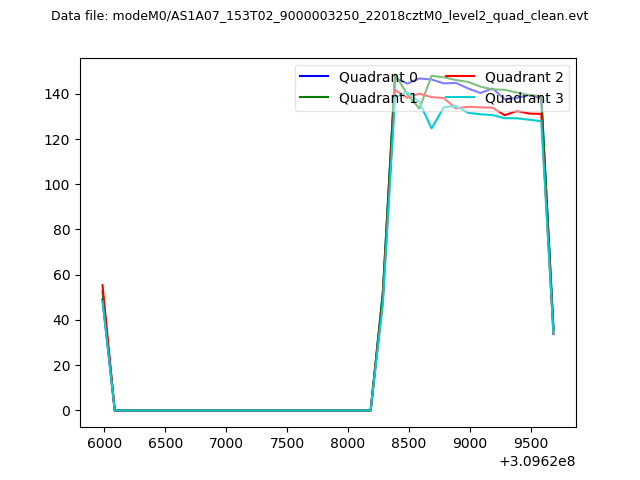 |
|
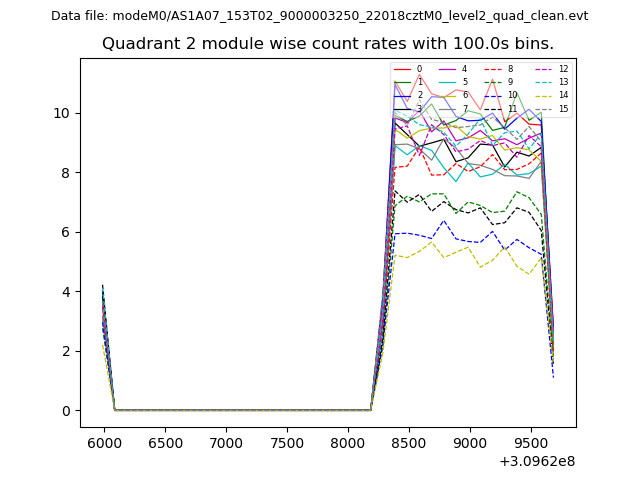
| Module-wise count rates for Quadrant A Data is divided into 100 sec bins |
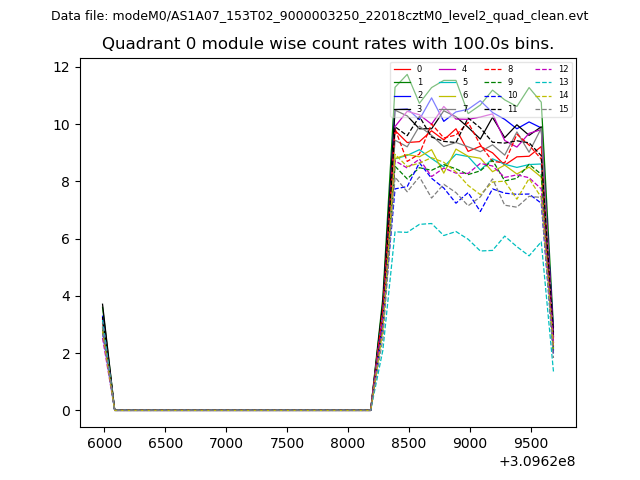 |
 |
| Module-wise count rates for Quadrant B Data is divided into 100 sec bins |
 |
 |
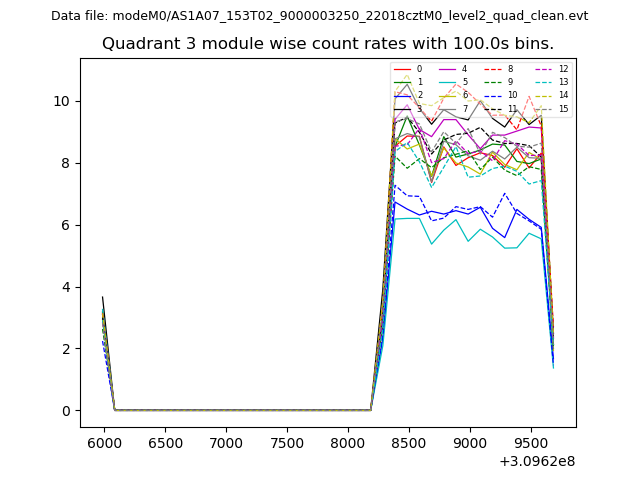
| Module-wise count rates for Quadrant C Data is divided into 100 sec bins |
 |
 |
| Module-wise count rates for Quadrant D Data is divided into 100 sec bins |
 |
 |
| Parameter | Plot |
|---|---|
| CZT HV Monitor | 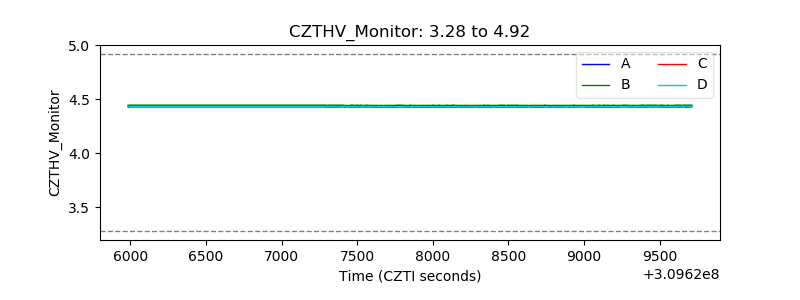 |
| D_VDD | 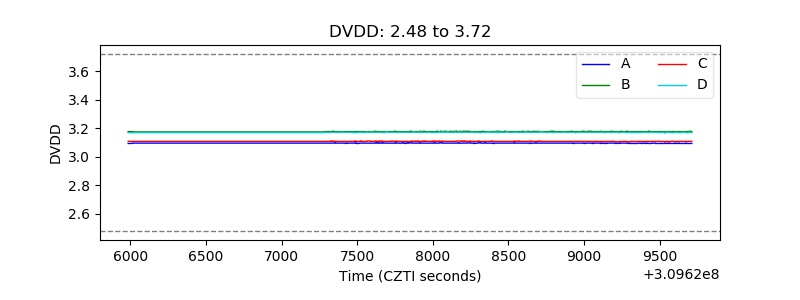 |
| Temperature 1 | 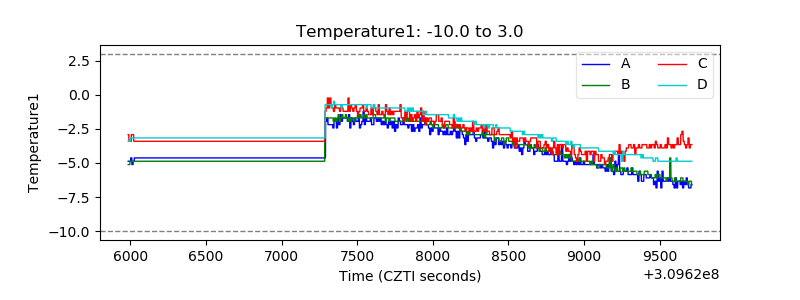 |
| Veto HV Monitor | 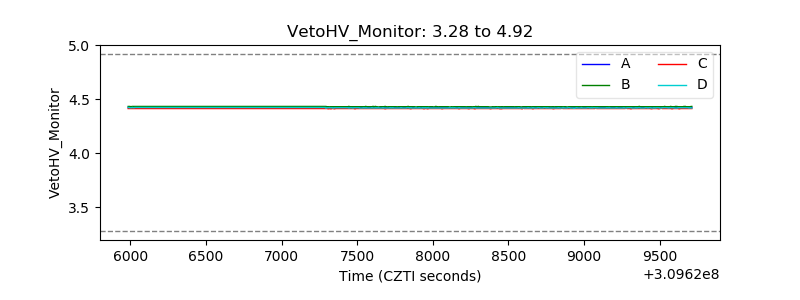 |
| Veto LLD | 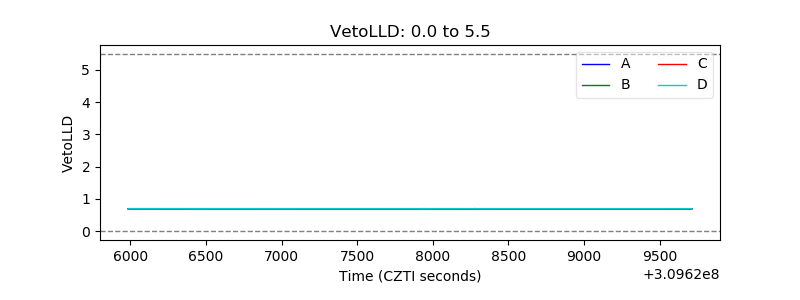 |
| Alpha Counter | 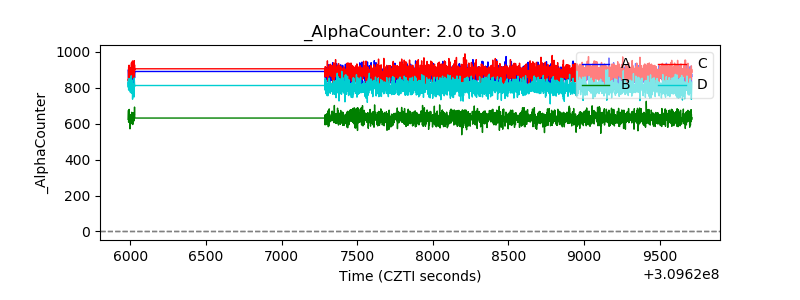 |
| _CPM_Rate | 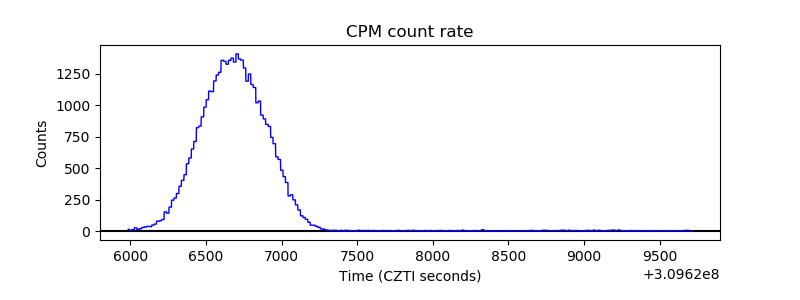 |
| CZT Counter | 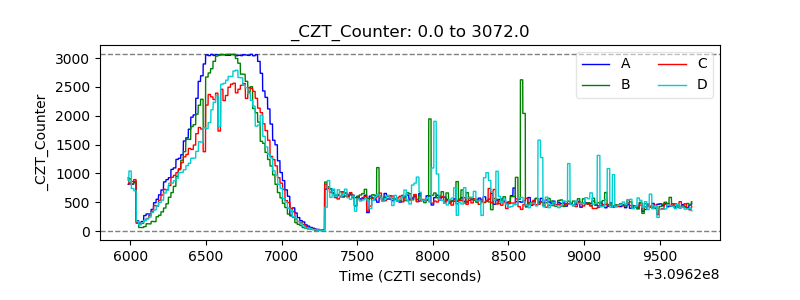 |
| +2.5 Volts monitor |  |
| +5 Volts monitor |  |
| _ROLL_ROT | 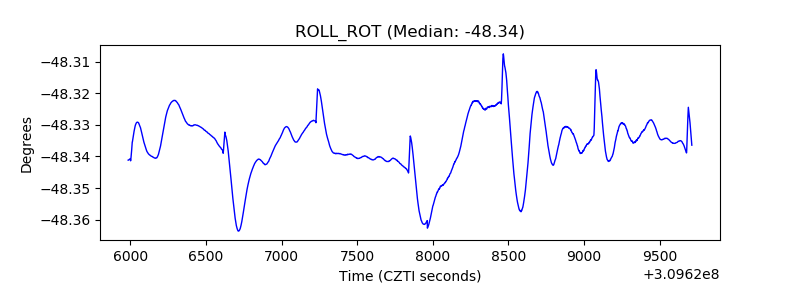 |
| _Roll_DEC |  |
| _Roll_RA | 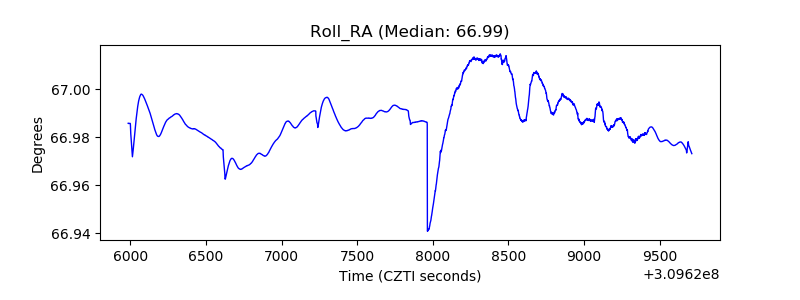 |
| Veto Counter | 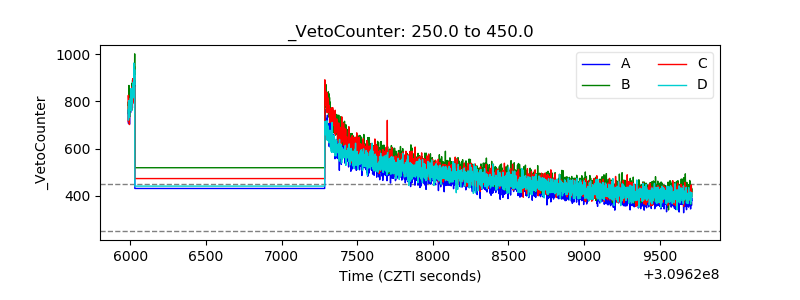 |