| Param | Original file | Final file |
|---|---|---|
| Filename | modeM0/AS1A07_059T05_9000003252_22018cztM0_level2.evt | modeM0/AS1A07_059T05_9000003252_22018cztM0_level2_quad_clean.evt |
| Size (bytes) | 228,623,040 | 32,797,440 |
| Size | 218.0 MB | 31.3 MB |
| Events in quadrant A | 1,515,417 | 205,706 |
| Events in quadrant B | 1,571,859 | 209,487 |
| Events in quadrant C | 1,479,164 | 198,665 |
| Events in quadrant D | 2,166,086 | 179,251 |
| Mode SS | |||
|---|---|---|---|
| Quadrant | BADHDUFLAG | Total packets | Discarded packets |
| A | 0 | 58 | 0 |
| B | 0 | 58 | 0 |
| C | 0 | 58 | 0 |
| D | 0 | 58 | 0 |
| Mode M0 | |||
|---|---|---|---|
| Quadrant | BADHDUFLAG | Total packets | Discarded packets |
| A | 0 | 6116 | 1 |
| B | 0 | 6300 | 1 |
| C | 0 | 5999 | 1 |
| D | 0 | 8228 | 1 |
| Mode M9 | |||
|---|---|---|---|
| Quadrant | BADHDUFLAG | Total packets | Discarded packets |
| A | 0 | 10 | 0 |
| B | 0 | 10 | 0 |
| C | 0 | 10 | 0 |
| D | 0 | 10 | 0 |
| Quadrant | Total seconds | Saturated seconds | Saturation percentage |
|---|---|---|---|
| A | 2788 | 62 | 2.223816% |
| B | 2788 | 93 | 3.335725% |
| C | 2788 | 87 | 3.120516% |
| D | 2788 | 257 | 9.218077% |
Noise dominated data is calculated using 1-second bins in cleaned event files. If a bin has >2000 counts, and if more than 50% of those come from <1% of pixels, then it is considered to be noise-dominated and hence unusable.
| Quadrant | # 1 sec bins | Bins with >0 counts | Bins with >2000 counts | High rate bins dominated by noise | Noise dominated (total time) | Noise dominated (detector-on time) | Marked lightcurve |
|---|---|---|---|---|---|---|---|
| A | 3813 | 2789 | 0 | 0 | 0.00% | 0.00% | 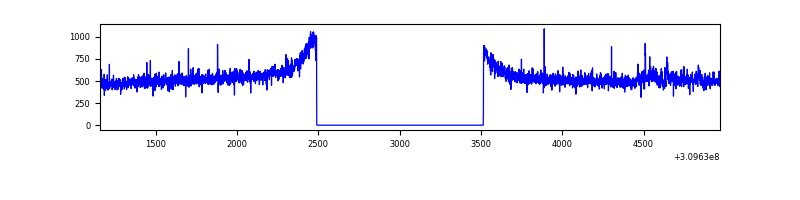 |
| B | 3813 | 2788 | 5 | 5 | 0.13% | 0.18% | 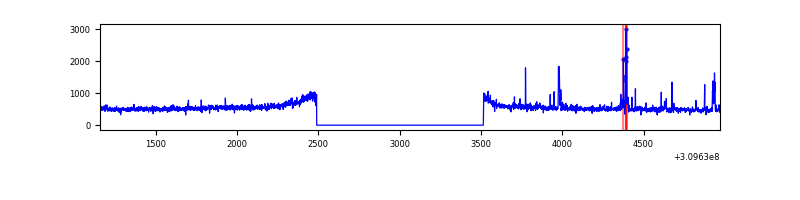 |
| C | 3813 | 2788 | 0 | 0 | 0.00% | 0.00% | 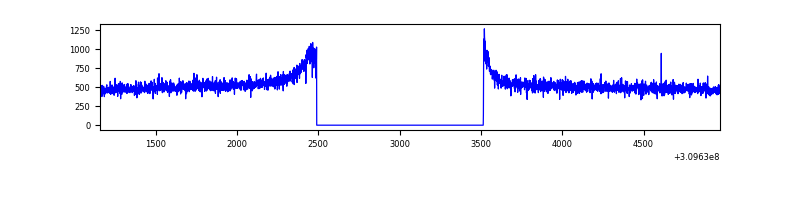 |
| D | 3813 | 2788 | 189 | 189 | 4.96% | 6.78% | 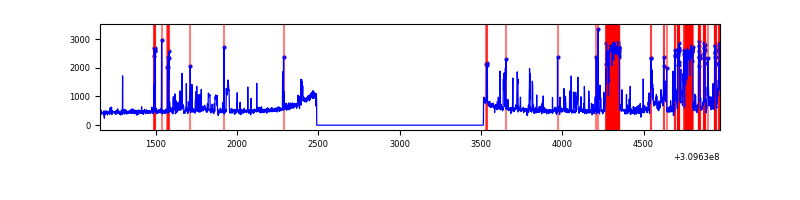 |
Top three noisy pixels from each quadrant. If the there are fewer than three noisy pixels in the level2.evt file, extra rows are filled as -1
| Pixel properties | Quadrant properties | ||||||
|---|---|---|---|---|---|---|---|
| Quadrant | DetID | PixID | Counts | Sigma | Mean | Median | Sigma |
| A | 3 | 1 | 34509 | 434.28 | 383 | 374 | 78.6 |
| A | 13 | 254 | 5231 | 61.79 | 383 | 374 | 78.6 |
| A | 0 | 226 | 3461 | 39.27 | 383 | 374 | 78.6 |
| B | 3 | 64 | 55173 | 734.16 | 378 | 369 | 74.6 |
| B | 0 | 219 | 11949 | 155.13 | 378 | 369 | 74.6 |
| B | 0 | 230 | 10656 | 137.81 | 378 | 369 | 74.6 |
| C | 14 | 238 | 56308 | 643.08 | 363 | 365 | 87.0 |
| C | 0 | 10 | 5805 | 62.53 | 363 | 365 | 87.0 |
| C | 13 | 61 | 2528 | 24.86 | 363 | 365 | 87.0 |
| D | 1 | 52 | 520155 | 5933.41 | 358 | 348 | 87.6 |
| D | 7 | 238 | 169970 | 1936.17 | 358 | 348 | 87.6 |
| D | 7 | 38 | 48520 | 549.87 | 358 | 348 | 87.6 |
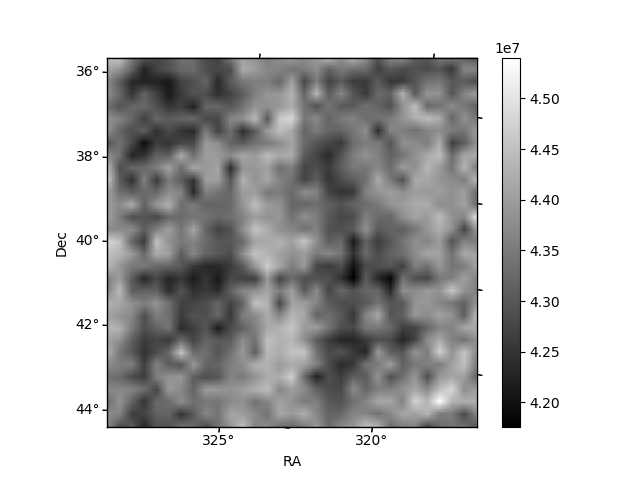
Histogram calculated using DETX and DETY for each event in the final _common_clean file
| Quadrant A | 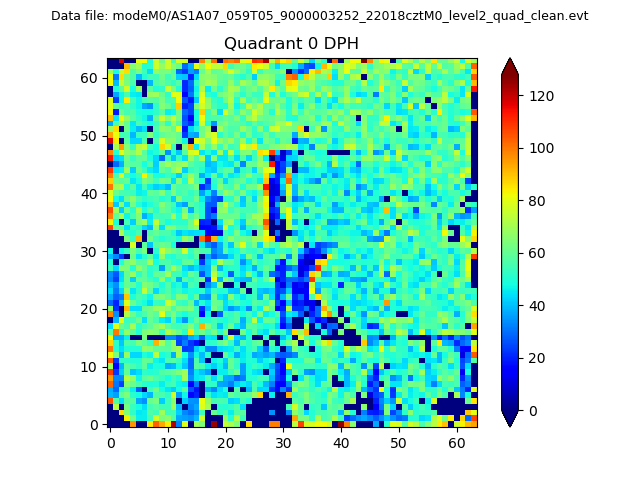 |
 |
Quadrant B |
|---|---|---|---|
| Quadrant D | 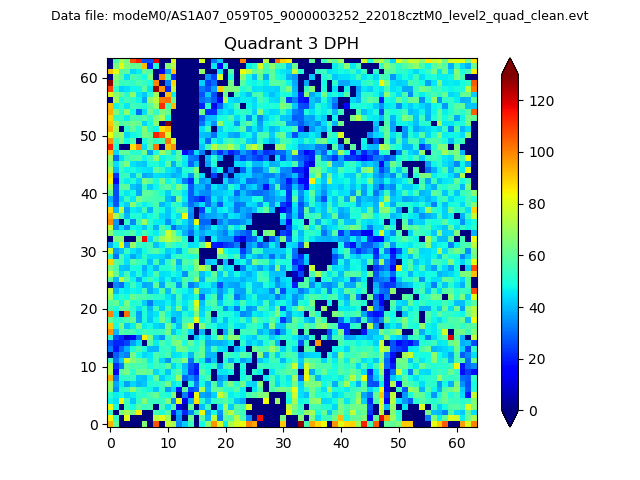 |
 |
Quadrant C |
| Plot type | Count rate plots | Images |
|---|---|---|
| Comparison with Poisson distribution Blue bars denote a histogram of data divided into 1 sec bins. Red curve is a Poisson curve with rate = median count rate of data. |
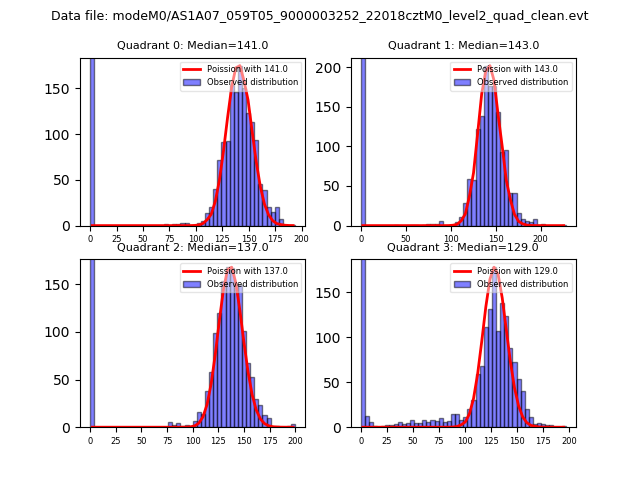 |
 |
| Quadrant-wise count rates Data is divided into 100 sec bins |
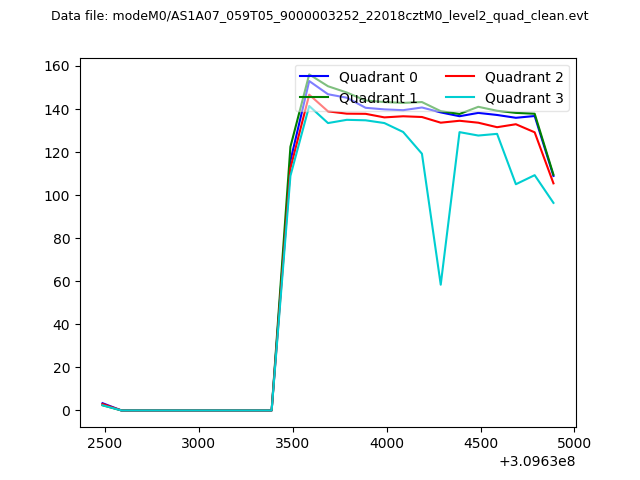 |
|
| Module-wise count rates for Quadrant A Data is divided into 100 sec bins |
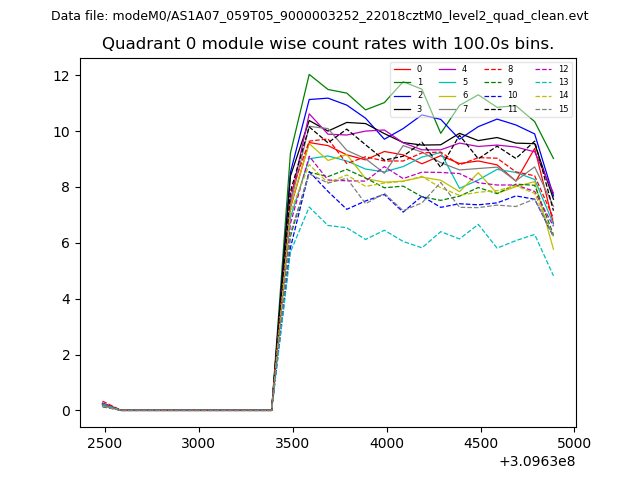 |
 |
| Module-wise count rates for Quadrant B Data is divided into 100 sec bins |
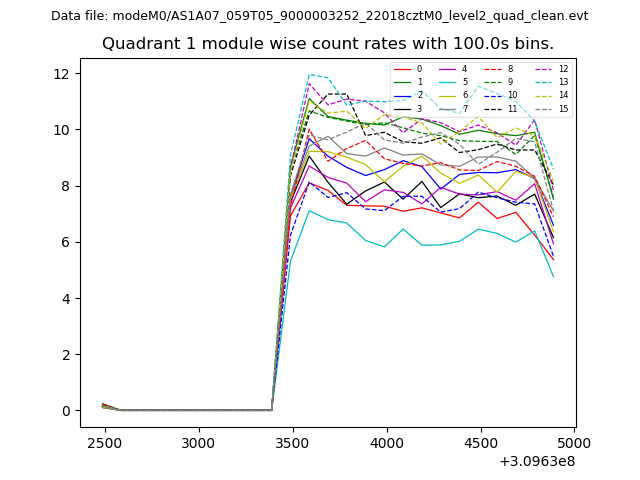 |
 |
| Module-wise count rates for Quadrant C Data is divided into 100 sec bins |
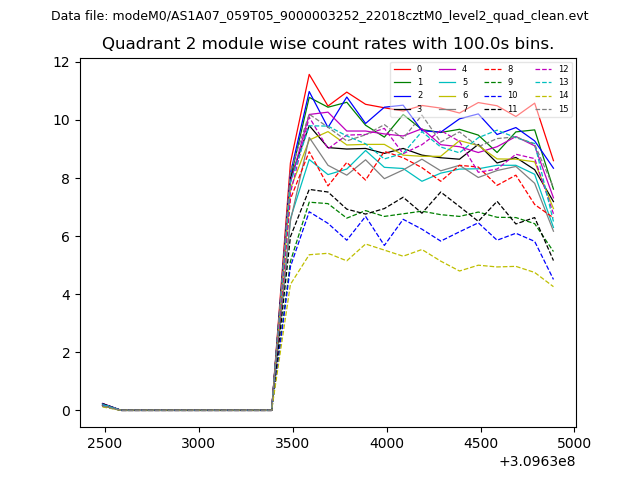 |
 |
| Module-wise count rates for Quadrant D Data is divided into 100 sec bins |
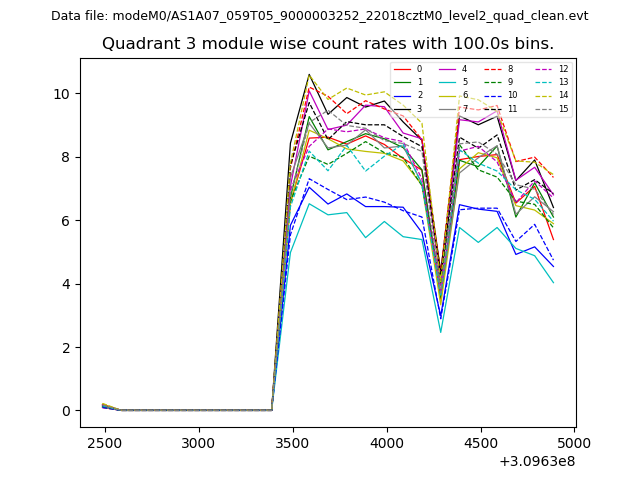 |
 |
| Parameter | Plot |
|---|---|
| CZT HV Monitor | 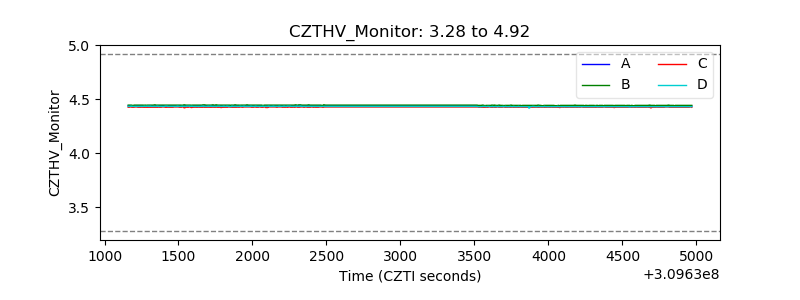 |
| D_VDD | 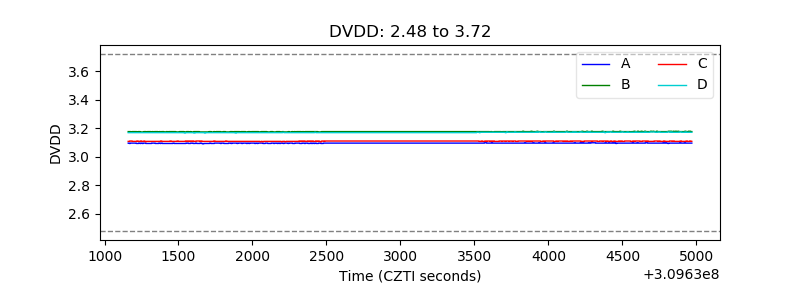 |
| Temperature 1 | 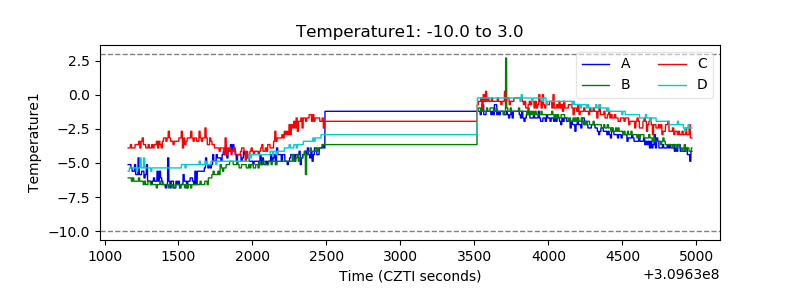 |
| Veto HV Monitor | 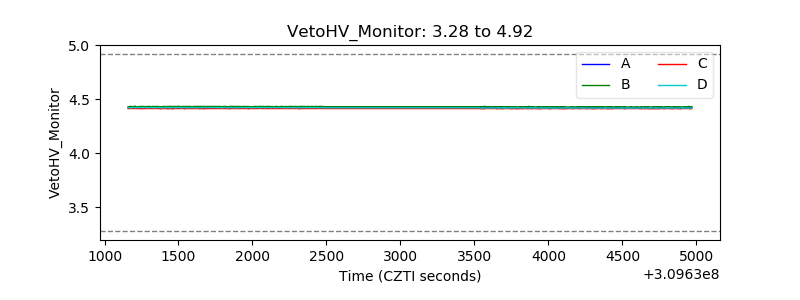 |
| Veto LLD | 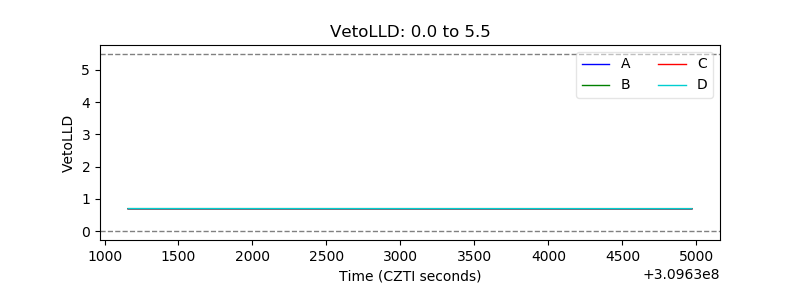 |
| Alpha Counter | 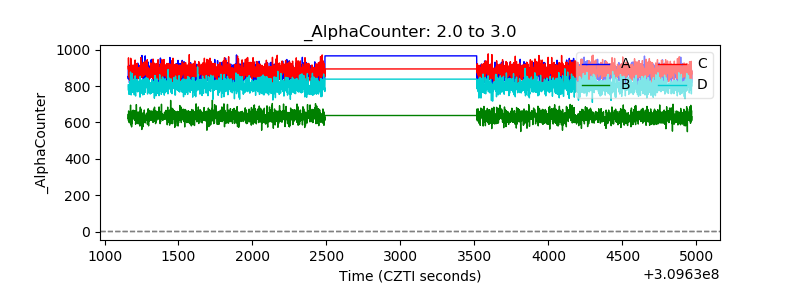 |
| _CPM_Rate | 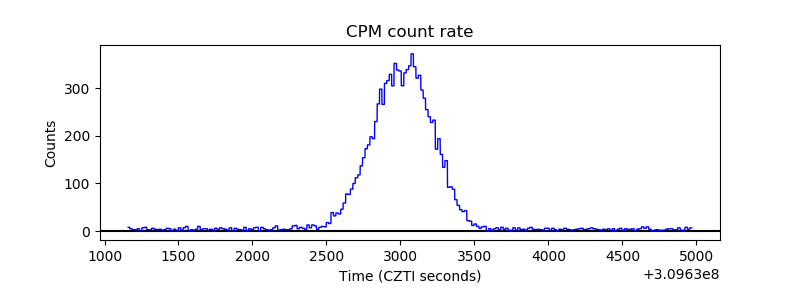 |
| CZT Counter | 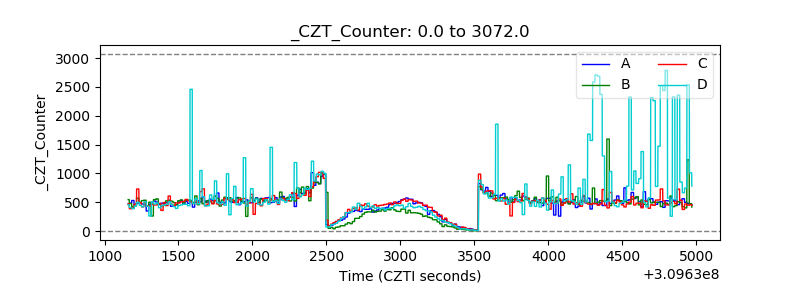 |
| +2.5 Volts monitor |  |
| +5 Volts monitor |  |
| _ROLL_ROT | 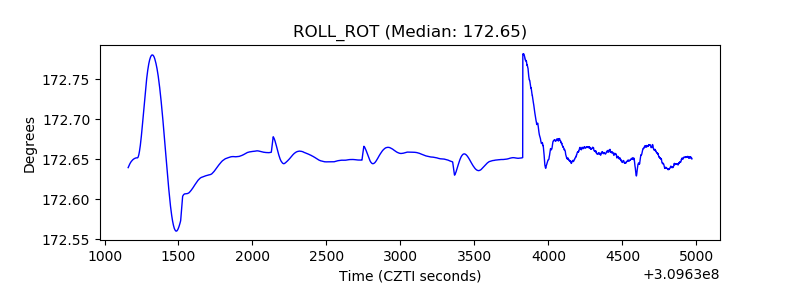 |
| _Roll_DEC | 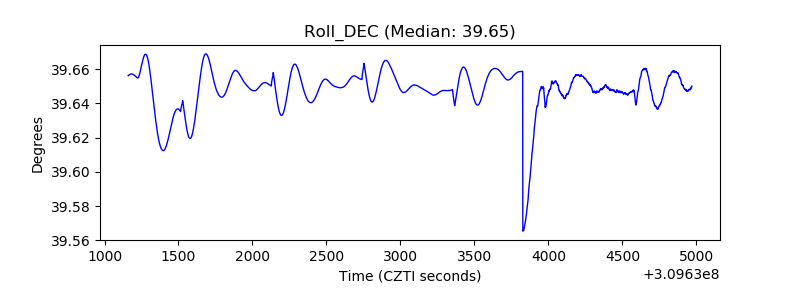 |
| _Roll_RA | 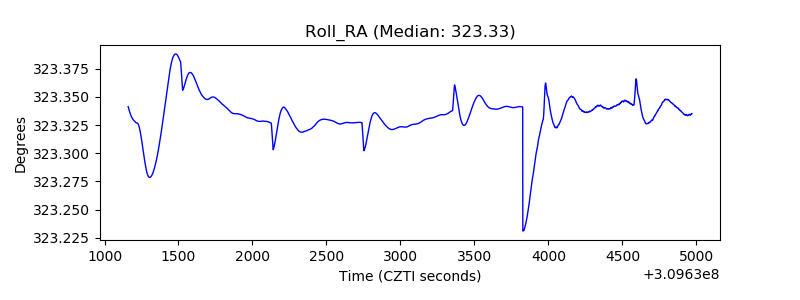 |
| Veto Counter | 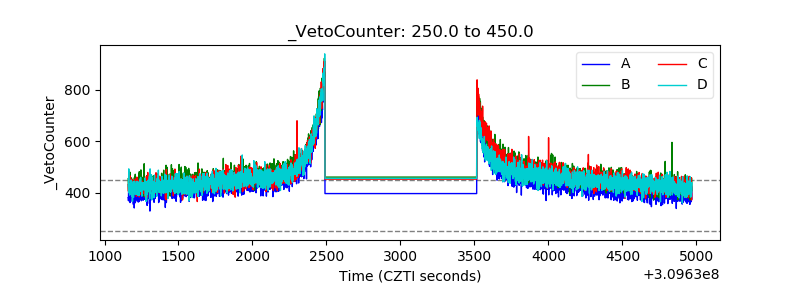 |