| Param | Original file | Final file |
|---|---|---|
| Filename | modeM0/AS1A07_059T05_9000003252_22019cztM0_level2.evt | modeM0/AS1A07_059T05_9000003252_22019cztM0_level2_quad_clean.evt |
| Size (bytes) | 533,747,520 | 100,512,000 |
| Size | 509.0 MB | 95.9 MB |
| Events in quadrant A | 3,449,777 | 656,606 |
| Events in quadrant B | 3,609,510 | 668,209 |
| Events in quadrant C | 3,486,401 | 634,141 |
| Events in quadrant D | 5,146,780 | 600,051 |
| Mode SS | |||
|---|---|---|---|
| Quadrant | BADHDUFLAG | Total packets | Discarded packets |
| A | 0 | 142 | 0 |
| B | 0 | 142 | 0 |
| C | 0 | 142 | 0 |
| D | 0 | 142 | 0 |
| Mode M0 | |||
|---|---|---|---|
| Quadrant | BADHDUFLAG | Total packets | Discarded packets |
| A | 0 | 14611 | 2 |
| B | 0 | 15119 | 2 |
| C | 0 | 14718 | 2 |
| D | 0 | 19947 | 2 |
| Mode M9 | |||
|---|---|---|---|
| Quadrant | BADHDUFLAG | Total packets | Discarded packets |
| A | 0 | 7 | 0 |
| B | 0 | 8 | 0 |
| C | 0 | 8 | 0 |
| D | 0 | 8 | 0 |
| Quadrant | Total seconds | Saturated seconds | Saturation percentage |
|---|---|---|---|
| A | 6958 | 70 | 1.006036% |
| B | 6958 | 101 | 1.451567% |
| C | 6958 | 142 | 2.040816% |
| D | 6958 | 309 | 4.440931% |
Noise dominated data is calculated using 1-second bins in cleaned event files. If a bin has >2000 counts, and if more than 50% of those come from <1% of pixels, then it is considered to be noise-dominated and hence unusable.
| Quadrant | # 1 sec bins | Bins with >0 counts | Bins with >2000 counts | High rate bins dominated by noise | Noise dominated (total time) | Noise dominated (detector-on time) | Marked lightcurve |
|---|---|---|---|---|---|---|---|
| A | 7593 | 6958 | 0 | 0 | 0.00% | 0.00% | 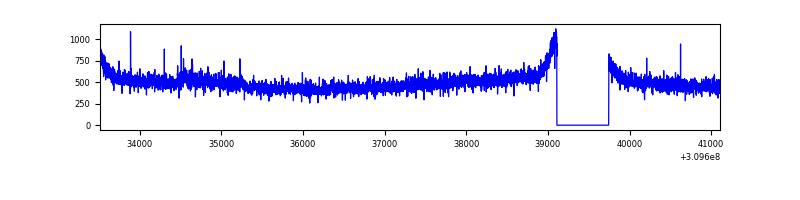 |
| B | 7593 | 6958 | 13 | 13 | 0.17% | 0.19% |  |
| C | 7593 | 6958 | 18 | 18 | 0.24% | 0.26% | 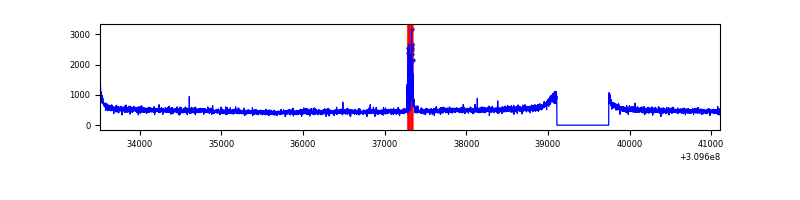 |
| D | 7593 | 6959 | 248 | 248 | 3.27% | 3.56% | 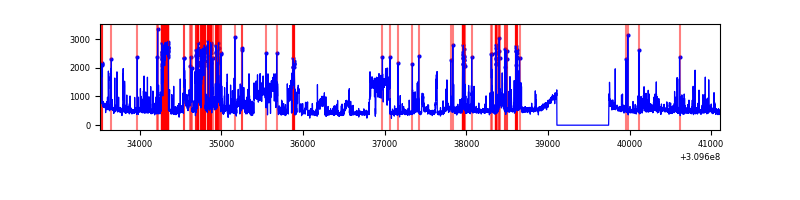 |
Top three noisy pixels from each quadrant. If the there are fewer than three noisy pixels in the level2.evt file, extra rows are filled as -1
| Pixel properties | Quadrant properties | ||||||
|---|---|---|---|---|---|---|---|
| Quadrant | DetID | PixID | Counts | Sigma | Mean | Median | Sigma |
| A | 3 | 1 | 74377 | 420.33 | 874 | 855 | 174.9 |
| A | 13 | 254 | 12716 | 67.81 | 874 | 855 | 174.9 |
| A | 0 | 226 | 7634 | 38.76 | 874 | 855 | 174.9 |
| B | 3 | 64 | 136562 | 822.77 | 869 | 849 | 164.9 |
| B | 0 | 230 | 27351 | 160.67 | 869 | 849 | 164.9 |
| B | 12 | 111 | 19220 | 111.38 | 869 | 849 | 164.9 |
| C | 14 | 238 | 131711 | 662.55 | 837 | 841 | 197.5 |
| C | 9 | 54 | 83712 | 419.55 | 837 | 841 | 197.5 |
| C | 0 | 10 | 9455 | 43.61 | 837 | 841 | 197.5 |
| D | 1 | 52 | 793633 | 3885.5 | 838 | 814 | 204.0 |
| D | 7 | 238 | 779046 | 3814.01 | 838 | 814 | 204.0 |
| D | 11 | 176 | 243770 | 1190.69 | 838 | 814 | 204.0 |
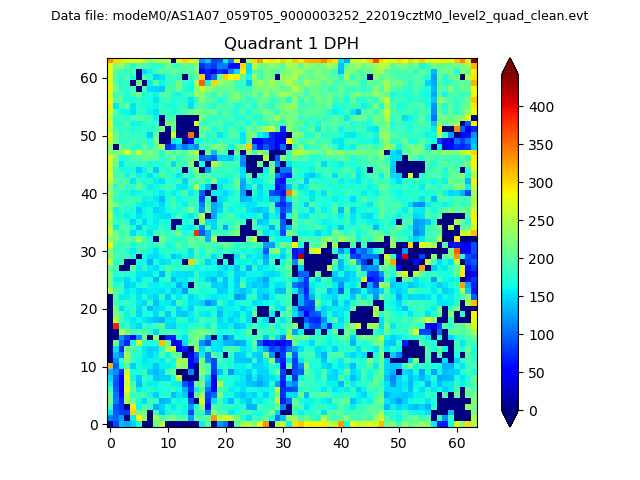
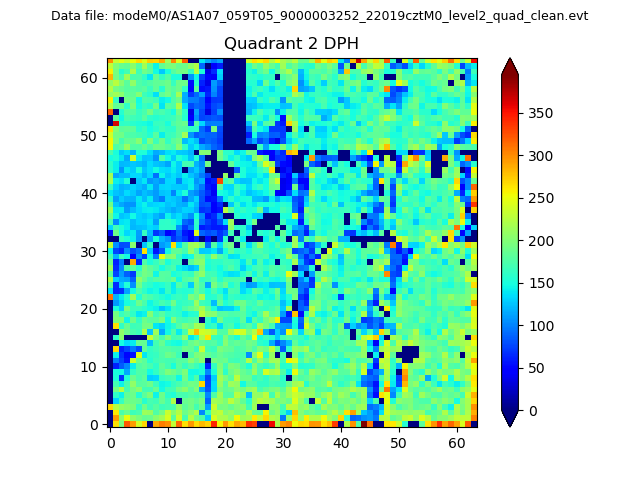
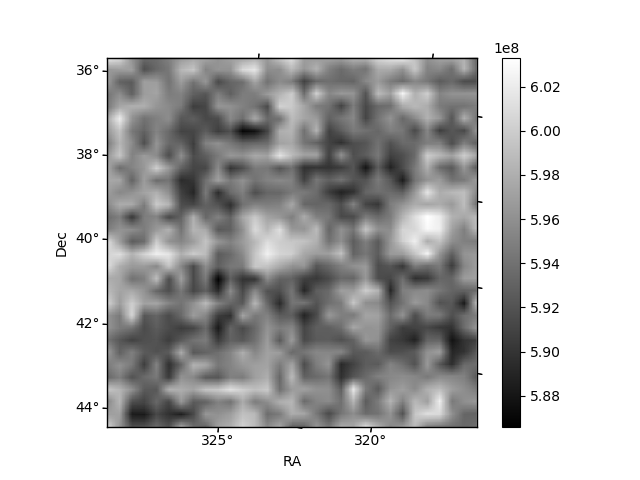
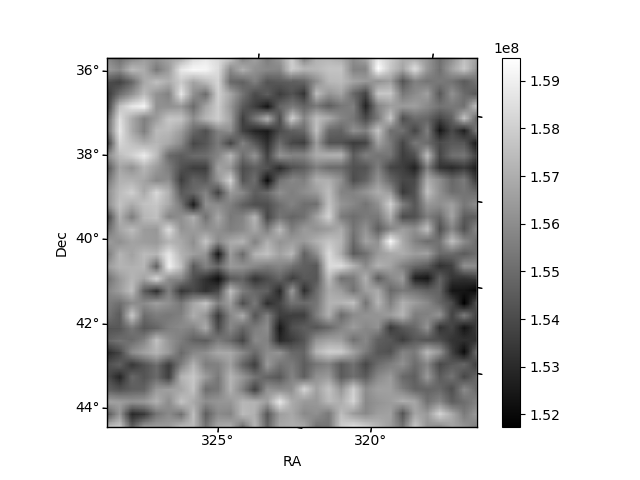
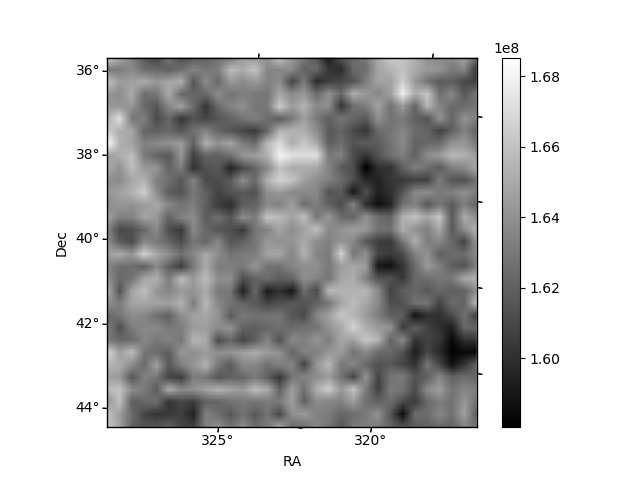
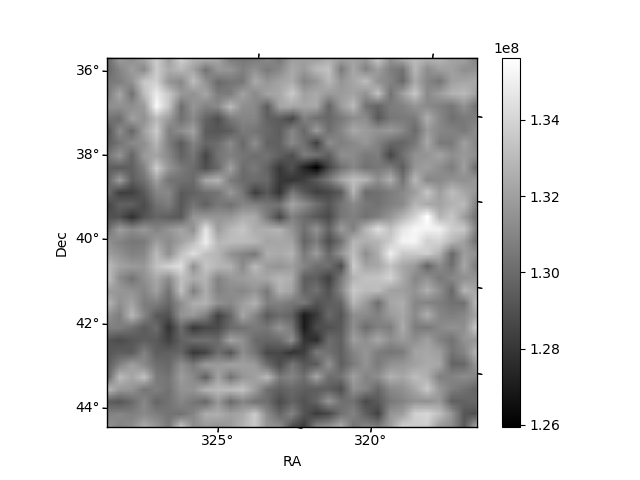
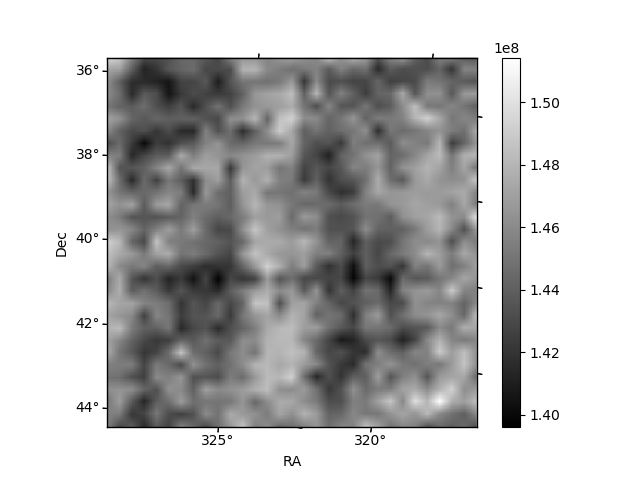
Histogram calculated using DETX and DETY for each event in the final _common_clean file
| Quadrant A | 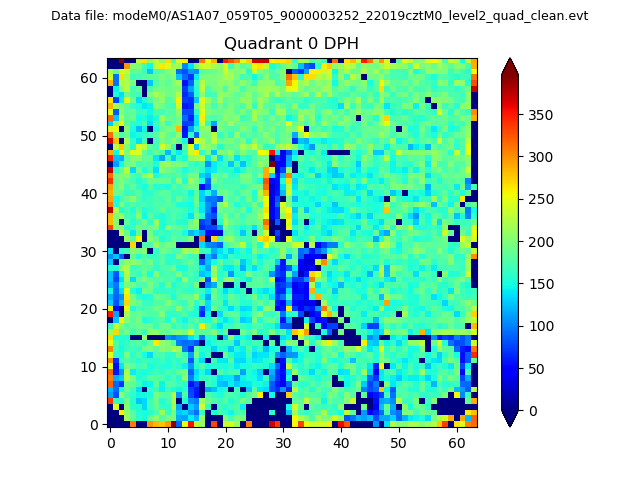 |
 |
Quadrant B |
|---|---|---|---|
| Quadrant D | 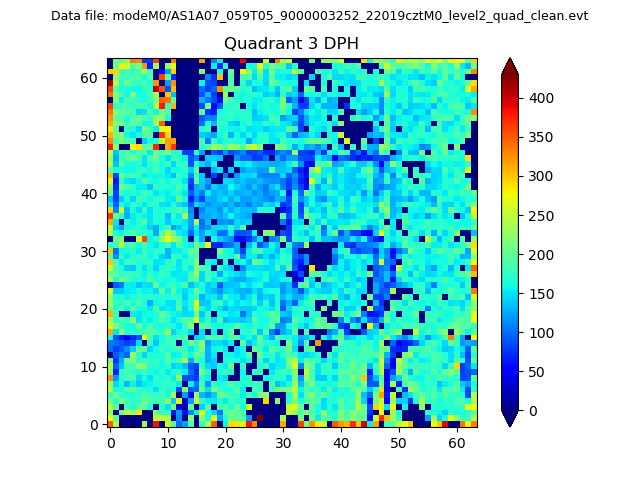 |
 |
Quadrant C |
| Plot type | Count rate plots | Images |
|---|---|---|
| Comparison with Poisson distribution Blue bars denote a histogram of data divided into 1 sec bins. Red curve is a Poisson curve with rate = median count rate of data. |
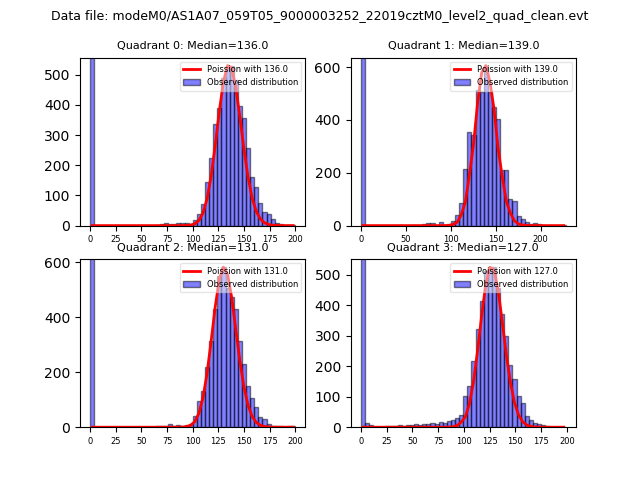 |
 |
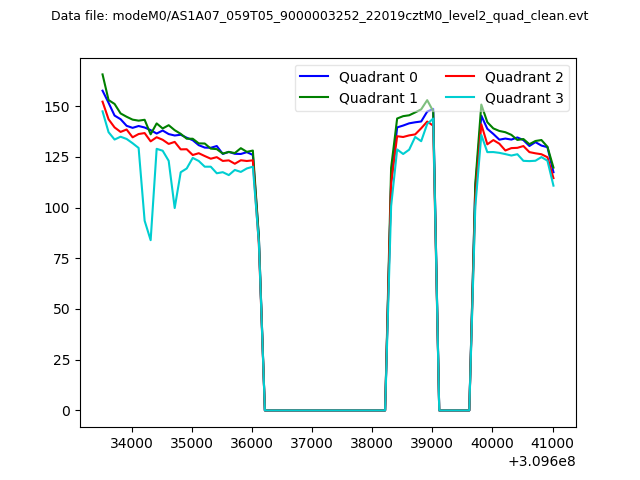
| Quadrant-wise count rates Data is divided into 100 sec bins |
 |
|
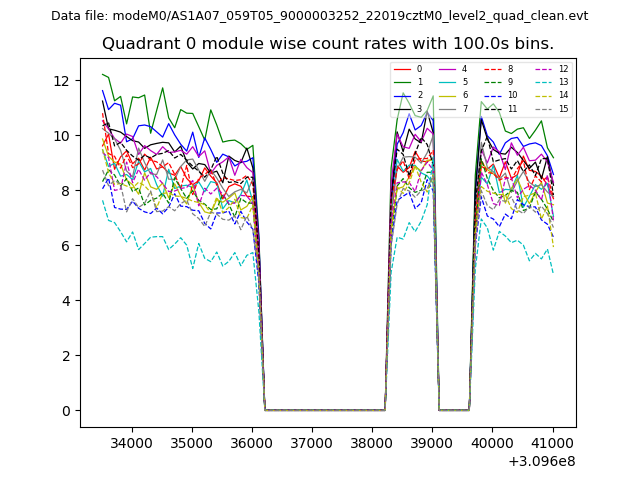
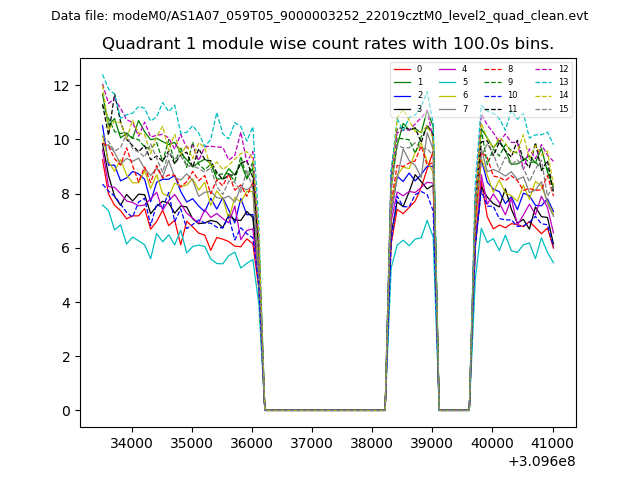
| Module-wise count rates for Quadrant A Data is divided into 100 sec bins |
 |
 |
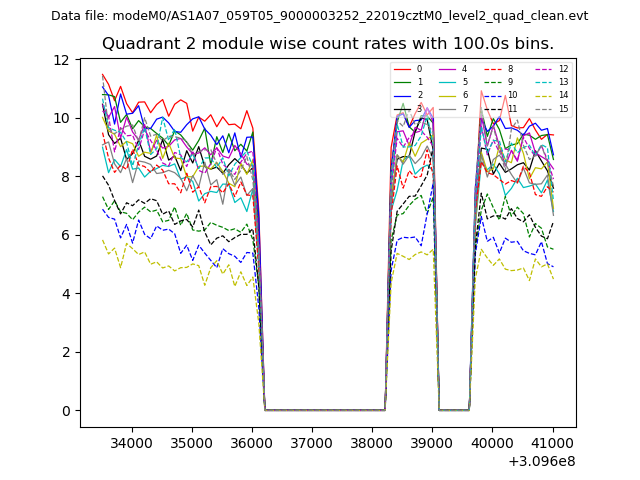
| Module-wise count rates for Quadrant B Data is divided into 100 sec bins |
 |
 |
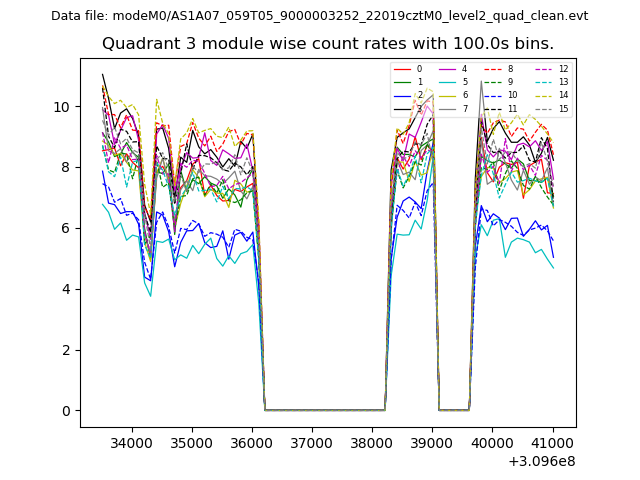
| Module-wise count rates for Quadrant C Data is divided into 100 sec bins |
 |
 |
| Module-wise count rates for Quadrant D Data is divided into 100 sec bins |
 |
 |
| Parameter | Plot |
|---|---|
| CZT HV Monitor | 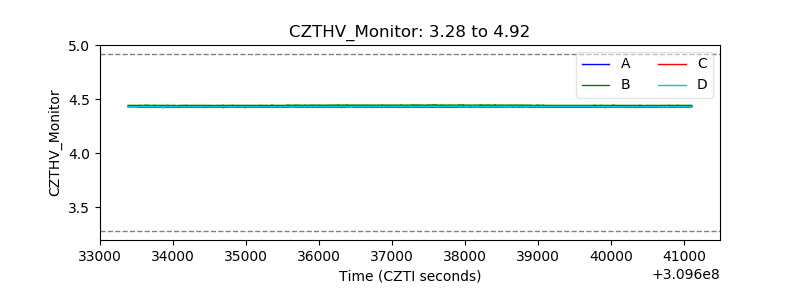 |
| D_VDD | 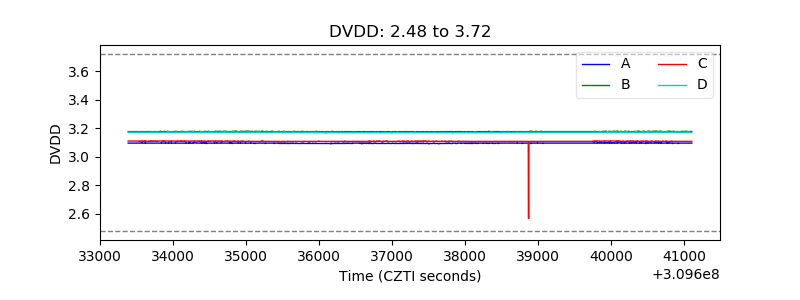 |
| Temperature 1 | 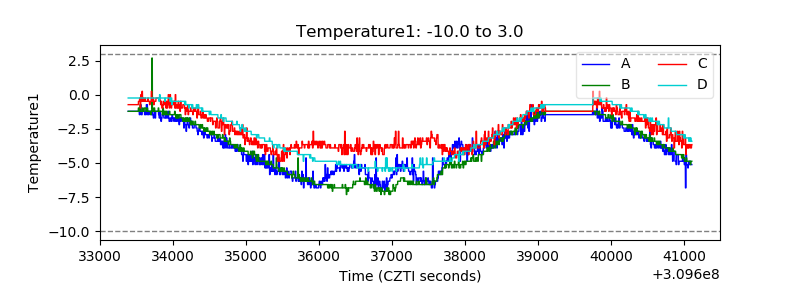 |
| Veto HV Monitor | 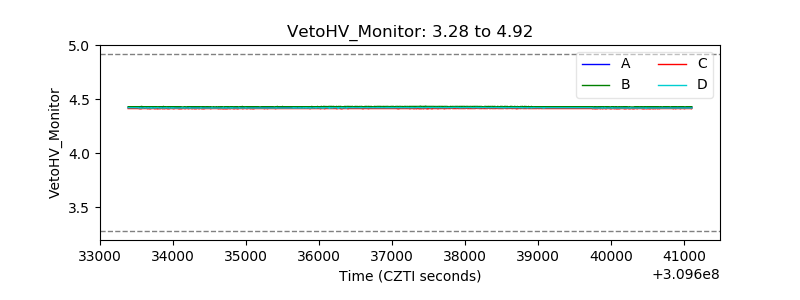 |
| Veto LLD | 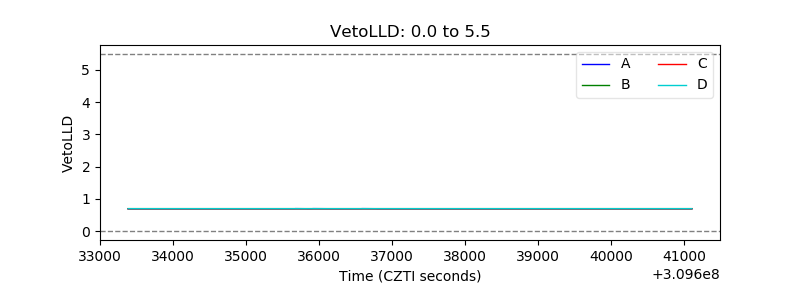 |
| Alpha Counter | 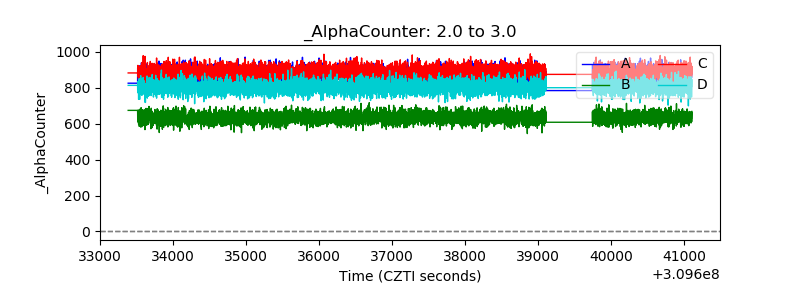 |
| _CPM_Rate | 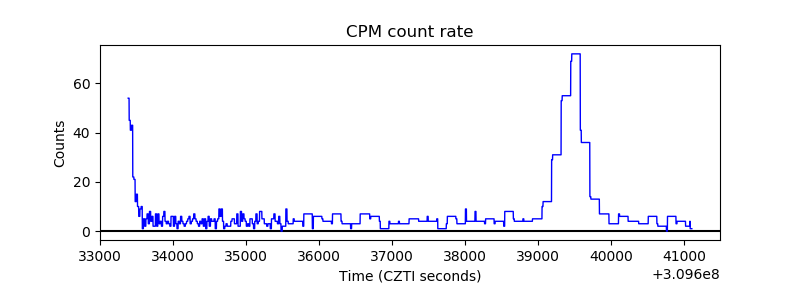 |
| CZT Counter | 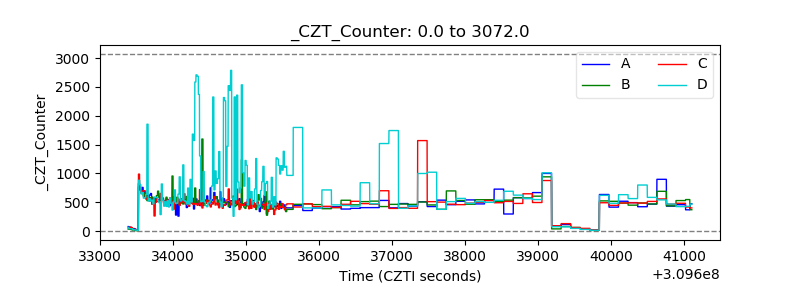 |
| +2.5 Volts monitor |  |
| +5 Volts monitor |  |
| _ROLL_ROT | 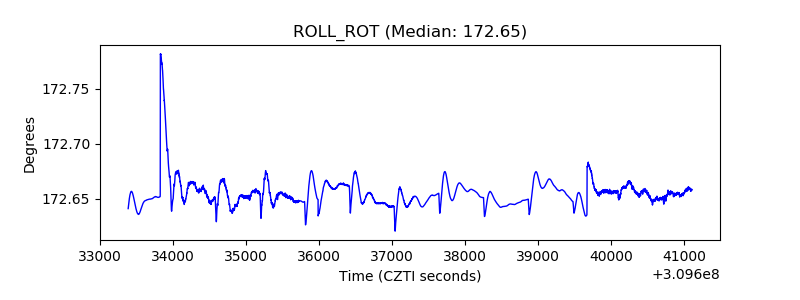 |
| _Roll_DEC | 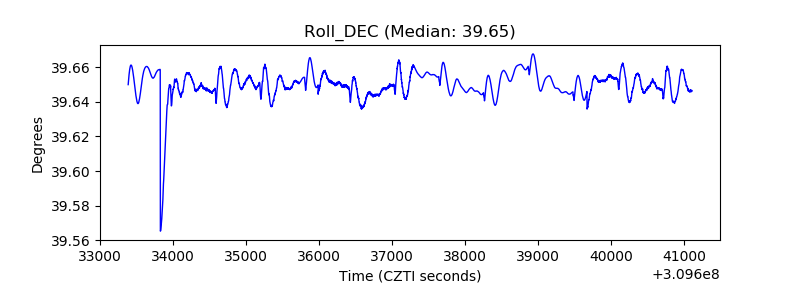 |
| _Roll_RA | 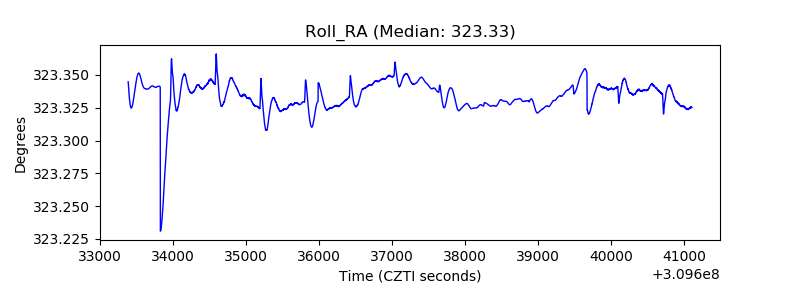 |
| Veto Counter | 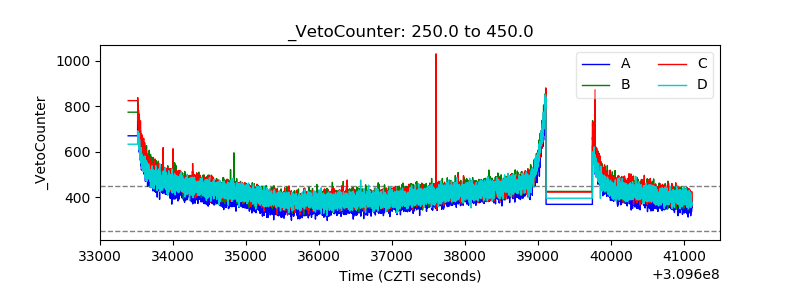 |