| Param | Original file | Final file |
|---|---|---|
| Filename | modeM0/AS1A07_059T05_9000003252_22020cztM0_level2.evt | modeM0/AS1A07_059T05_9000003252_22020cztM0_level2_quad_clean.evt |
| Size (bytes) | 589,616,640 | 107,913,600 |
| Size | 562.3 MB | 102.9 MB |
| Events in quadrant A | 3,585,624 | 714,904 |
| Events in quadrant B | 3,750,843 | 726,166 |
| Events in quadrant C | 3,625,274 | 691,746 |
| Events in quadrant D | 6,384,934 | 612,107 |
| Mode SS | |||
|---|---|---|---|
| Quadrant | BADHDUFLAG | Total packets | Discarded packets |
| A | 0 | 152 | 0 |
| B | 0 | 152 | 0 |
| C | 0 | 152 | 0 |
| D | 0 | 152 | 0 |
| Mode M0 | |||
|---|---|---|---|
| Quadrant | BADHDUFLAG | Total packets | Discarded packets |
| A | 0 | 15595 | 2 |
| B | 0 | 15938 | 2 |
| C | 0 | 15585 | 2 |
| D | 0 | 24209 | 2 |
| Mode M9 | |||
|---|---|---|---|
| Quadrant | BADHDUFLAG | Total packets | Discarded packets |
| A | 0 | 6 | 0 |
| B | 0 | 7 | 0 |
| C | 0 | 7 | 0 |
| D | 0 | 7 | 0 |
| Quadrant | Total seconds | Saturated seconds | Saturation percentage |
|---|---|---|---|
| A | 7516 | 50 | 0.665247% |
| B | 7516 | 90 | 1.197445% |
| C | 7516 | 109 | 1.450239% |
| D | 7516 | 1043 | 13.877062% |
Noise dominated data is calculated using 1-second bins in cleaned event files. If a bin has >2000 counts, and if more than 50% of those come from <1% of pixels, then it is considered to be noise-dominated and hence unusable.
| Quadrant | # 1 sec bins | Bins with >0 counts | Bins with >2000 counts | High rate bins dominated by noise | Noise dominated (total time) | Noise dominated (detector-on time) | Marked lightcurve |
|---|---|---|---|---|---|---|---|
| A | 7756 | 7517 | 0 | 0 | 0.00% | 0.00% | 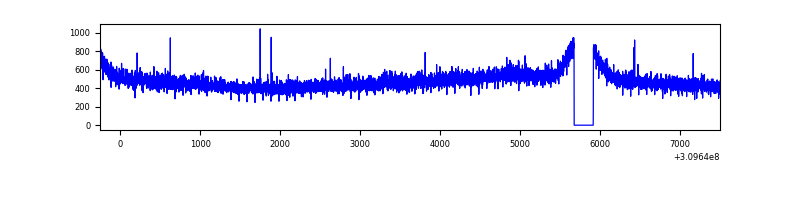 |
| B | 7756 | 7516 | 7 | 7 | 0.09% | 0.09% | 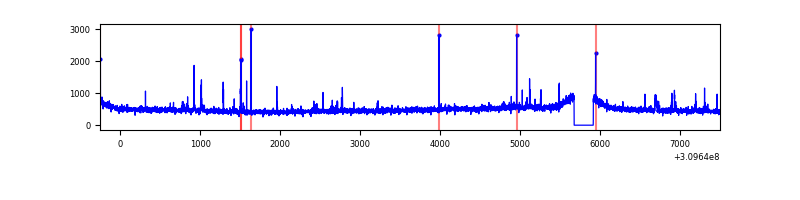 |
| C | 7756 | 7517 | 0 | 0 | 0.00% | 0.00% | 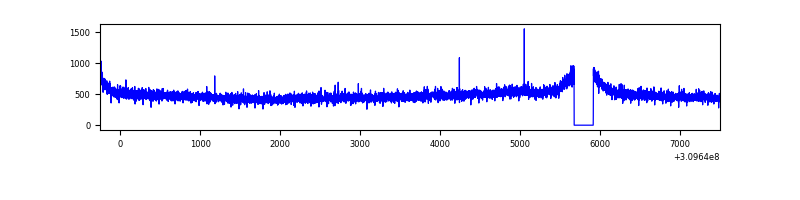 |
| D | 7755 | 7516 | 893 | 893 | 11.52% | 11.88% | 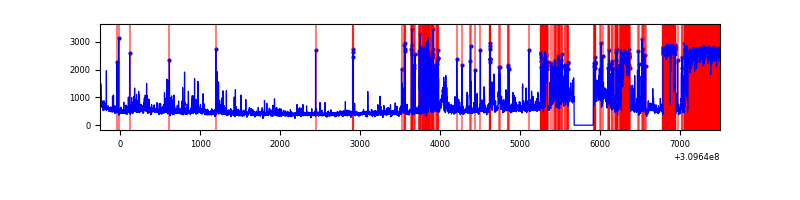 |
Top three noisy pixels from each quadrant. If the there are fewer than three noisy pixels in the level2.evt file, extra rows are filled as -1
| Pixel properties | Quadrant properties | ||||||
|---|---|---|---|---|---|---|---|
| Quadrant | DetID | PixID | Counts | Sigma | Mean | Median | Sigma |
| A | 13 | 254 | 13132 | 65.62 | 926 | 906 | 186.3 |
| A | 0 | 226 | 8012 | 38.14 | 926 | 906 | 186.3 |
| A | 3 | 137 | 7708 | 36.51 | 926 | 906 | 186.3 |
| B | 3 | 64 | 55051 | 305.9 | 924 | 898 | 177.0 |
| B | 0 | 190 | 31544 | 173.11 | 924 | 898 | 177.0 |
| B | 12 | 111 | 20656 | 111.61 | 924 | 898 | 177.0 |
| C | 14 | 238 | 137882 | 650.91 | 892 | 896 | 210.5 |
| C | 13 | 61 | 6351 | 25.92 | 892 | 896 | 210.5 |
| C | 0 | 10 | 5250 | 20.69 | 892 | 896 | 210.5 |
| D | 1 | 52 | 1686599 | 8145.78 | 847 | 820 | 207.0 |
| D | 5 | 222 | 962826 | 4648.47 | 847 | 820 | 207.0 |
| D | 11 | 176 | 308175 | 1485.16 | 847 | 820 | 207.0 |
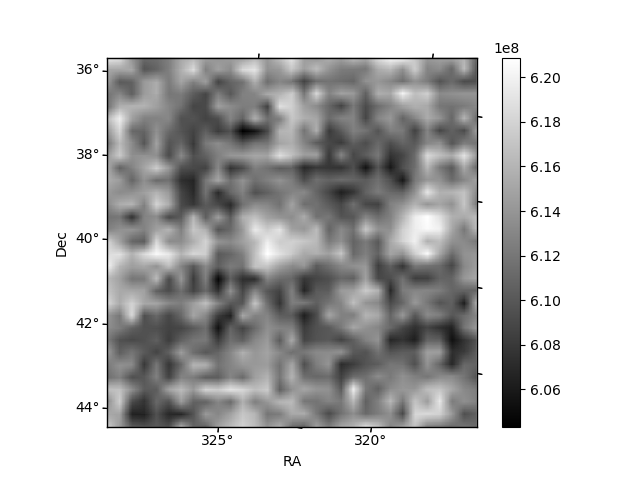
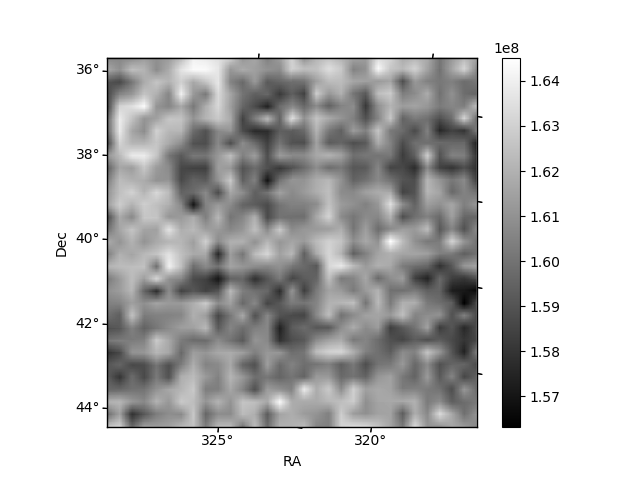
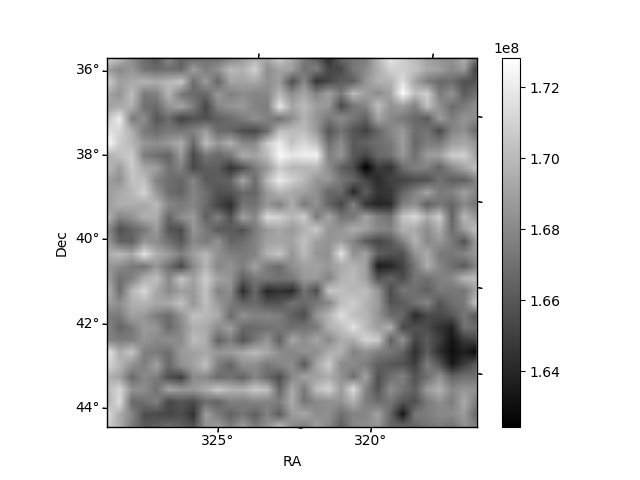
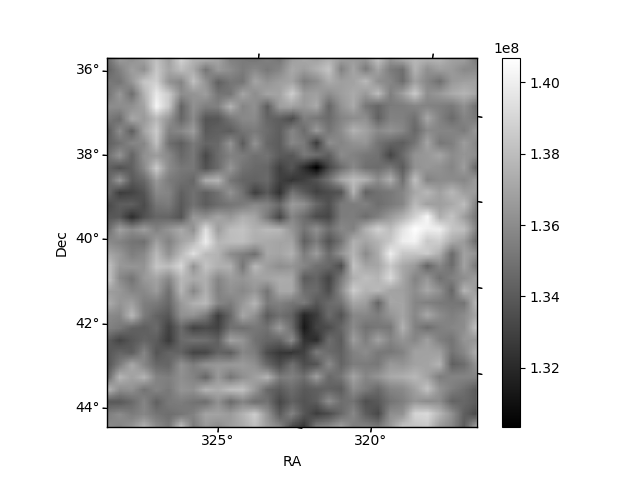
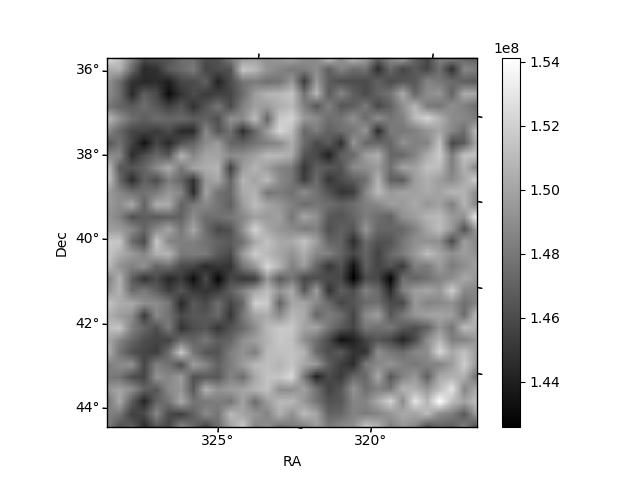
Histogram calculated using DETX and DETY for each event in the final _common_clean file
| Quadrant A | 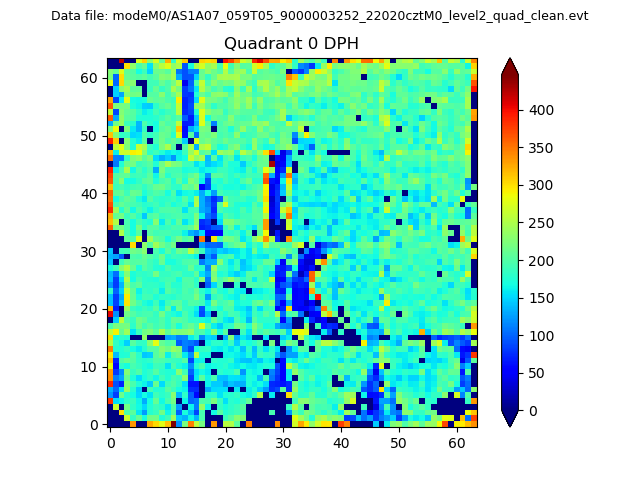 |
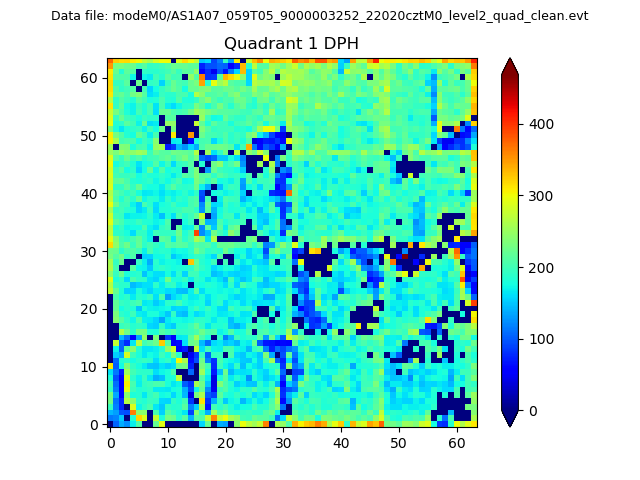 |
Quadrant B |
|---|---|---|---|
| Quadrant D | 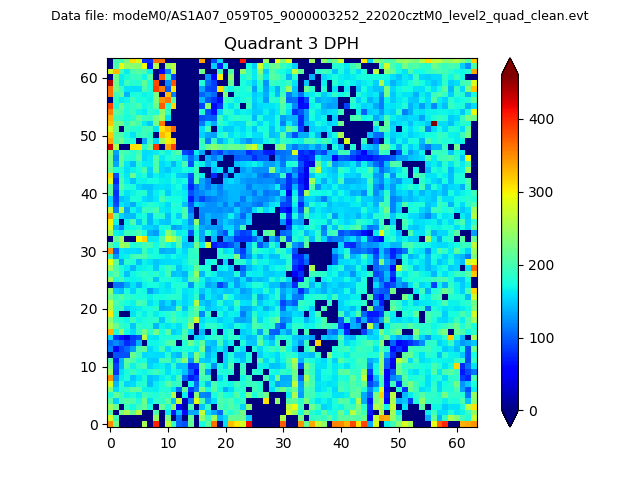 |
 |
Quadrant C |
| Plot type | Count rate plots | Images |
|---|---|---|
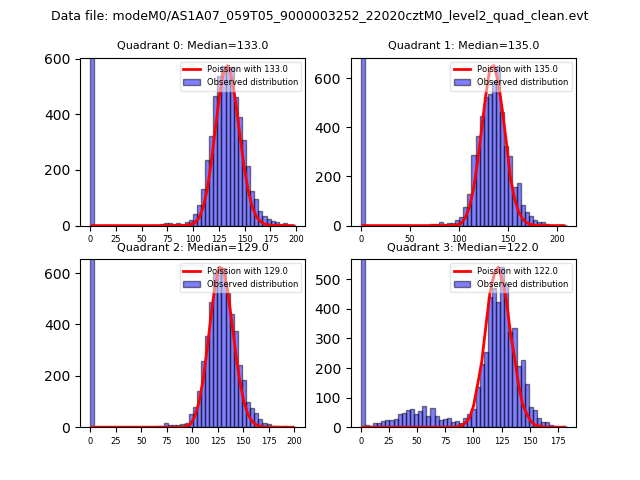
| Comparison with Poisson distribution Blue bars denote a histogram of data divided into 1 sec bins. Red curve is a Poisson curve with rate = median count rate of data. |
 |
 |
| Quadrant-wise count rates Data is divided into 100 sec bins |
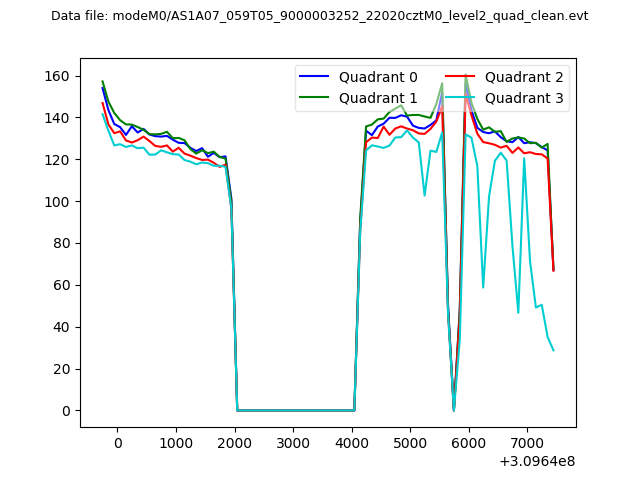 |
|
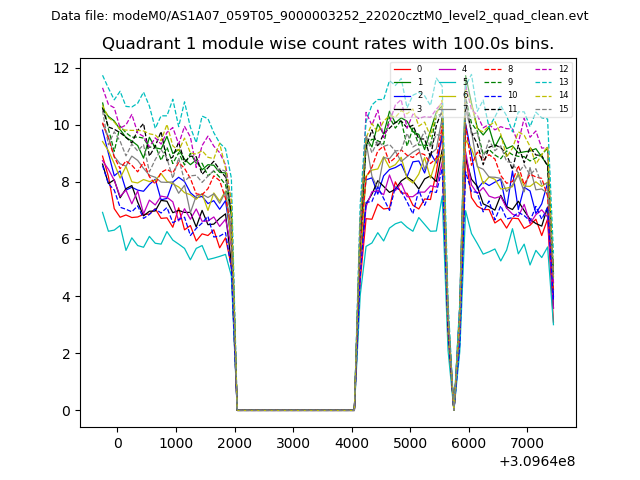
| Module-wise count rates for Quadrant A Data is divided into 100 sec bins |
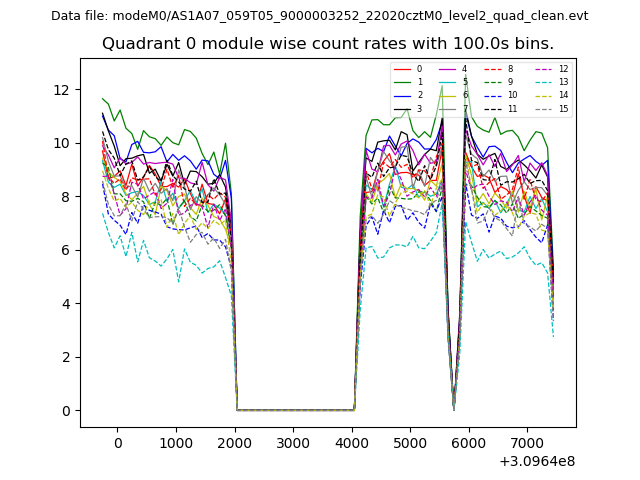 |
 |
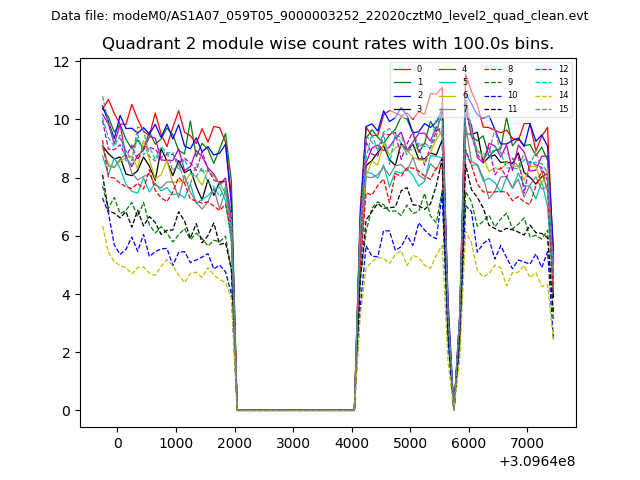
| Module-wise count rates for Quadrant B Data is divided into 100 sec bins |
 |
 |
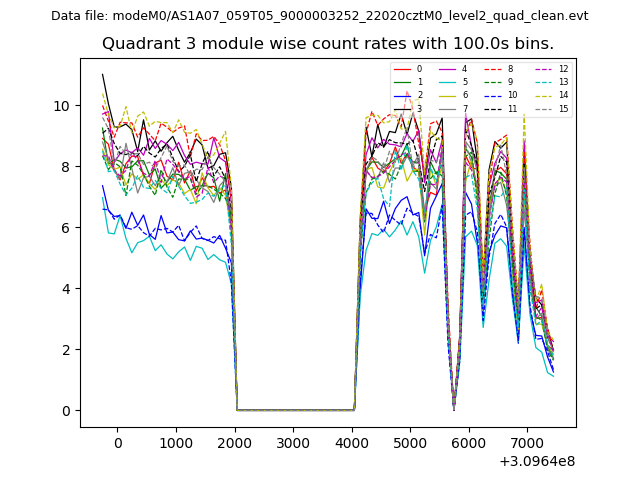
| Module-wise count rates for Quadrant C Data is divided into 100 sec bins |
 |
 |
| Module-wise count rates for Quadrant D Data is divided into 100 sec bins |
 |
 |
| Parameter | Plot |
|---|---|
| CZT HV Monitor | 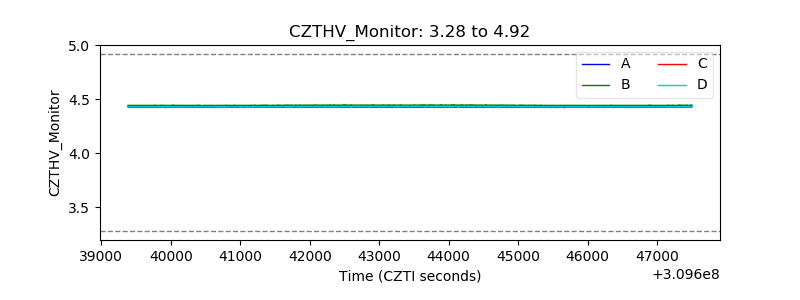 |
| D_VDD | 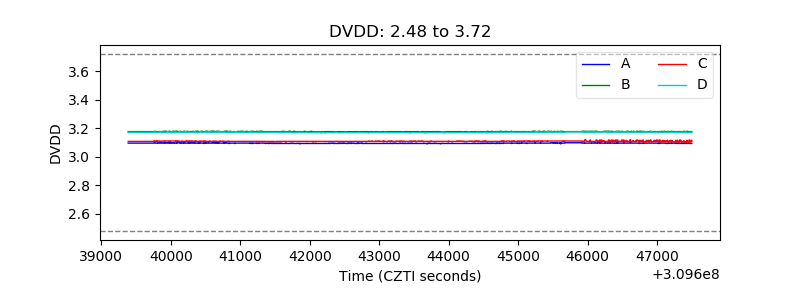 |
| Temperature 1 | 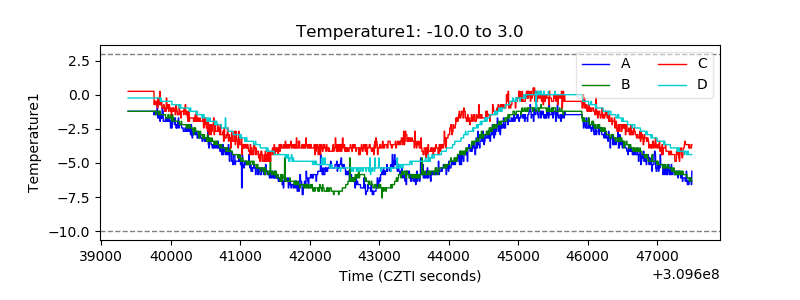 |
| Veto HV Monitor | 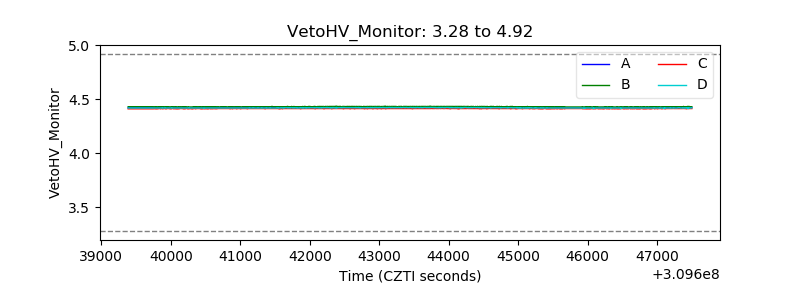 |
| Veto LLD | 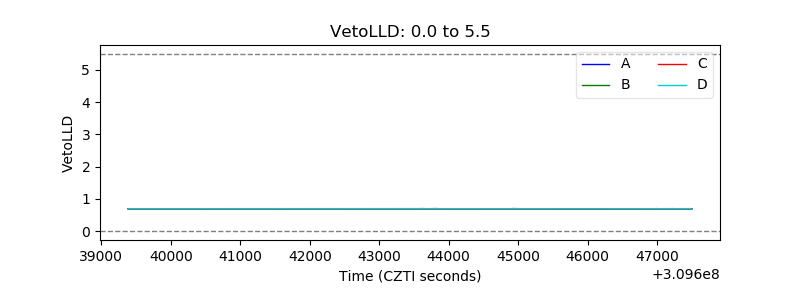 |
| Alpha Counter | 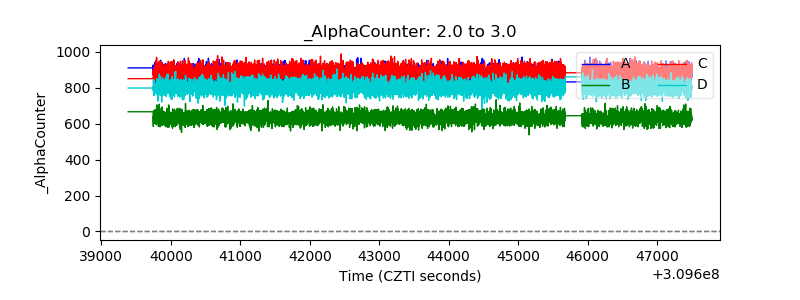 |
| _CPM_Rate | 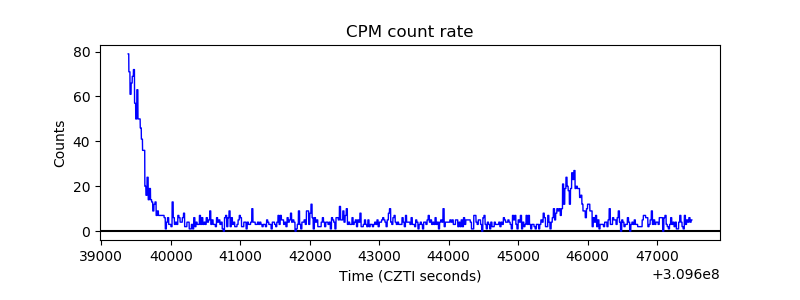 |
| CZT Counter | 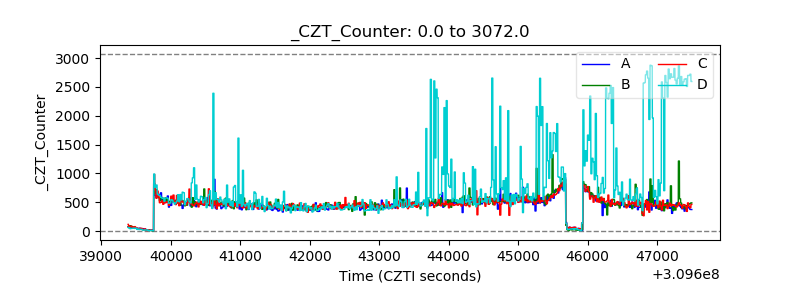 |
| +2.5 Volts monitor |  |
| +5 Volts monitor |  |
| _ROLL_ROT | 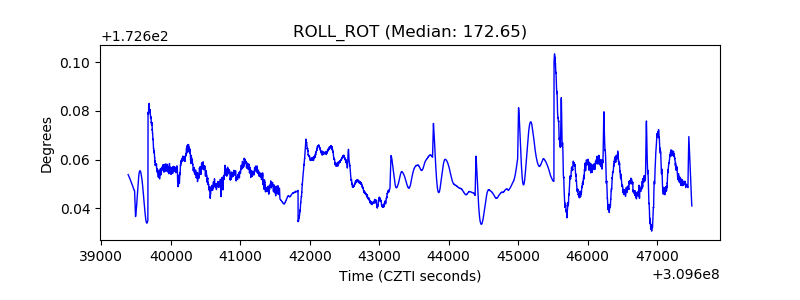 |
| _Roll_DEC | 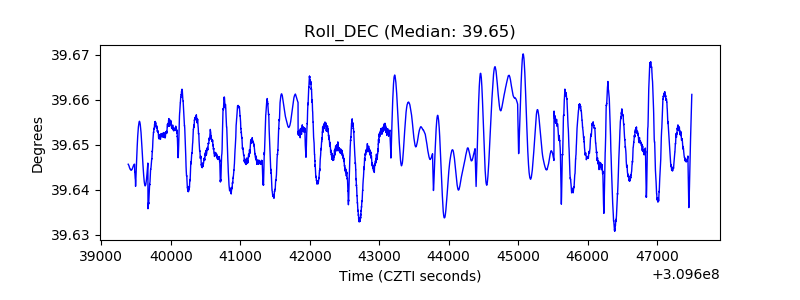 |
| _Roll_RA | 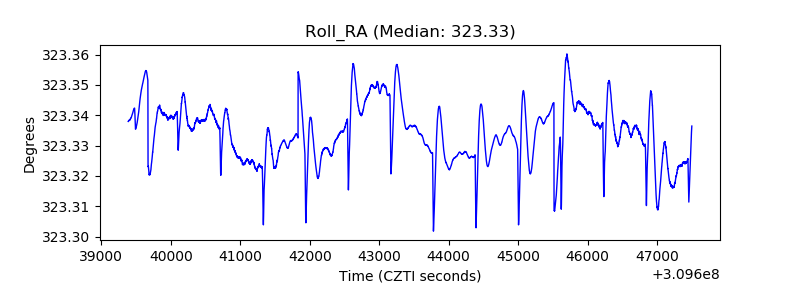 |
| Veto Counter | 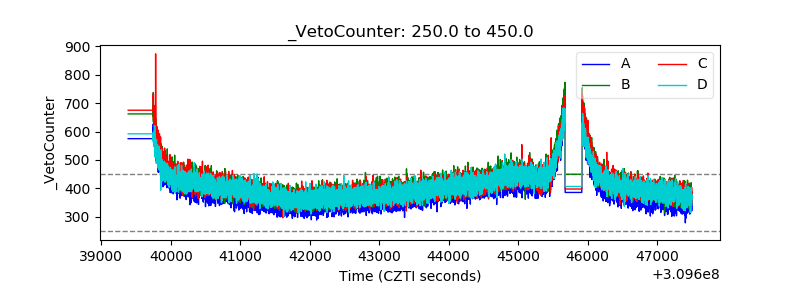 |