| Param | Original file | Final file |
|---|---|---|
| Filename | modeM0/AS1A07_059T05_9000003252_22021cztM0_level2.evt | modeM0/AS1A07_059T05_9000003252_22021cztM0_level2_quad_clean.evt |
| Size (bytes) | 756,434,880 | 109,054,080 |
| Size | 721.4 MB | 104.0 MB |
| Events in quadrant A | 3,712,703 | 730,927 |
| Events in quadrant B | 3,969,983 | 738,638 |
| Events in quadrant C | 3,791,795 | 705,134 |
| Events in quadrant D | 10,905,743 | 584,191 |
| Mode SS | |||
|---|---|---|---|
| Quadrant | BADHDUFLAG | Total packets | Discarded packets |
| A | 0 | 160 | 0 |
| B | 0 | 160 | 0 |
| C | 0 | 160 | 0 |
| D | 0 | 160 | 0 |
| Mode M0 | |||
|---|---|---|---|
| Quadrant | BADHDUFLAG | Total packets | Discarded packets |
| A | 0 | 16233 | 3 |
| B | 0 | 16881 | 3 |
| C | 0 | 16284 | 3 |
| D | 0 | 37664 | 3 |
| Mode M9 | |||
|---|---|---|---|
| Quadrant | BADHDUFLAG | Total packets | Discarded packets |
| A | 0 | 5 | 0 |
| B | 0 | 5 | 0 |
| C | 0 | 5 | 0 |
| D | 0 | 5 | 0 |
| Quadrant | Total seconds | Saturated seconds | Saturation percentage |
|---|---|---|---|
| A | 7811 | 97 | 1.241838% |
| B | 7811 | 178 | 2.278838% |
| C | 7811 | 171 | 2.189220% |
| D | 7811 | 2396 | 30.674690% |
Noise dominated data is calculated using 1-second bins in cleaned event files. If a bin has >2000 counts, and if more than 50% of those come from <1% of pixels, then it is considered to be noise-dominated and hence unusable.
| Quadrant | # 1 sec bins | Bins with >0 counts | Bins with >2000 counts | High rate bins dominated by noise | Noise dominated (total time) | Noise dominated (detector-on time) | Marked lightcurve |
|---|---|---|---|---|---|---|---|
| A | 8286 | 7814 | 0 | 0 | 0.00% | 0.00% |  |
| B | 8286 | 7812 | 21 | 21 | 0.25% | 0.27% |  |
| C | 8286 | 7813 | 0 | 0 | 0.00% | 0.00% | 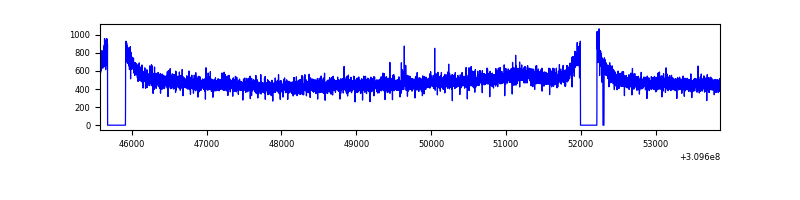 |
| D | 8286 | 7814 | 2360 | 2360 | 28.48% | 30.20% | 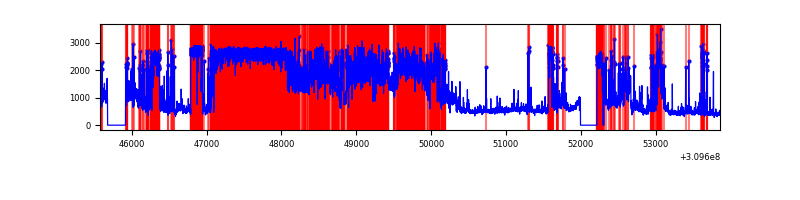 |
Top three noisy pixels from each quadrant. If the there are fewer than three noisy pixels in the level2.evt file, extra rows are filled as -1
| Pixel properties | Quadrant properties | ||||||
|---|---|---|---|---|---|---|---|
| Quadrant | DetID | PixID | Counts | Sigma | Mean | Median | Sigma |
| A | 13 | 254 | 14538 | 70.39 | 959 | 939 | 193.2 |
| A | 0 | 226 | 8215 | 37.66 | 959 | 939 | 193.2 |
| A | 3 | 137 | 8205 | 37.61 | 959 | 939 | 193.2 |
| B | 3 | 64 | 98844 | 533.84 | 959 | 934 | 183.4 |
| B | 0 | 190 | 50916 | 272.52 | 959 | 934 | 183.4 |
| B | 12 | 111 | 21786 | 113.69 | 959 | 934 | 183.4 |
| C | 14 | 238 | 142694 | 649.22 | 926 | 932 | 218.4 |
| C | 8 | 128 | 15380 | 66.17 | 926 | 932 | 218.4 |
| C | 8 | 112 | 7965 | 32.21 | 926 | 932 | 218.4 |
| D | 5 | 222 | 5432921 | 26893.87 | 824 | 797 | 202.0 |
| D | 1 | 52 | 1094964 | 5417.11 | 824 | 797 | 202.0 |
| D | 7 | 38 | 768409 | 3800.37 | 824 | 797 | 202.0 |
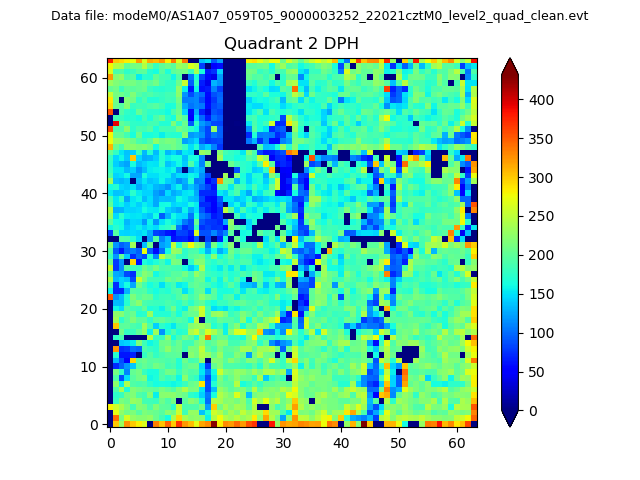
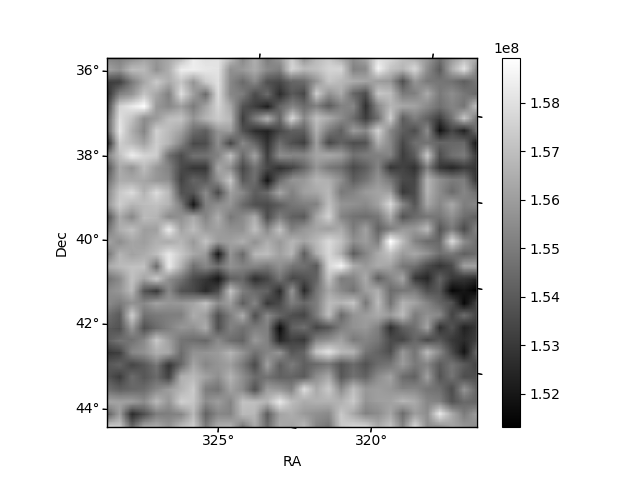
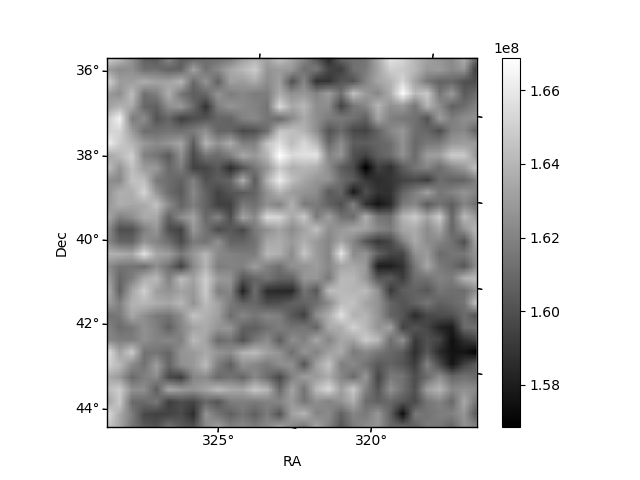
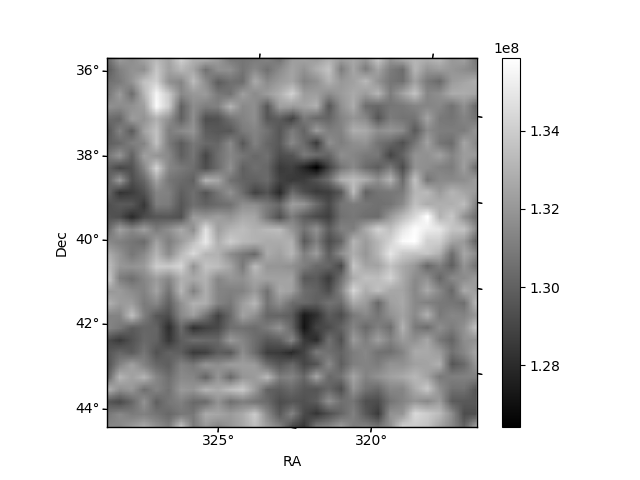
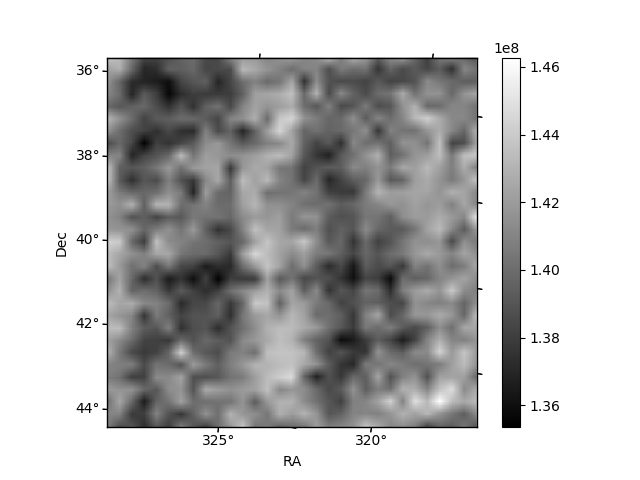
Histogram calculated using DETX and DETY for each event in the final _common_clean file
| Quadrant A | 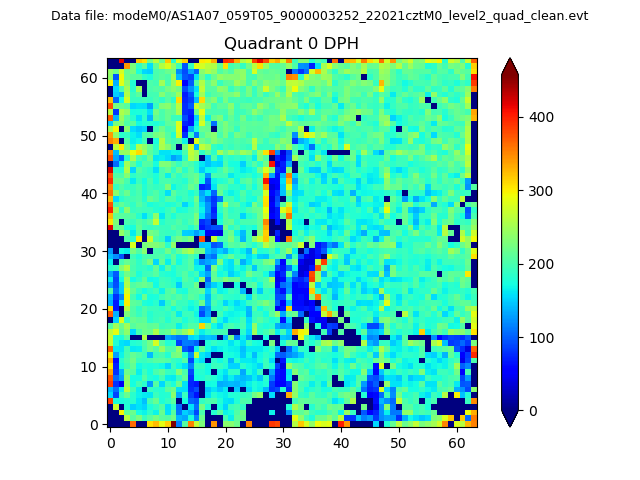 |
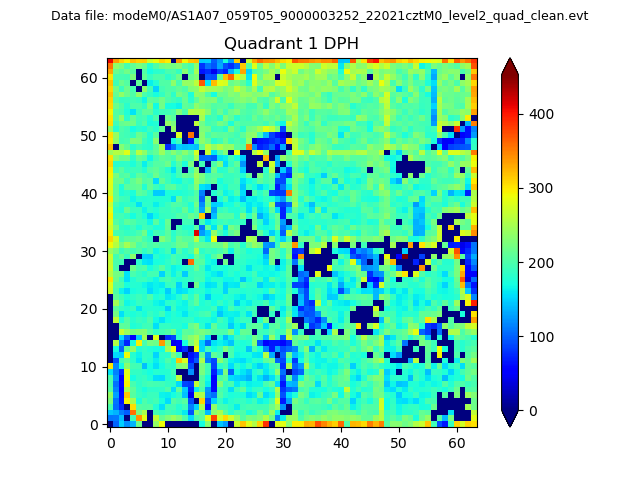 |
Quadrant B |
|---|---|---|---|
| Quadrant D | 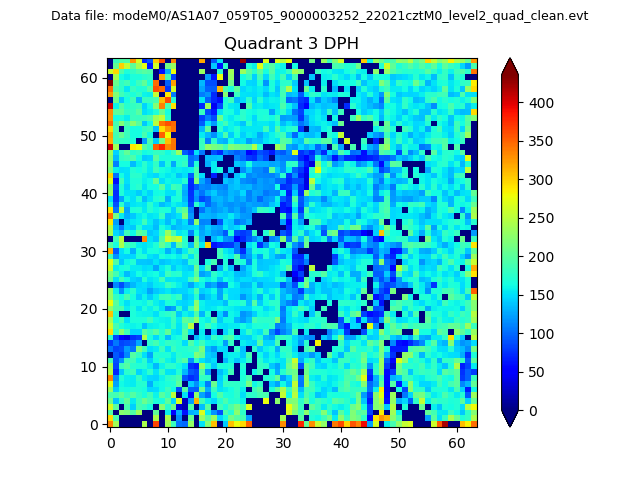 |
 |
Quadrant C |
| Plot type | Count rate plots | Images |
|---|---|---|
| Comparison with Poisson distribution Blue bars denote a histogram of data divided into 1 sec bins. Red curve is a Poisson curve with rate = median count rate of data. |
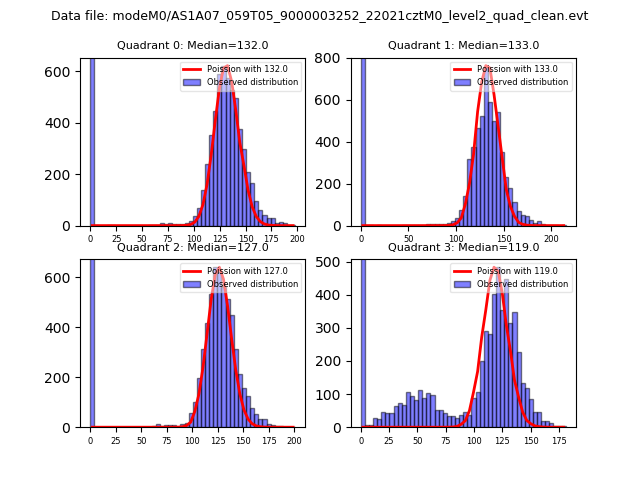 |
 |
| Quadrant-wise count rates Data is divided into 100 sec bins |
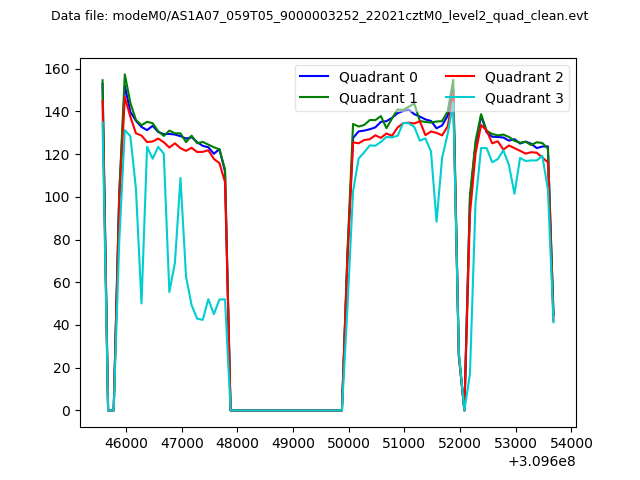 |
|
| Module-wise count rates for Quadrant A Data is divided into 100 sec bins |
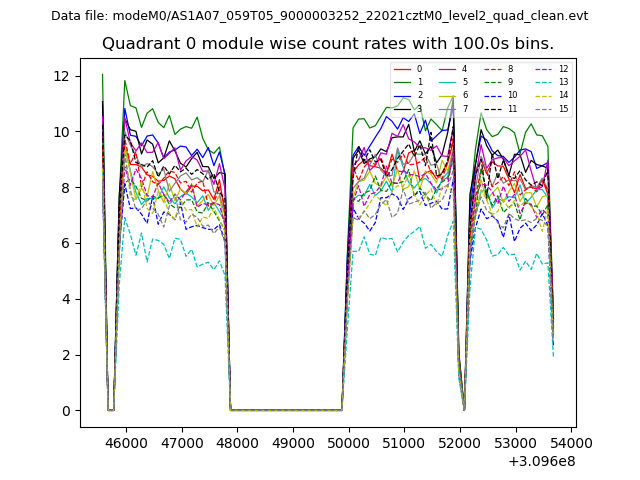 |
 |
| Module-wise count rates for Quadrant B Data is divided into 100 sec bins |
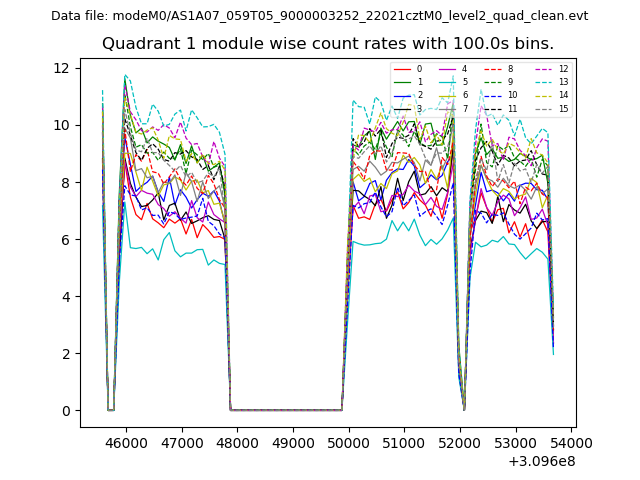 |
 |
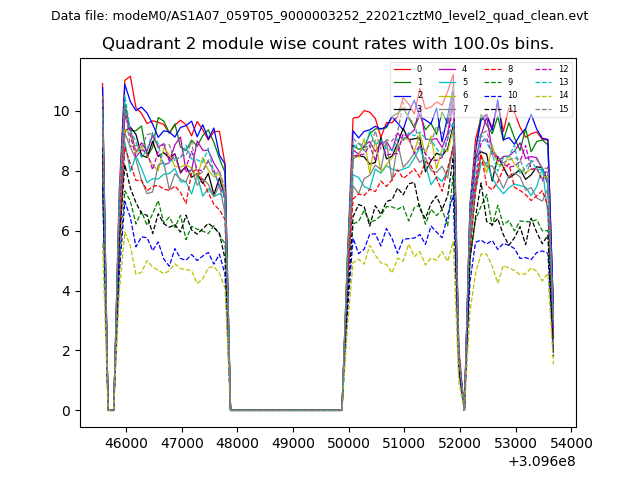
| Module-wise count rates for Quadrant C Data is divided into 100 sec bins |
 |
 |
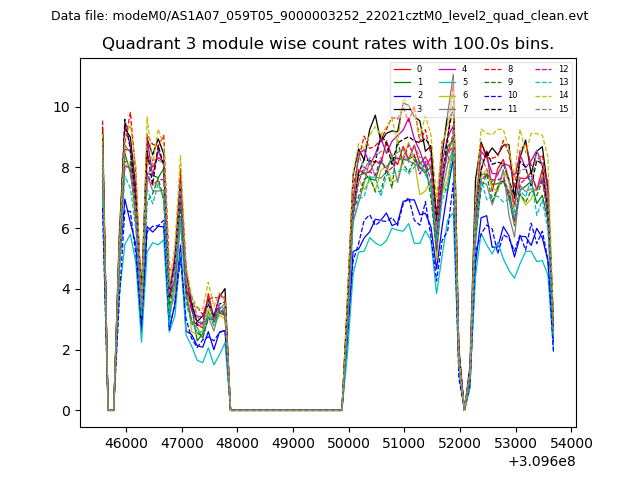
| Module-wise count rates for Quadrant D Data is divided into 100 sec bins |
 |
 |
| Parameter | Plot |
|---|---|
| CZT HV Monitor | 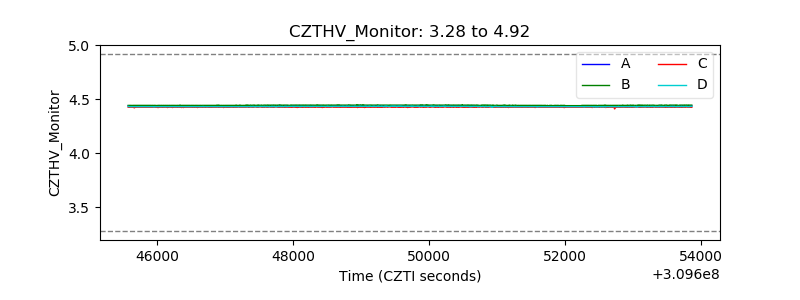 |
| D_VDD | 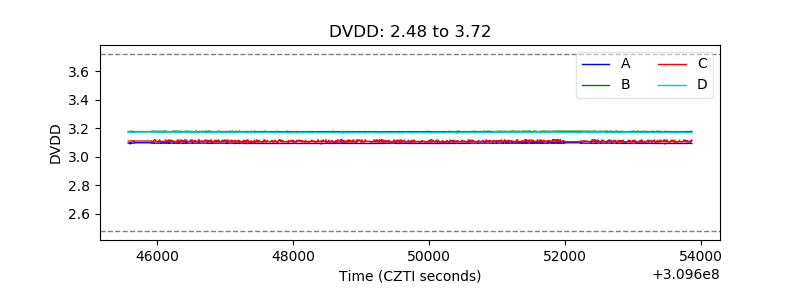 |
| Temperature 1 | 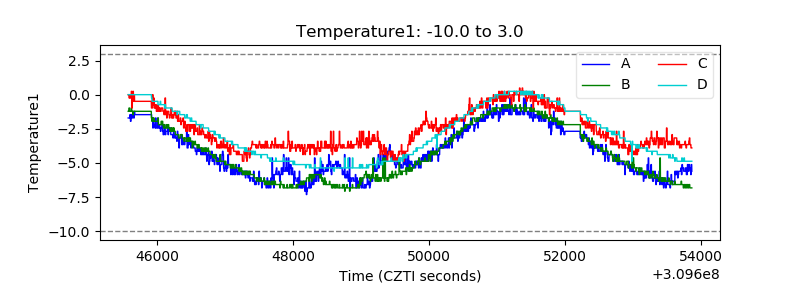 |
| Veto HV Monitor | 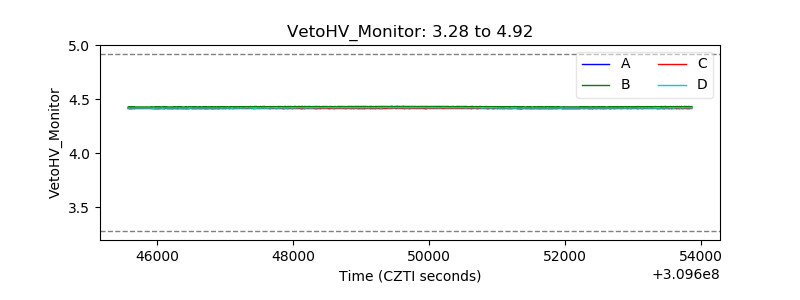 |
| Veto LLD | 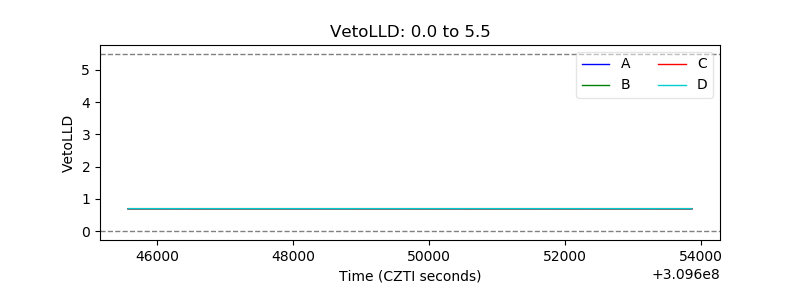 |
| Alpha Counter | 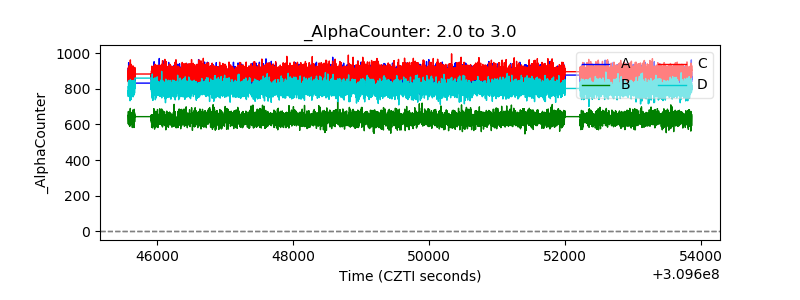 |
| _CPM_Rate | 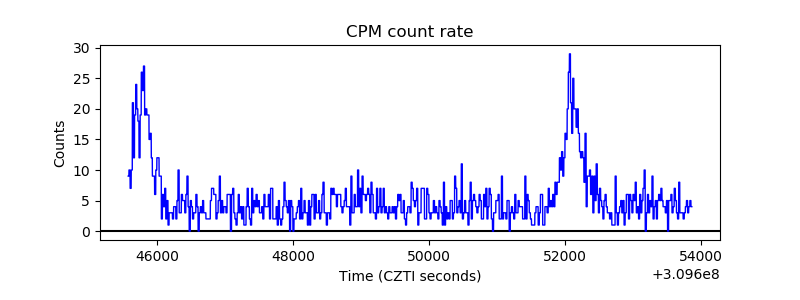 |
| CZT Counter | 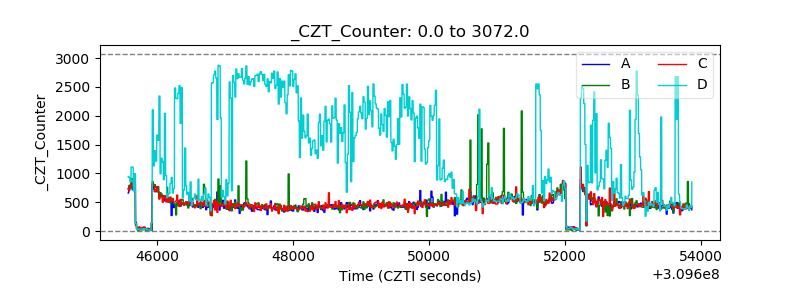 |
| +2.5 Volts monitor |  |
| +5 Volts monitor |  |
| _ROLL_ROT | 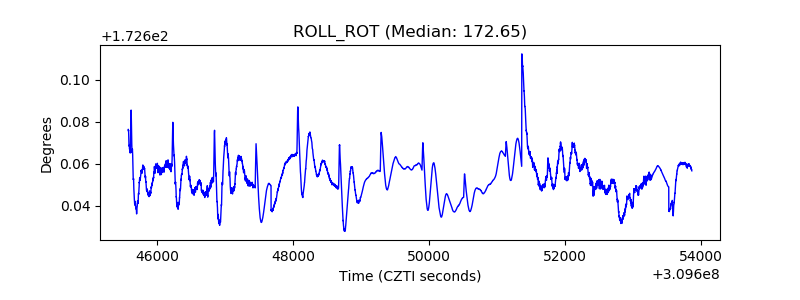 |
| _Roll_DEC | 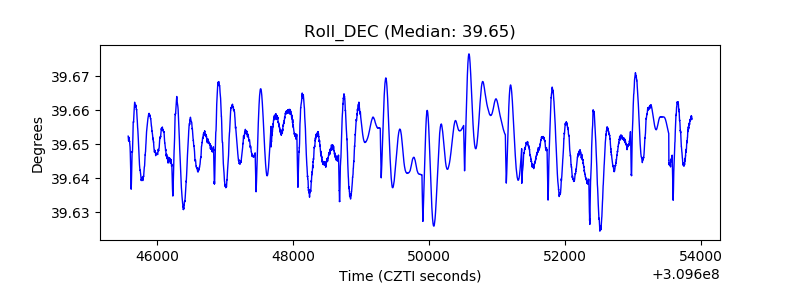 |
| _Roll_RA | 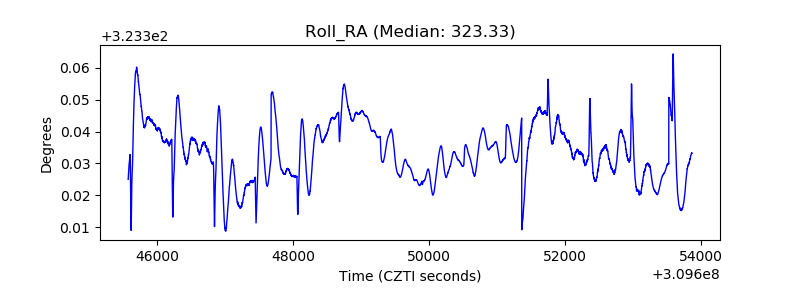 |
| Veto Counter | 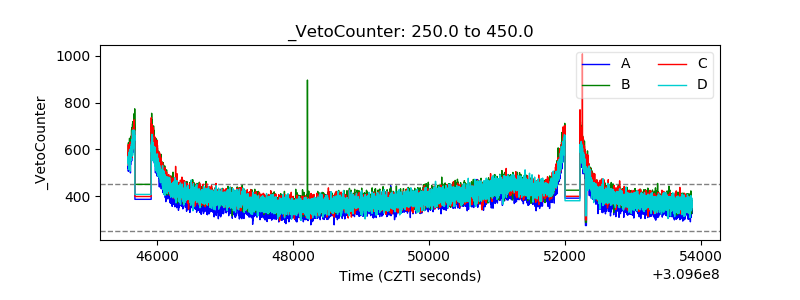 |