| Param | Original file | Final file |
|---|---|---|
| Filename | modeM0/AS1A07_059T05_9000003252_22024cztM0_level2.evt | modeM0/AS1A07_059T05_9000003252_22024cztM0_level2_quad_clean.evt |
| Size (bytes) | 1,279,716,480 | 219,404,160 |
| Size | 1.2 GB | 209.2 MB |
| Events in quadrant A | 8,064,972 | 1,403,633 |
| Events in quadrant B | 8,519,353 | 1,421,396 |
| Events in quadrant C | 8,435,288 | 1,355,711 |
| Events in quadrant D | 12,573,335 | 1,277,147 |
| Mode SS | |||
|---|---|---|---|
| Quadrant | BADHDUFLAG | Total packets | Discarded packets |
| A | 0 | 350 | 0 |
| B | 0 | 350 | 0 |
| C | 0 | 350 | 0 |
| D | 0 | 350 | 0 |
| Mode M0 | |||
|---|---|---|---|
| Quadrant | BADHDUFLAG | Total packets | Discarded packets |
| A | 0 | 35216 | 4 |
| B | 0 | 36214 | 4 |
| C | 0 | 36028 | 4 |
| D | 0 | 49404 | 4 |
| Mode M9 | |||
|---|---|---|---|
| Quadrant | BADHDUFLAG | Total packets | Discarded packets |
| A | 0 | 14 | 0 |
| B | 0 | 14 | 0 |
| C | 0 | 14 | 0 |
| D | 0 | 14 | 0 |
| Quadrant | Total seconds | Saturated seconds | Saturation percentage |
|---|---|---|---|
| A | 17217 | 96 | 0.557588% |
| B | 17218 | 170 | 0.987339% |
| C | 17218 | 254 | 1.475200% |
| D | 17218 | 1084 | 6.295737% |
Noise dominated data is calculated using 1-second bins in cleaned event files. If a bin has >2000 counts, and if more than 50% of those come from <1% of pixels, then it is considered to be noise-dominated and hence unusable.
| Quadrant | # 1 sec bins | Bins with >0 counts | Bins with >2000 counts | High rate bins dominated by noise | Noise dominated (total time) | Noise dominated (detector-on time) | Marked lightcurve |
|---|---|---|---|---|---|---|---|
| A | 18537 | 17221 | 0 | 0 | 0.00% | 0.00% | 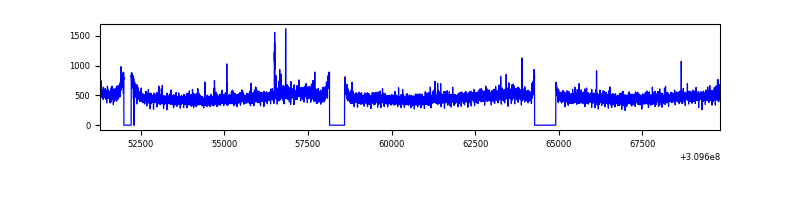 |
| B | 18538 | 17220 | 25 | 25 | 0.13% | 0.15% | 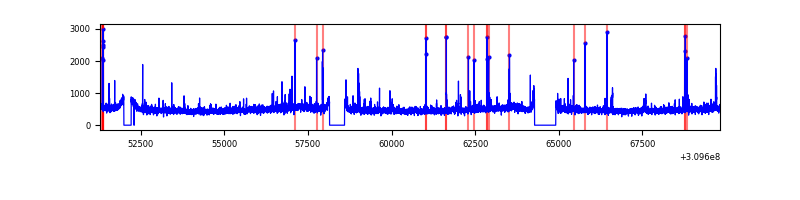 |
| C | 18538 | 17221 | 71 | 71 | 0.38% | 0.41% | 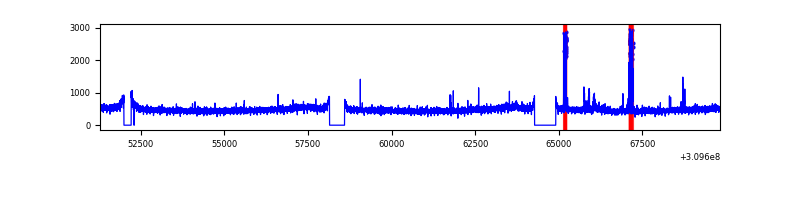 |
| D | 18538 | 17221 | 938 | 938 | 5.06% | 5.45% | 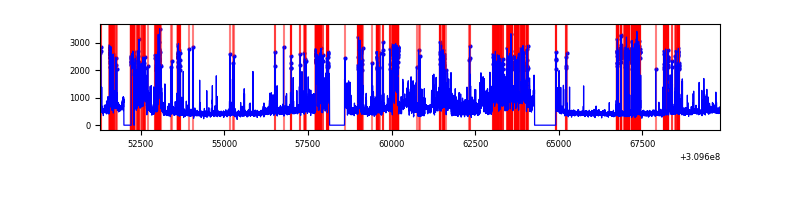 |
Top three noisy pixels from each quadrant. If the there are fewer than three noisy pixels in the level2.evt file, extra rows are filled as -1
| Pixel properties | Quadrant properties | ||||||
|---|---|---|---|---|---|---|---|
| Quadrant | DetID | PixID | Counts | Sigma | Mean | Median | Sigma |
| A | 15 | 236 | 59401 | 137.5 | 2075 | 2025 | 417.3 |
| A | 13 | 254 | 31004 | 69.45 | 2075 | 2025 | 417.3 |
| A | 0 | 226 | 17844 | 37.91 | 2075 | 2025 | 417.3 |
| B | 3 | 64 | 145475 | 364.04 | 2070 | 2017 | 394.1 |
| B | 0 | 190 | 104389 | 259.78 | 2070 | 2017 | 394.1 |
| B | 0 | 230 | 90351 | 224.16 | 2070 | 2017 | 394.1 |
| C | 10 | 22 | 316454 | 675.3 | 1990 | 2003 | 465.6 |
| C | 14 | 238 | 311057 | 663.71 | 1990 | 2003 | 465.6 |
| C | 10 | 91 | 20046 | 38.75 | 1990 | 2003 | 465.6 |
| D | 1 | 52 | 3006153 | 6282.29 | 1963 | 1905 | 478.2 |
| D | 7 | 38 | 995905 | 2078.59 | 1963 | 1905 | 478.2 |
| D | 5 | 222 | 355249 | 738.89 | 1963 | 1905 | 478.2 |
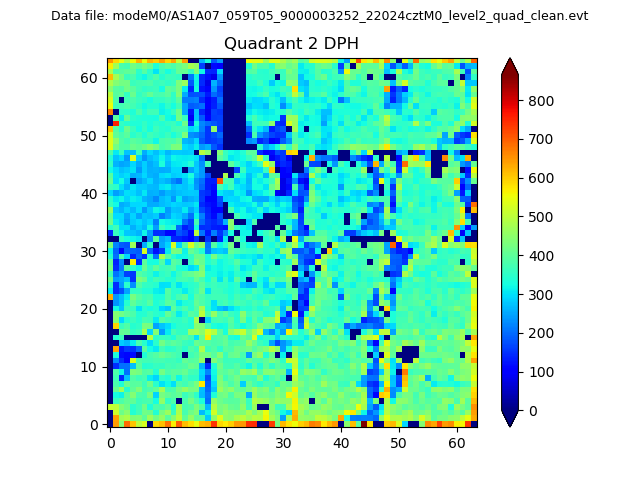
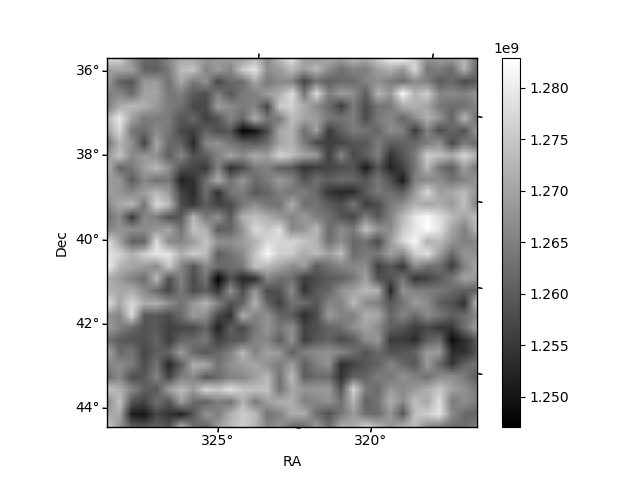
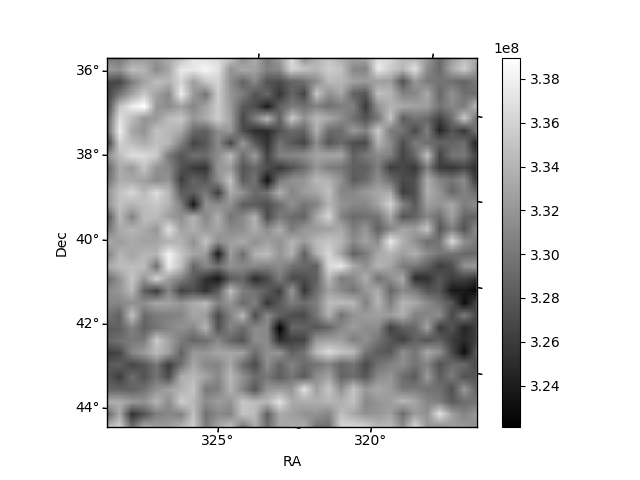
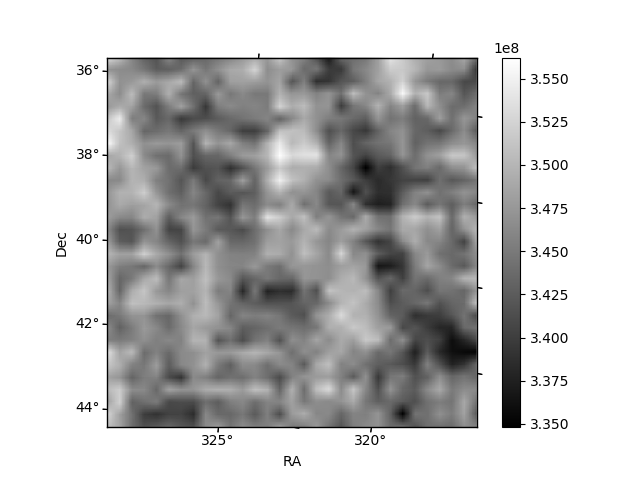
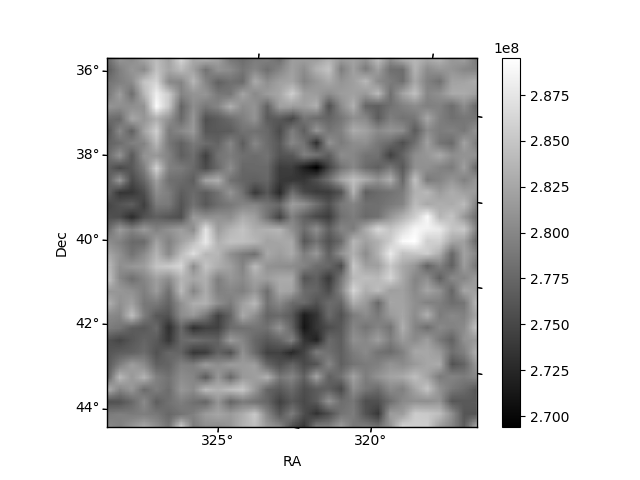
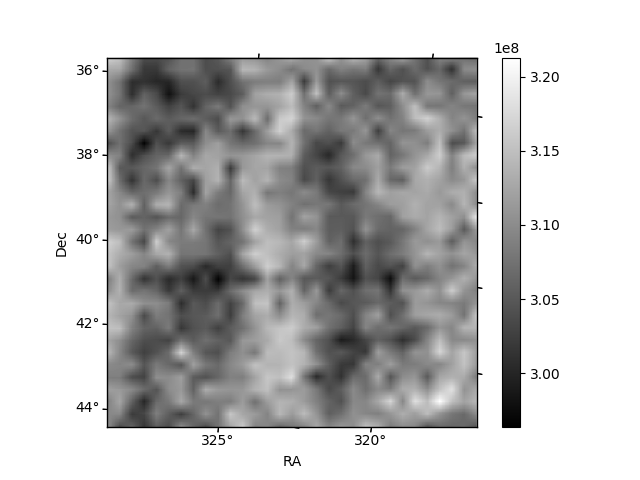
Histogram calculated using DETX and DETY for each event in the final _common_clean file
| Quadrant A | 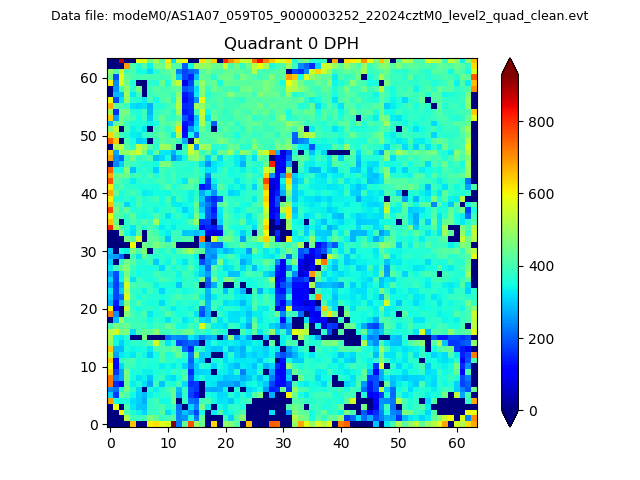 |
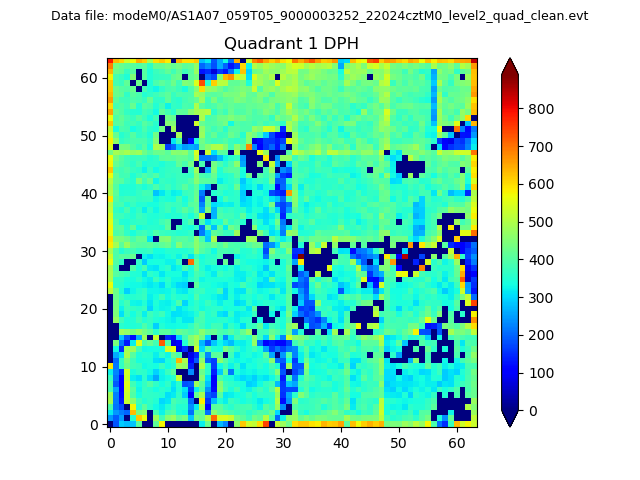 |
Quadrant B |
|---|---|---|---|
| Quadrant D | 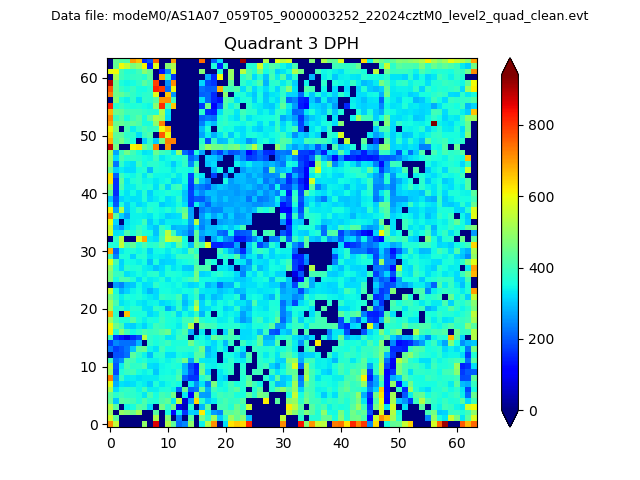 |
 |
Quadrant C |
| Plot type | Count rate plots | Images |
|---|---|---|
| Comparison with Poisson distribution Blue bars denote a histogram of data divided into 1 sec bins. Red curve is a Poisson curve with rate = median count rate of data. |
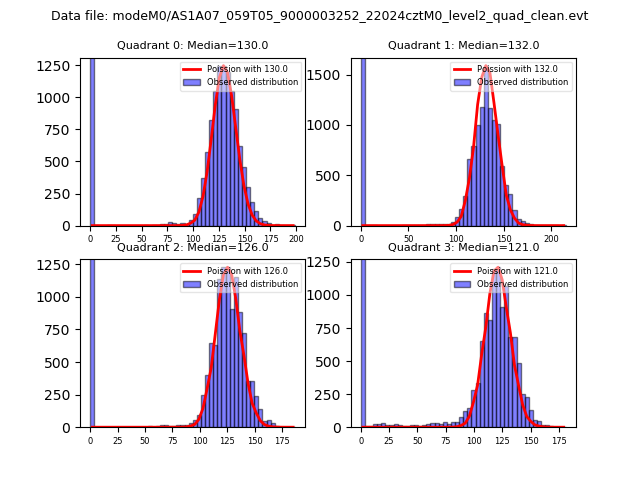 |
 |
| Quadrant-wise count rates Data is divided into 100 sec bins |
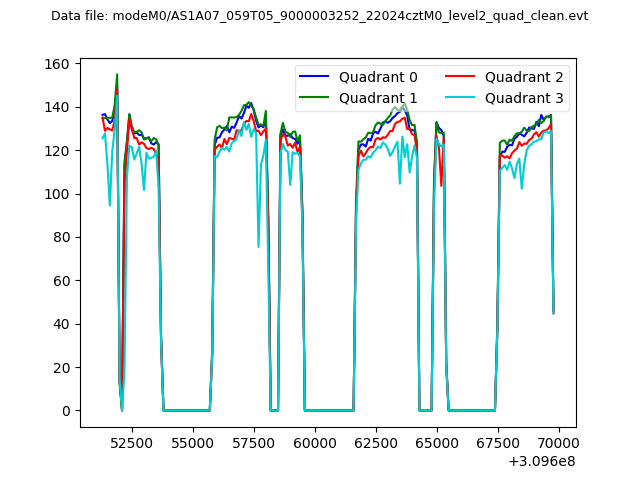 |
|
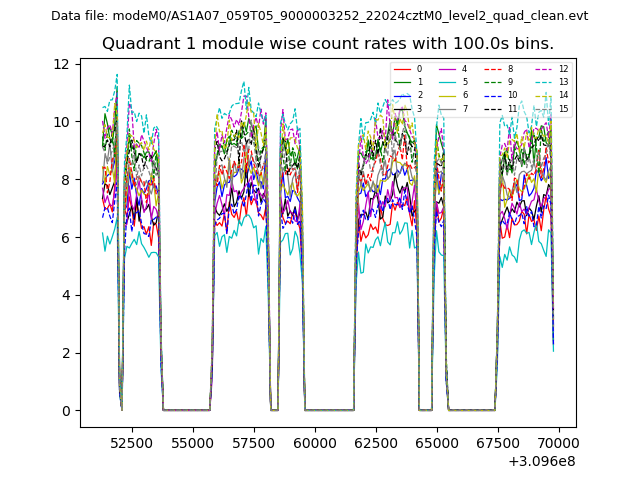
| Module-wise count rates for Quadrant A Data is divided into 100 sec bins |
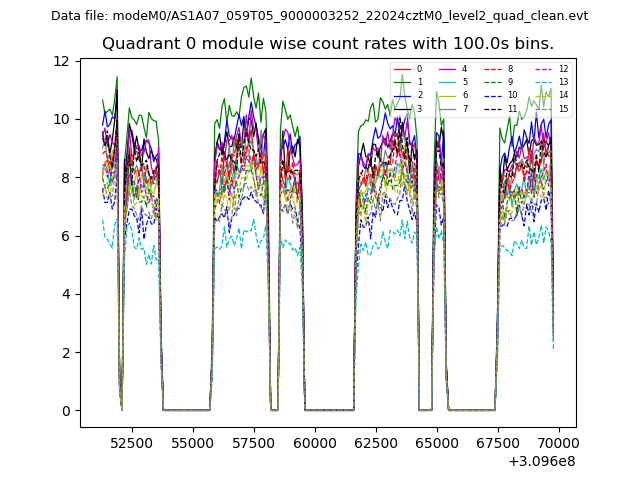 |
 |
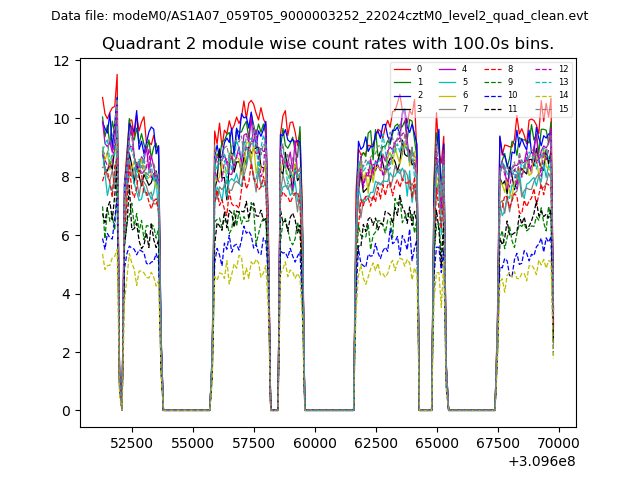
| Module-wise count rates for Quadrant B Data is divided into 100 sec bins |
 |
 |
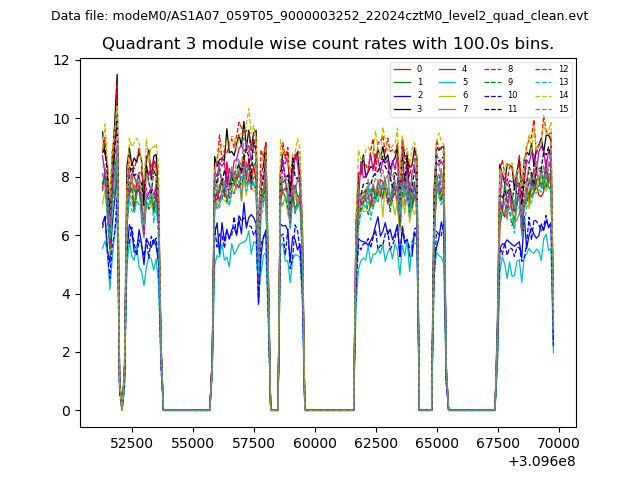
| Module-wise count rates for Quadrant C Data is divided into 100 sec bins |
 |
 |
| Module-wise count rates for Quadrant D Data is divided into 100 sec bins |
 |
 |
| Parameter | Plot |
|---|---|
| CZT HV Monitor | 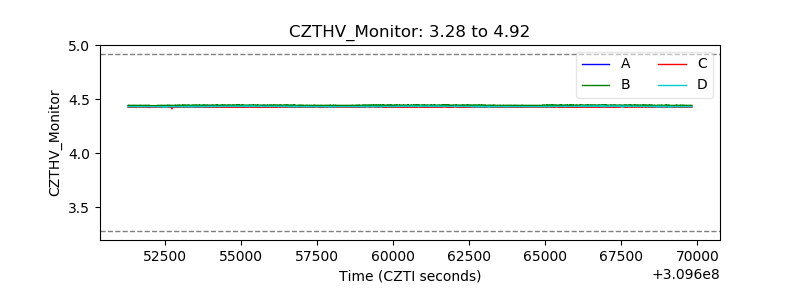 |
| D_VDD | 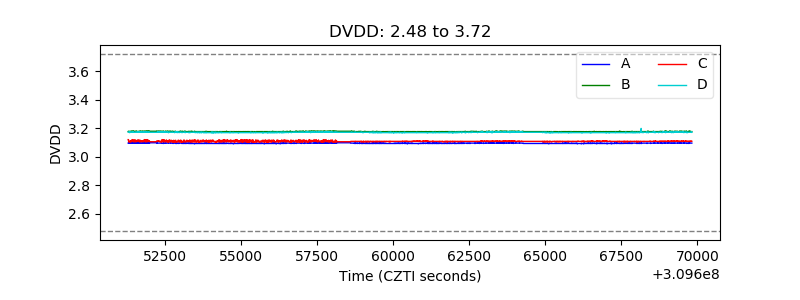 |
| Temperature 1 | 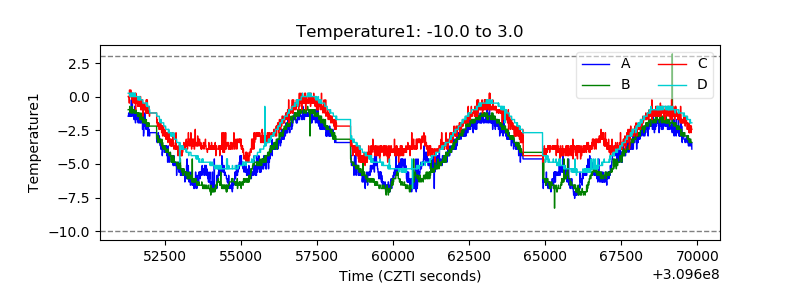 |
| Veto HV Monitor | 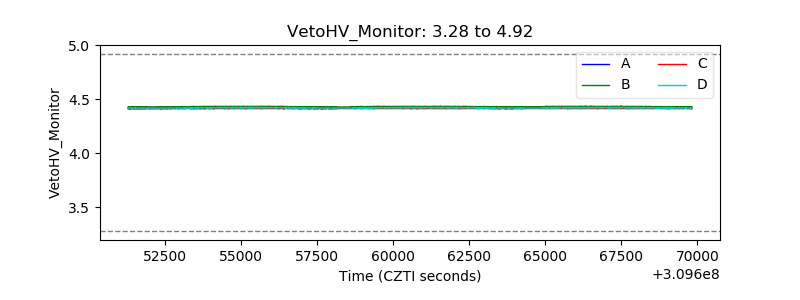 |
| Veto LLD | 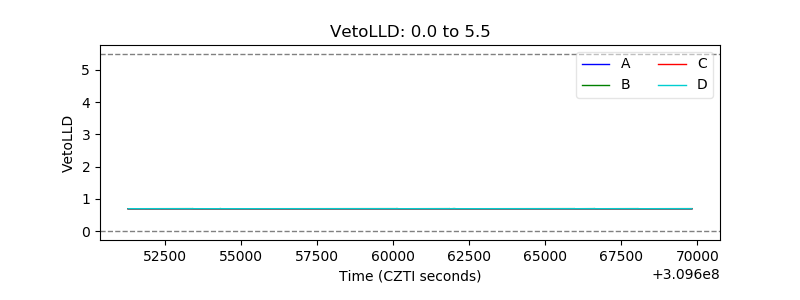 |
| Alpha Counter | 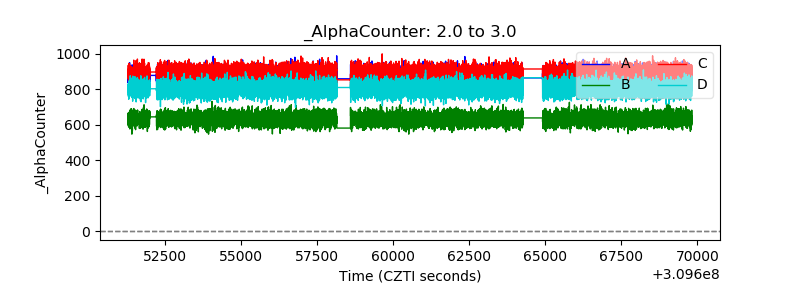 |
| _CPM_Rate | 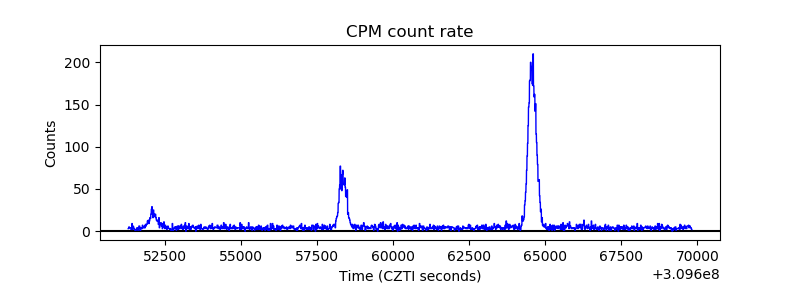 |
| CZT Counter |  |
| +2.5 Volts monitor | 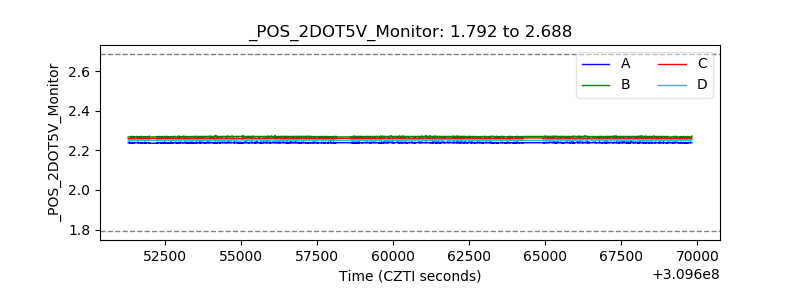 |
| +5 Volts monitor |  |
| _ROLL_ROT | 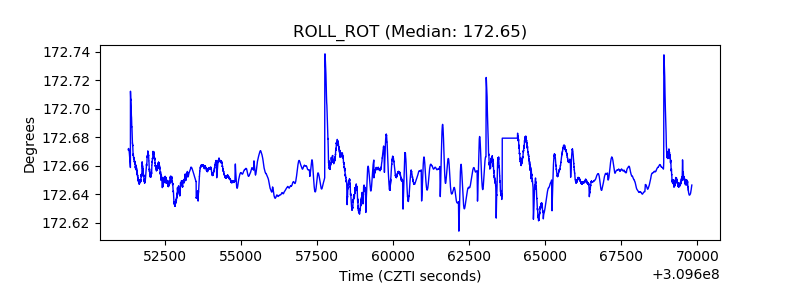 |
| _Roll_DEC | 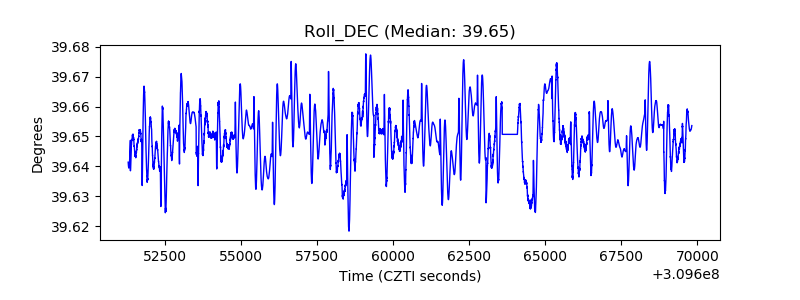 |
| _Roll_RA | 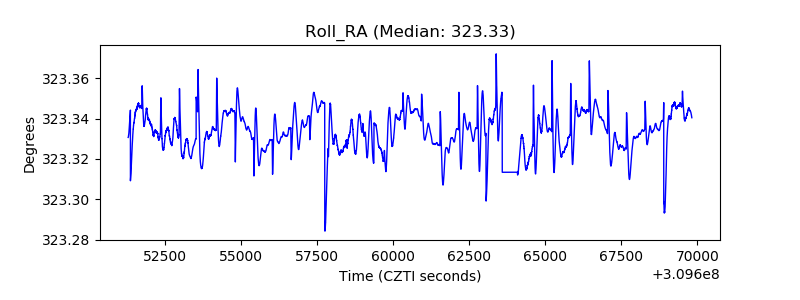 |
| Veto Counter | 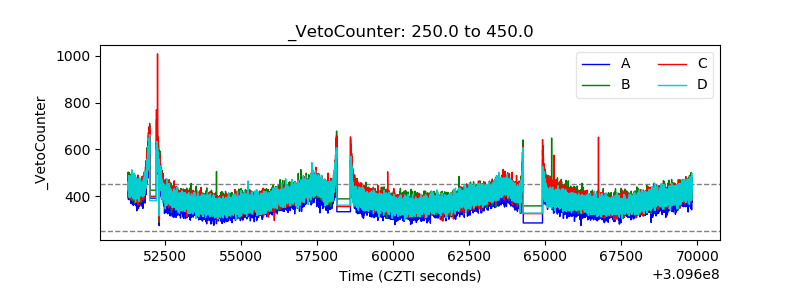 |