| Param | Original file | Final file |
|---|---|---|
| Filename | modeM0/AS1A07_059T05_9000003252_22199cztM0_level2.evt | modeM0/AS1A07_059T05_9000003252_22199cztM0_level2_quad_clean.evt |
| Size (bytes) | 46,823,040 | 14,587,200 |
| Size | 44.7 MB | 13.9 MB |
| Events in quadrant A | 324,158 | 95,083 |
| Events in quadrant B | 348,258 | 99,855 |
| Events in quadrant C | 347,199 | 96,221 |
| Events in quadrant D | 346,375 | 92,583 |
| Mode SS | |||
|---|---|---|---|
| Quadrant | BADHDUFLAG | Total packets | Discarded packets |
| A | 0 | 24 | 10 |
| B | 0 | 23 | 9 |
| C | 0 | 24 | 12 |
| D | 0 | 24 | 12 |
| Mode M0 | |||
|---|---|---|---|
| Quadrant | BADHDUFLAG | Total packets | Discarded packets |
| A | 0 | 2405 | 992 |
| B | 0 | 2488 | 1016 |
| C | 0 | 2444 | 972 |
| D | 0 | 2520 | 1004 |
| Quadrant | Total seconds | Saturated seconds | Saturation percentage |
|---|---|---|---|
| A | 704 | 0 | 0.000000% |
| B | 723 | 0 | 0.000000% |
| C | 733 | 1 | 0.136426% |
| D | 720 | 0 | 0.000000% |
Noise dominated data is calculated using 1-second bins in cleaned event files. If a bin has >2000 counts, and if more than 50% of those come from <1% of pixels, then it is considered to be noise-dominated and hence unusable.
| Quadrant | # 1 sec bins | Bins with >0 counts | Bins with >2000 counts | High rate bins dominated by noise | Noise dominated (total time) | Noise dominated (detector-on time) | Marked lightcurve |
|---|---|---|---|---|---|---|---|
| A | 1098 | 850 | 0 | 0 | 0.00% | 0.00% | 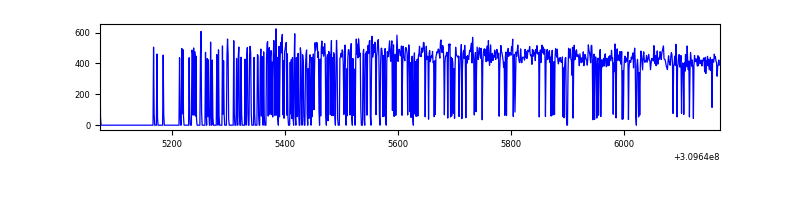 |
| B | 1031 | 859 | 0 | 0 | 0.00% | 0.00% |  |
| C | 1098 | 864 | 0 | 0 | 0.00% | 0.00% | 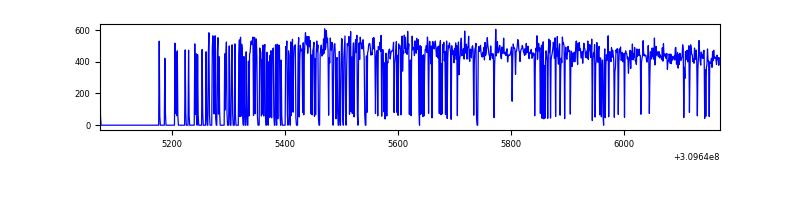 |
| D | 1005 | 866 | 0 | 0 | 0.00% | 0.00% | 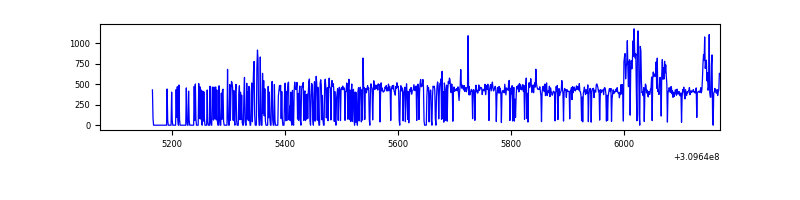 |
Top three noisy pixels from each quadrant. If the there are fewer than three noisy pixels in the level2.evt file, extra rows are filled as -1
| Pixel properties | Quadrant properties | ||||||
|---|---|---|---|---|---|---|---|
| Quadrant | DetID | PixID | Counts | Sigma | Mean | Median | Sigma |
| A | 13 | 254 | 1188 | 58.68 | 84 | 82 | 18.8 |
| A | 3 | 137 | 714 | 33.53 | 84 | 82 | 18.8 |
| A | 0 | 226 | 684 | 31.94 | 84 | 82 | 18.8 |
| B | 3 | 64 | 3458 | 176.7 | 87 | 85 | 19.1 |
| B | 12 | 111 | 2083 | 104.67 | 87 | 85 | 19.1 |
| B | 11 | 111 | 1808 | 90.26 | 87 | 85 | 19.1 |
| C | 14 | 238 | 13062 | 586.88 | 85 | 86 | 22.1 |
| C | 13 | 61 | 526 | 19.9 | 85 | 86 | 22.1 |
| C | 10 | 91 | 477 | 17.68 | 85 | 86 | 22.1 |
| D | 1 | 52 | 30994 | 1428.16 | 81 | 79 | 21.6 |
| D | 7 | 223 | 6329 | 288.73 | 81 | 79 | 21.6 |
| D | 2 | 234 | 2818 | 126.53 | 81 | 79 | 21.6 |
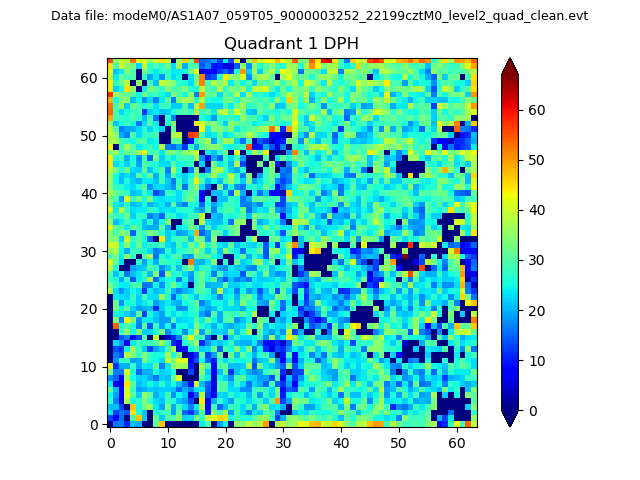
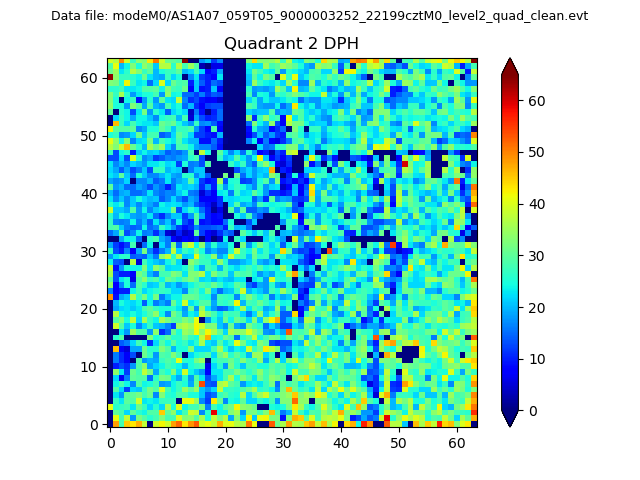
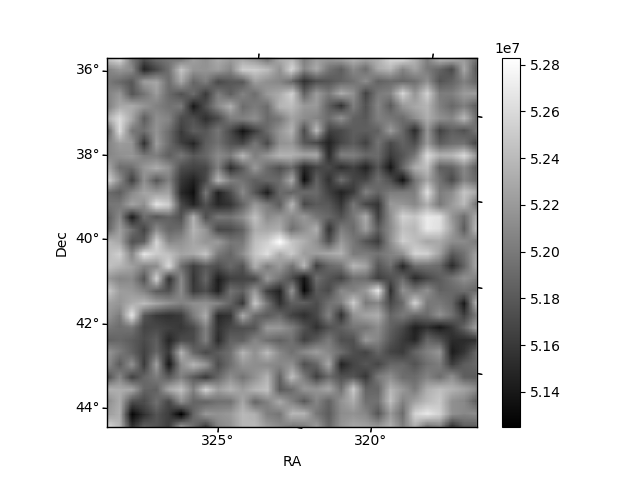
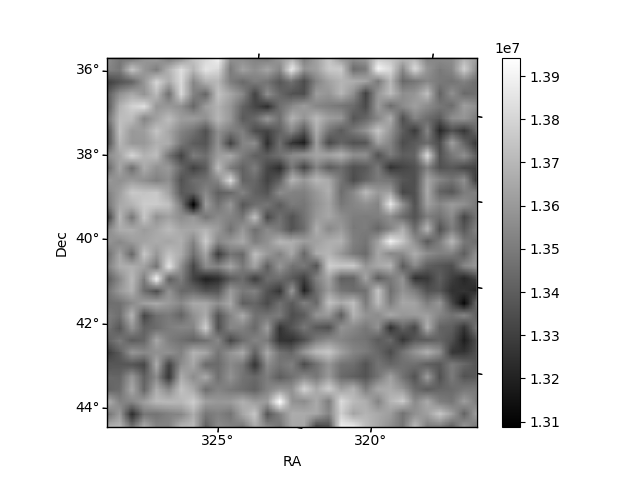
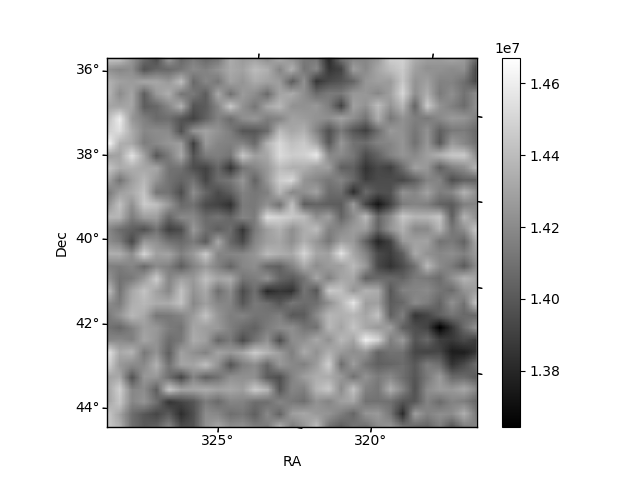
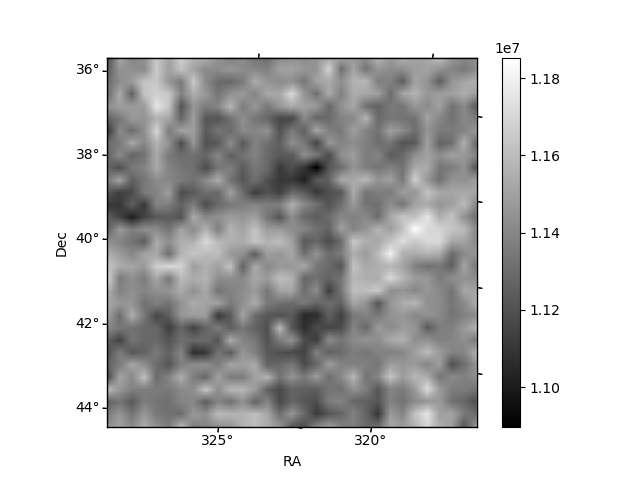
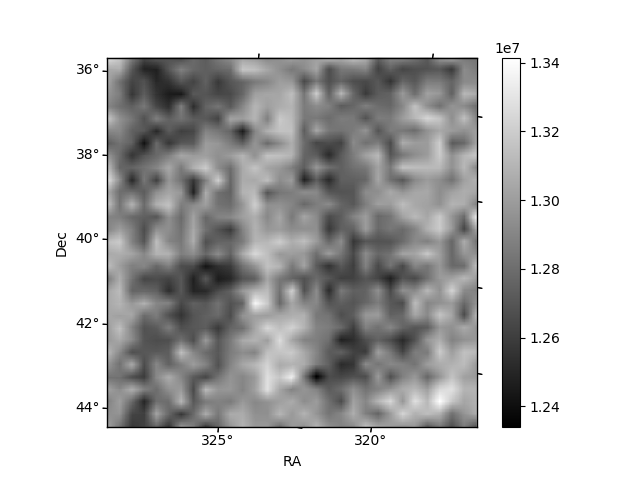
Histogram calculated using DETX and DETY for each event in the final _common_clean file
| Quadrant A | 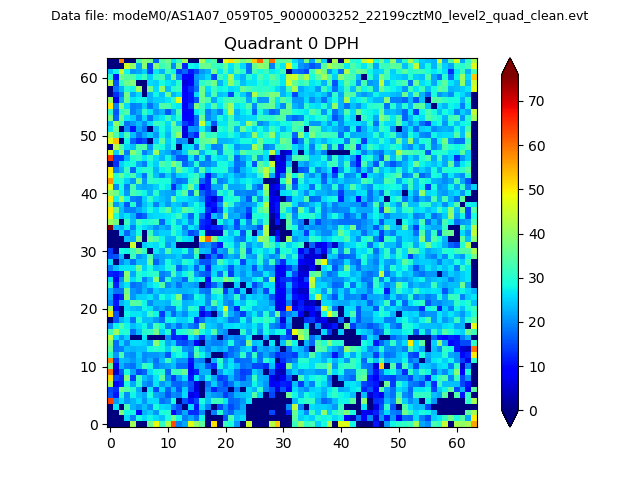 |
 |
Quadrant B |
|---|---|---|---|
| Quadrant D | 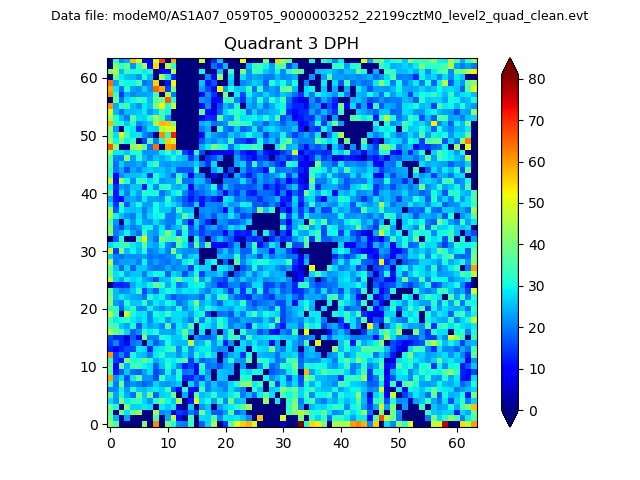 |
 |
Quadrant C |
| Plot type | Count rate plots | Images |
|---|---|---|
| Comparison with Poisson distribution Blue bars denote a histogram of data divided into 1 sec bins. Red curve is a Poisson curve with rate = median count rate of data. |
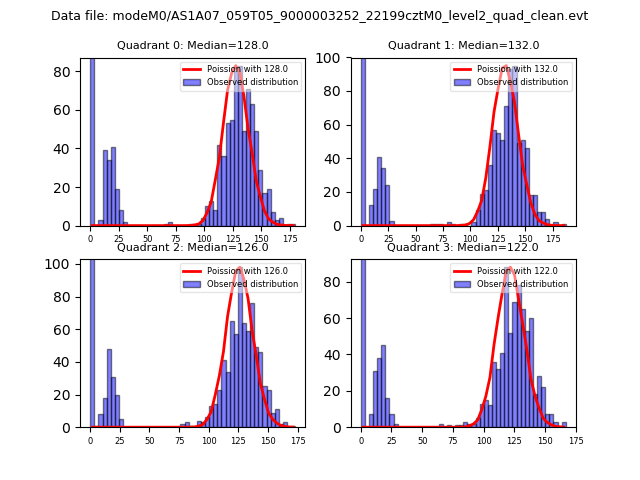 |
 |
| Quadrant-wise count rates Data is divided into 100 sec bins |
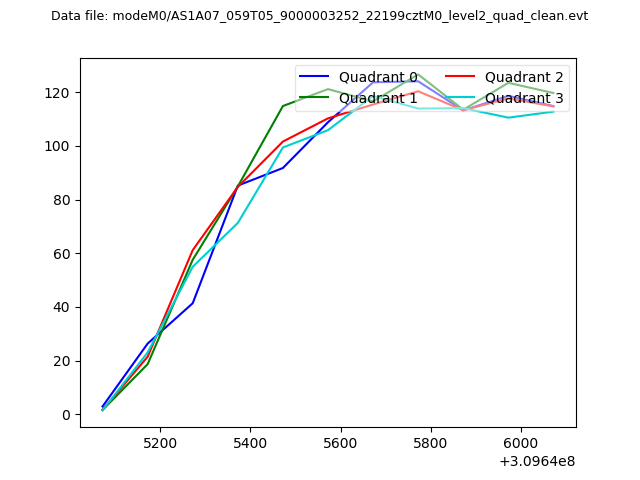 |
|
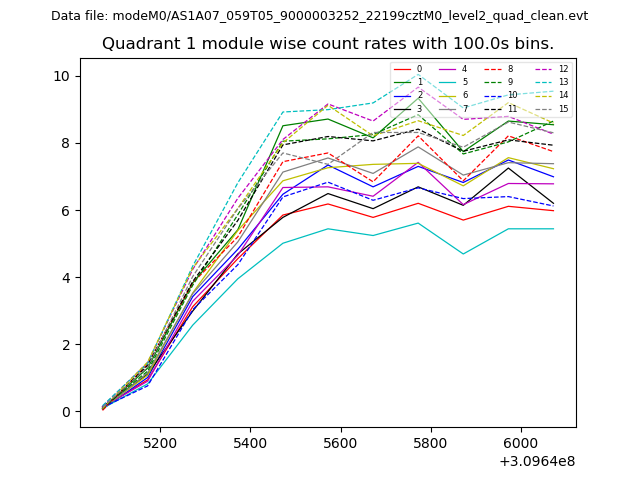
| Module-wise count rates for Quadrant A Data is divided into 100 sec bins |
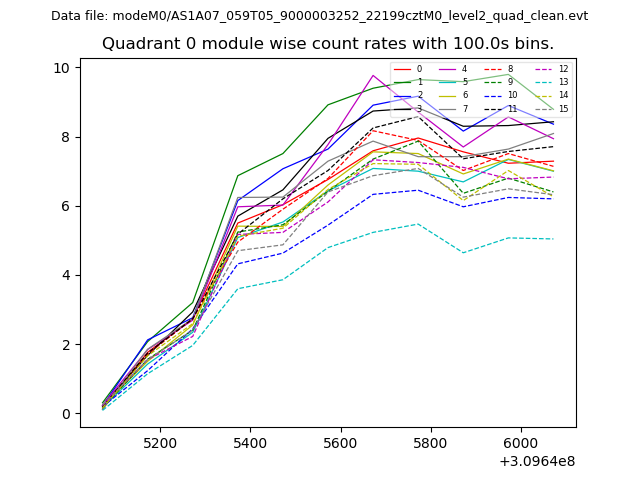 |
 |
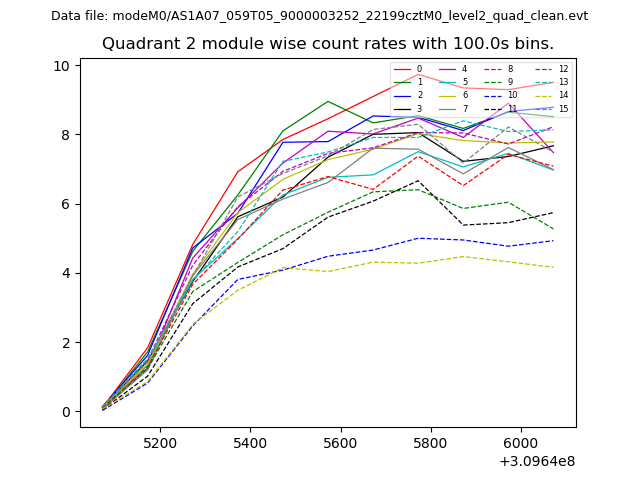
| Module-wise count rates for Quadrant B Data is divided into 100 sec bins |
 |
 |
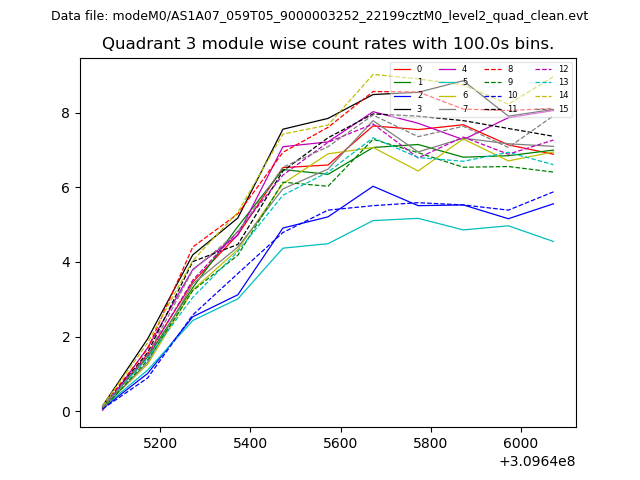
| Module-wise count rates for Quadrant C Data is divided into 100 sec bins |
 |
 |
| Module-wise count rates for Quadrant D Data is divided into 100 sec bins |
 |
 |
| Parameter | Plot |
|---|---|
| CZT HV Monitor | 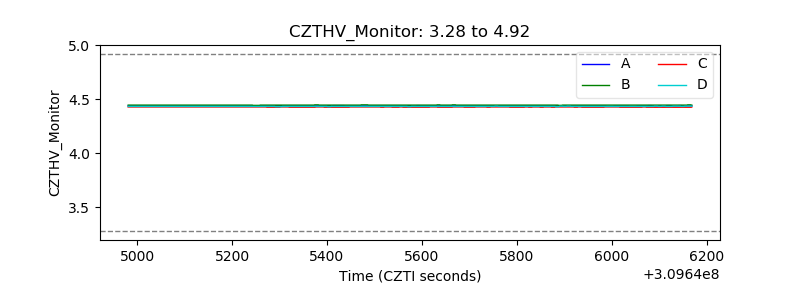 |
| D_VDD |  |
| Temperature 1 | 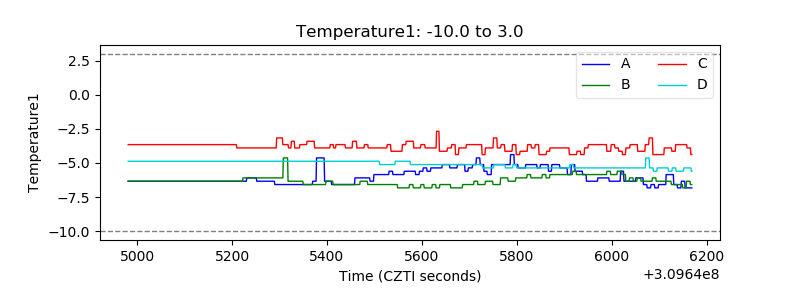 |
| Veto HV Monitor | 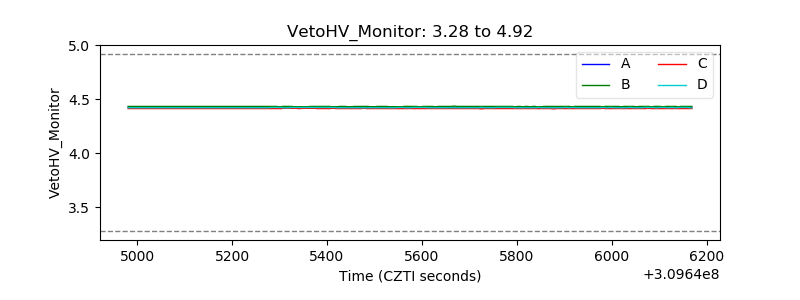 |
| Veto LLD | 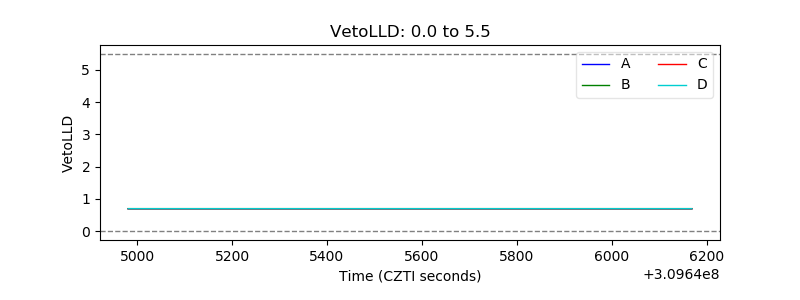 |
| Alpha Counter | 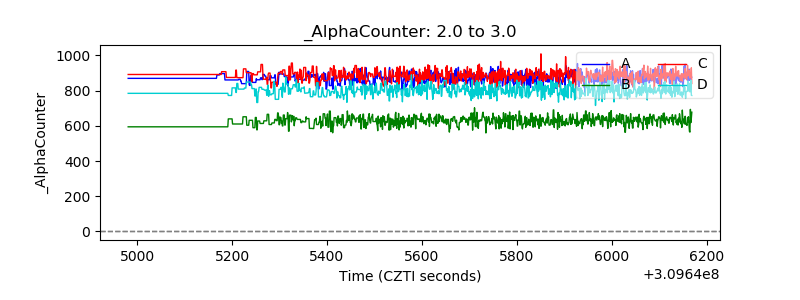 |
| _CPM_Rate | 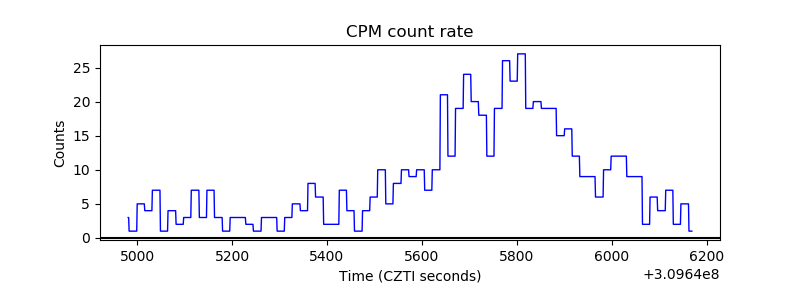 |
| CZT Counter | 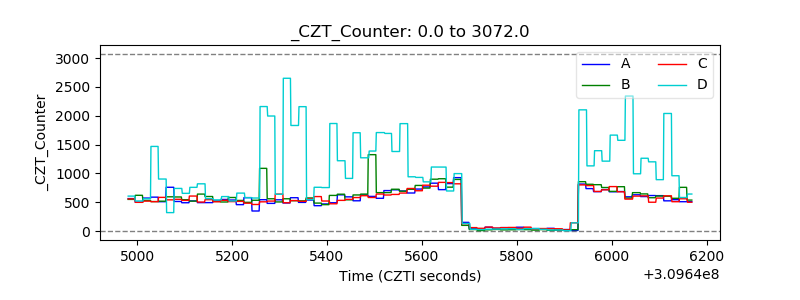 |
| +2.5 Volts monitor |  |
| +5 Volts monitor |  |
| _ROLL_ROT | 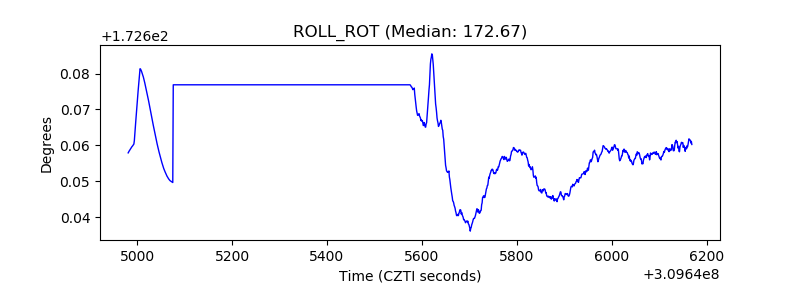 |
| _Roll_DEC | 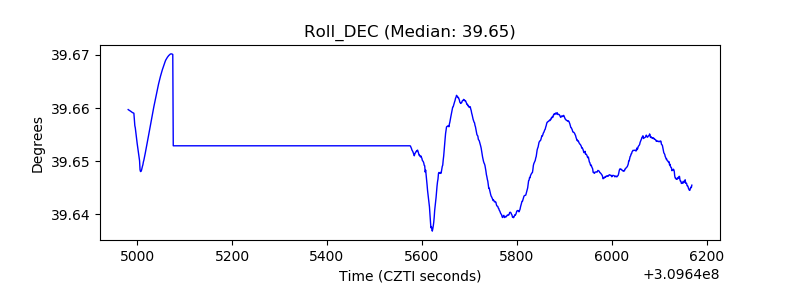 |
| _Roll_RA | 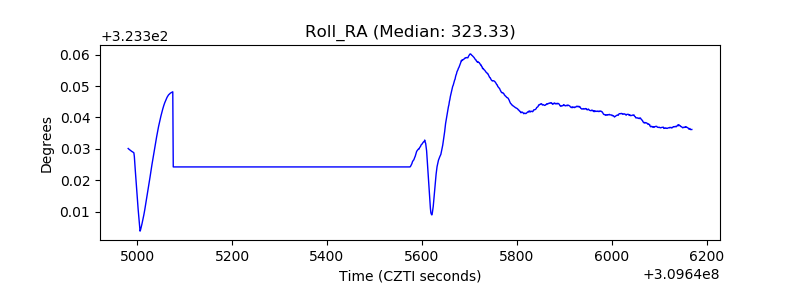 |
| Veto Counter | 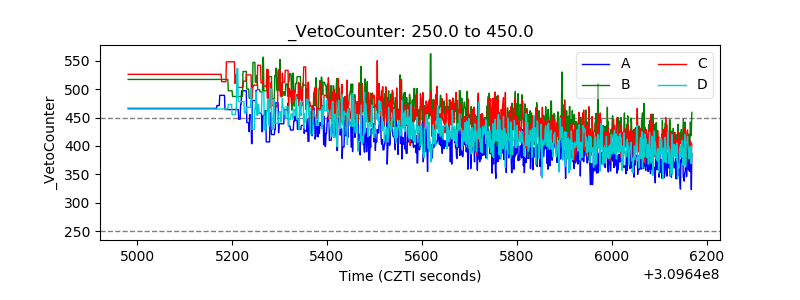 |