| Param | Original file | Final file |
|---|---|---|
| Filename | modeM0/AS1A07_091T07_9000003254cztM0_level2.fits | modeM0/AS1A07_091T07_9000003254cztM0_level2_quad_clean.evt |
| Size (bytes) | 307,555,200 | 216,434,880 |
| Size | 293.3 MB | 206.4 MB |
| Events in quadrant A | 1,971,406 | 1,197,991 |
| Events in quadrant B | 1,846,374 | 1,184,325 |
| Events in quadrant C | 1,894,628 | 1,141,730 |
| Events in quadrant D | 1,582,236 | 1,009,944 |
| Mode SS | |||
|---|---|---|---|
| Quadrant | BADHDUFLAG | Total packets | Discarded packets |
| A | 0 | 596 | 0 |
| B | 0 | 596 | 0 |
| C | 0 | 596 | 0 |
| D | 0 | 596 | 0 |
| Mode M9 | |||
|---|---|---|---|
| Quadrant | BADHDUFLAG | Total packets | Discarded packets |
| A | 0 | 67 | 0 |
| B | 0 | 68 | 0 |
| C | 0 | 68 | 0 |
| D | 0 | 68 | 0 |
| Mode M0 | |||
|---|---|---|---|
| Quadrant | BADHDUFLAG | Total packets | Discarded packets |
| A | 0 | 61990 | 0 |
| B | 0 | 63489 | 0 |
| C | 0 | 61711 | 0 |
| D | 0 | 90240 | 0 |
| Quadrant | Total seconds | Saturated seconds | Saturation percentage |
|---|---|---|---|
| A | 29377 | 301 | 1.024611% |
| B | 29377 | 386 | 1.313953% |
| C | 29377 | 411 | 1.399054% |
| D | 29376 | 3196 | 10.879630% |
Noise dominated data is calculated using 1-second bins in cleaned event files. If a bin has >2000 counts, and if more than 50% of those come from <1% of pixels, then it is considered to be noise-dominated and hence unusable.
| Quadrant | # 1 sec bins | Bins with >0 counts | Bins with >2000 counts | High rate bins dominated by noise | Noise dominated (total time) | Noise dominated (detector-on time) | Marked lightcurve |
|---|---|---|---|---|---|---|---|
| A | 40355 | 29371 | 0 | 0 | 0.00% | 0.00% |  |
| B | 40355 | 29371 | 0 | 0 | 0.00% | 0.00% |  |
| C | 40355 | 29371 | 0 | 0 | 0.00% | 0.00% |  |
| D | 40355 | 29350 | 0 | 0 | 0.00% | 0.00% |  |
Top three noisy pixels from each quadrant. If the there are fewer than three noisy pixels in the level2.evt file, extra rows are filled as -1
| Pixel properties | Quadrant properties | ||||||
|---|---|---|---|---|---|---|---|
| Quadrant | DetID | PixID | Counts | Sigma | Mean | Median | Sigma |
| A | 0 | 29 | 1889 | 11.16 | 514 | 487 | 125.6 |
| A | 7 | 110 | 1559 | 8.53 | 514 | 487 | 125.6 |
| A | 9 | 19 | 1442 | 7.6 | 514 | 487 | 125.6 |
| B | 2 | 9 | 1398 | 9.65 | 489 | 470 | 96.2 |
| B | 14 | 254 | 1194 | 7.53 | 489 | 470 | 96.2 |
| B | 5 | 128 | 1192 | 7.5 | 489 | 470 | 96.2 |
| C | 3 | 126 | 1311 | 6.55 | 500 | 472 | 128.0 |
| C | 7 | 111 | 1288 | 6.37 | 500 | 472 | 128.0 |
| C | 3 | 158 | 1269 | 6.23 | 500 | 472 | 128.0 |
| D | 4 | 246 | 1191 | 6.52 | 452 | 415 | 119.1 |
| D | 10 | 189 | 1122 | 5.94 | 452 | 415 | 119.1 |
| D | 6 | 67 | 1112 | 5.85 | 452 | 415 | 119.1 |
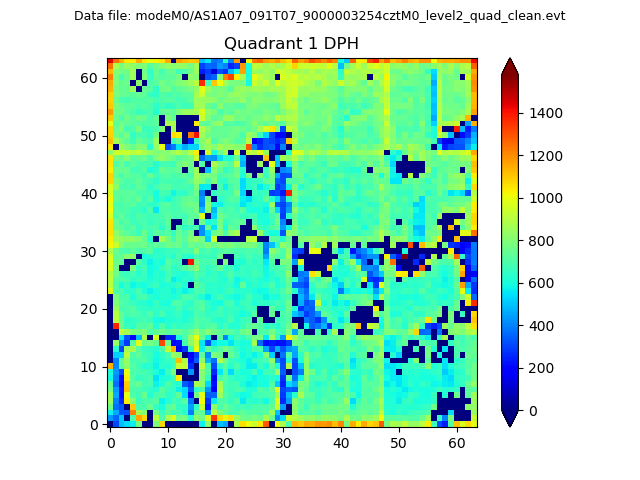
Histogram calculated using DETX and DETY for each event in the final _common_clean file
| Quadrant A |  |
 |
Quadrant B |
|---|---|---|---|
| Quadrant D |  |
 |
Quadrant C |
| Plot type | Count rate plots | Images |
|---|---|---|
| Comparison with Poisson distribution Blue bars denote a histogram of data divided into 1 sec bins. Red curve is a Poisson curve with rate = median count rate of data. |
 |
 |
| Quadrant-wise count rates Data is divided into 100 sec bins |
 |
|
| Module-wise count rates for Quadrant A Data is divided into 100 sec bins |
 |
 |
| Module-wise count rates for Quadrant B Data is divided into 100 sec bins |
 |
 |
| Module-wise count rates for Quadrant C Data is divided into 100 sec bins |
 |
 |
| Module-wise count rates for Quadrant D Data is divided into 100 sec bins |
 |
 |
| Parameter | Plot |
|---|---|
| CZT HV Monitor |  |
| D_VDD |  |
| Temperature 1 |  |
| Veto HV Monitor |  |
| Veto LLD |  |
| Alpha Counter |  |
| _CPM_Rate |  |
| CZT Counter |  |
| +2.5 Volts monitor |  |
| +5 Volts monitor |  |
| _ROLL_ROT |  |
| _Roll_DEC |  |
| _Roll_RA |  |
| Veto Counter |  |