| Param | Original file | Final file |
|---|---|---|
| Filename | modeM0/AS1A07_091T07_9000003254_22024cztM0_level2.evt | modeM0/AS1A07_091T07_9000003254_22024cztM0_level2_quad_clean.evt |
| Size (bytes) | 97,450,560 | 29,047,680 |
| Size | 92.9 MB | 27.7 MB |
| Events in quadrant A | 680,017 | 194,569 |
| Events in quadrant B | 718,070 | 197,135 |
| Events in quadrant C | 683,437 | 190,086 |
| Events in quadrant D | 763,763 | 185,279 |
| Mode SS | |||
|---|---|---|---|
| Quadrant | BADHDUFLAG | Total packets | Discarded packets |
| A | 0 | 30 | 0 |
| B | 0 | 30 | 0 |
| C | 0 | 30 | 0 |
| D | 0 | 30 | 0 |
| Mode M9 | |||
|---|---|---|---|
| Quadrant | BADHDUFLAG | Total packets | Discarded packets |
| A | 0 | 4 | 0 |
| B | 0 | 4 | 0 |
| C | 0 | 4 | 0 |
| D | 0 | 4 | 0 |
| Mode M0 | |||
|---|---|---|---|
| Quadrant | BADHDUFLAG | Total packets | Discarded packets |
| A | 0 | 3080 | 1 |
| B | 0 | 3146 | 1 |
| C | 0 | 3085 | 1 |
| D | 0 | 3374 | 2 |
| Quadrant | Total seconds | Saturated seconds | Saturation percentage |
|---|---|---|---|
| A | 1516 | 5 | 0.329815% |
| B | 1516 | 7 | 0.461741% |
| C | 1516 | 5 | 0.329815% |
| D | 1515 | 35 | 2.310231% |
Noise dominated data is calculated using 1-second bins in cleaned event files. If a bin has >2000 counts, and if more than 50% of those come from <1% of pixels, then it is considered to be noise-dominated and hence unusable.
| Quadrant | # 1 sec bins | Bins with >0 counts | Bins with >2000 counts | High rate bins dominated by noise | Noise dominated (total time) | Noise dominated (detector-on time) | Marked lightcurve |
|---|---|---|---|---|---|---|---|
| A | 1516 | 1516 | 0 | 0 | 0.00% | 0.00% | 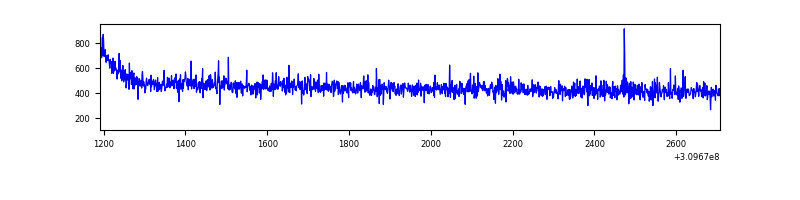 |
| B | 1516 | 1516 | 0 | 0 | 0.00% | 0.00% | 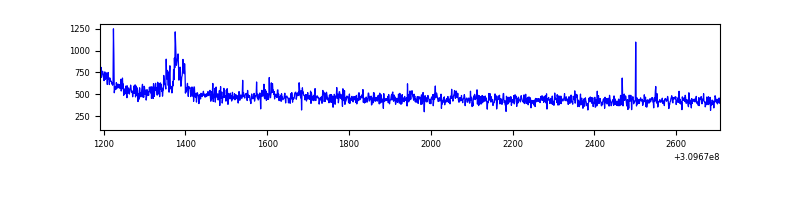 |
| C | 1516 | 1516 | 0 | 0 | 0.00% | 0.00% | 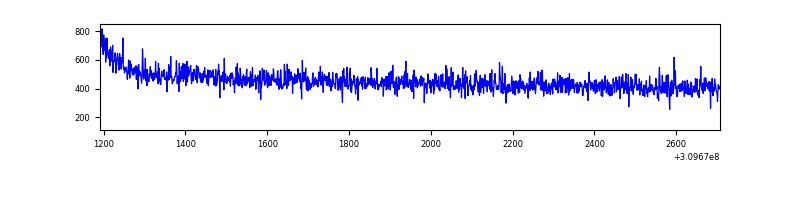 |
| D | 1515 | 1515 | 35 | 35 | 2.31% | 2.31% | 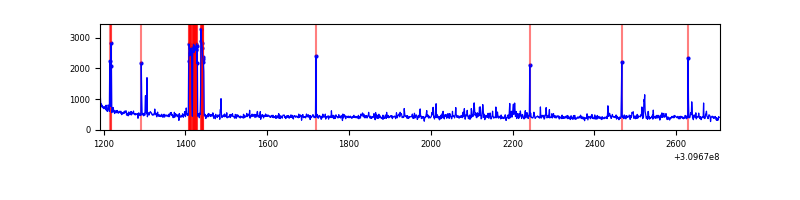 |
Top three noisy pixels from each quadrant. If the there are fewer than three noisy pixels in the level2.evt file, extra rows are filled as -1
| Pixel properties | Quadrant properties | ||||||
|---|---|---|---|---|---|---|---|
| Quadrant | DetID | PixID | Counts | Sigma | Mean | Median | Sigma |
| A | 13 | 254 | 2543 | 64.49 | 175 | 172 | 36.8 |
| A | 15 | 236 | 1692 | 41.35 | 175 | 172 | 36.8 |
| A | 0 | 226 | 1512 | 36.45 | 175 | 172 | 36.8 |
| B | 0 | 230 | 13686 | 372.02 | 177 | 172 | 36.3 |
| B | 4 | 216 | 6235 | 166.91 | 177 | 172 | 36.3 |
| B | 12 | 111 | 4195 | 110.75 | 177 | 172 | 36.3 |
| C | 14 | 238 | 26584 | 638.5 | 168 | 168 | 41.4 |
| C | 13 | 61 | 1177 | 24.39 | 168 | 168 | 41.4 |
| C | 7 | 247 | 404 | 5.7 | 168 | 168 | 41.4 |
| D | 1 | 52 | 105214 | 2498.66 | 165 | 160 | 42.0 |
| D | 2 | 136 | 14093 | 331.38 | 165 | 160 | 42.0 |
| D | 7 | 223 | 8174 | 190.6 | 165 | 160 | 42.0 |
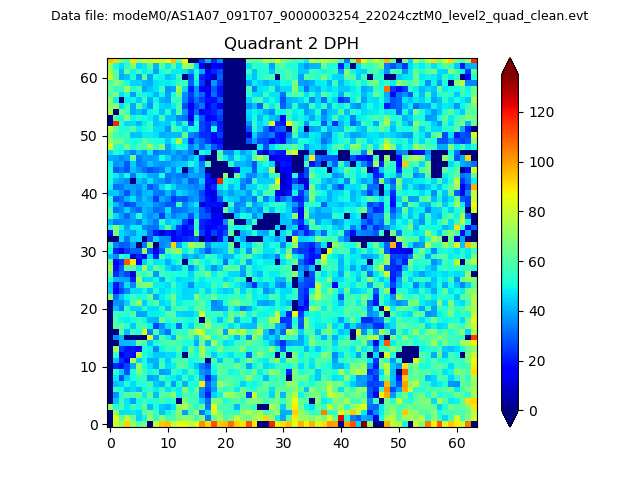
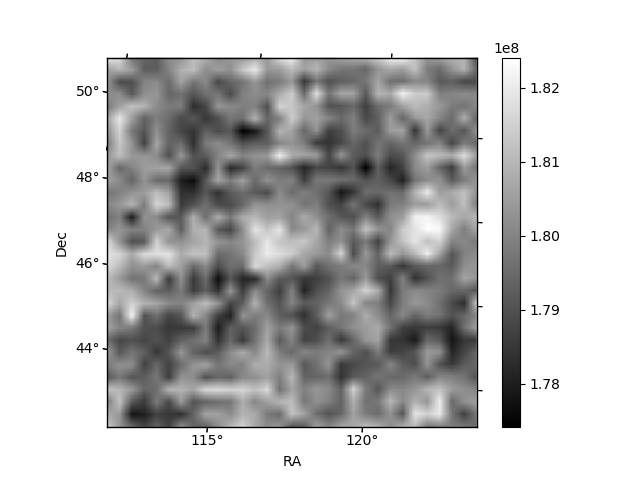
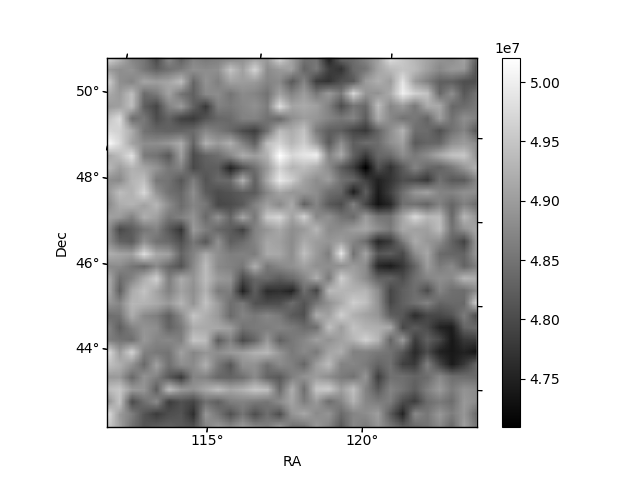
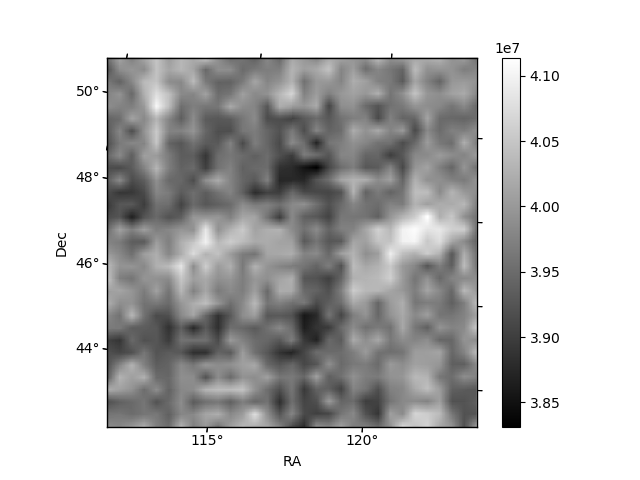
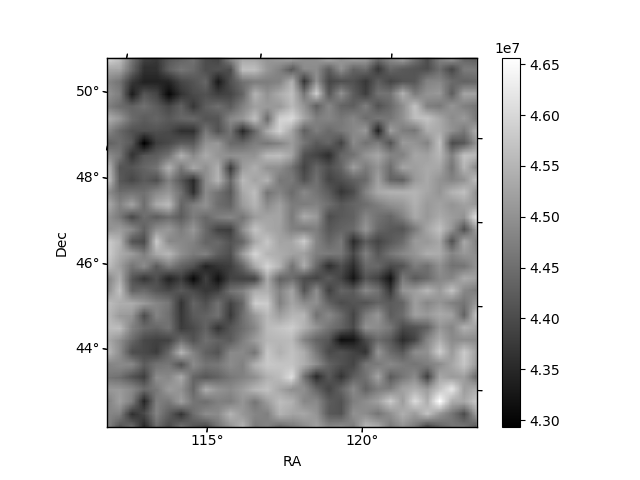
Histogram calculated using DETX and DETY for each event in the final _common_clean file
| Quadrant A | 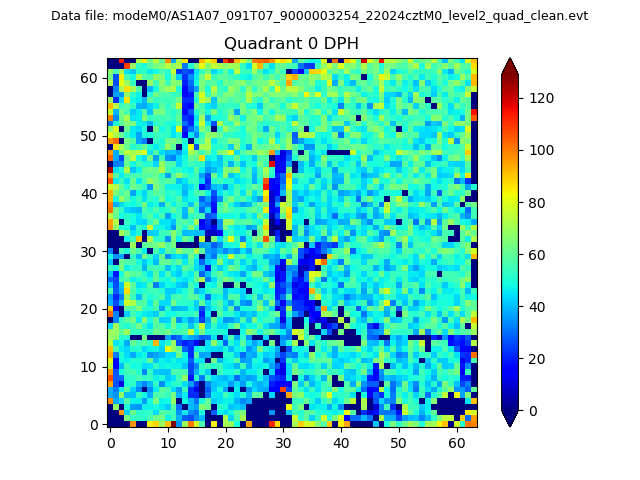 |
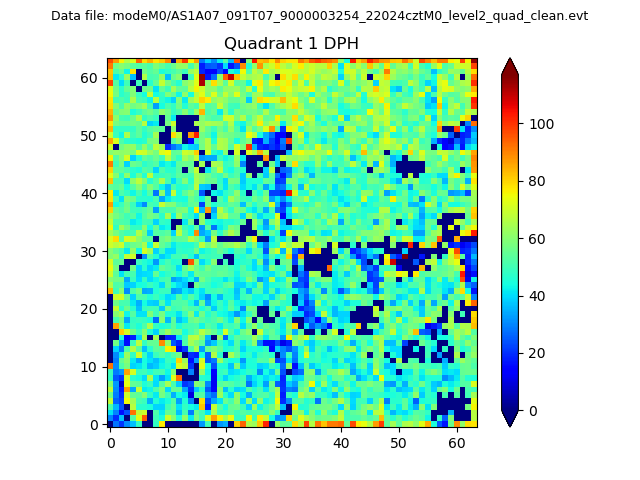 |
Quadrant B |
|---|---|---|---|
| Quadrant D | 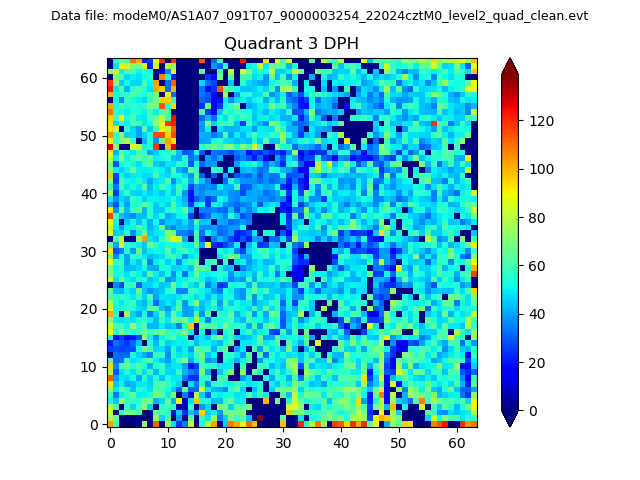 |
 |
Quadrant C |
| Plot type | Count rate plots | Images |
|---|---|---|
| Comparison with Poisson distribution Blue bars denote a histogram of data divided into 1 sec bins. Red curve is a Poisson curve with rate = median count rate of data. |
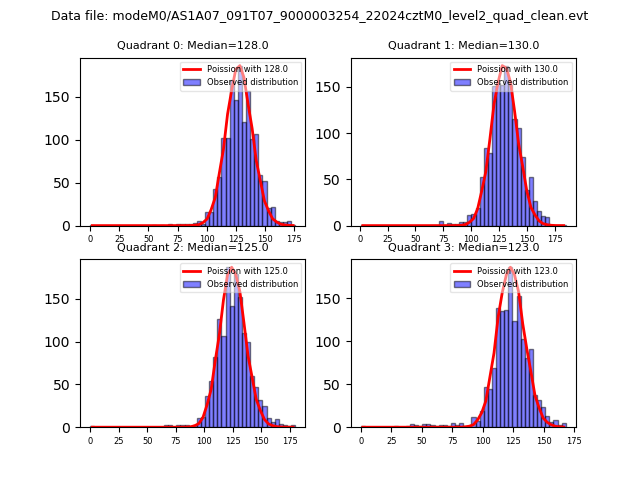 |
 |
| Quadrant-wise count rates Data is divided into 100 sec bins |
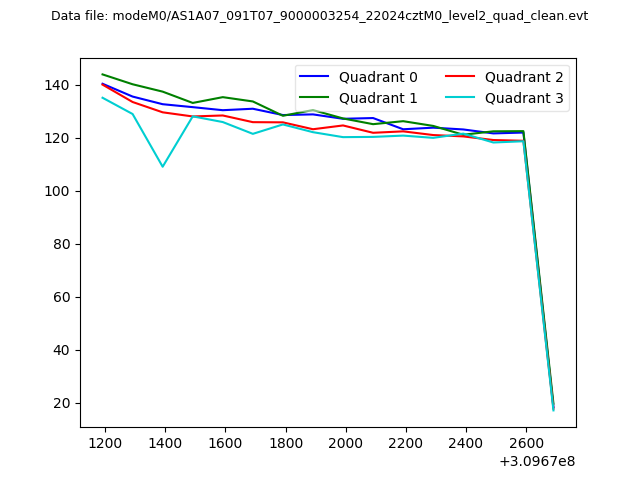 |
|
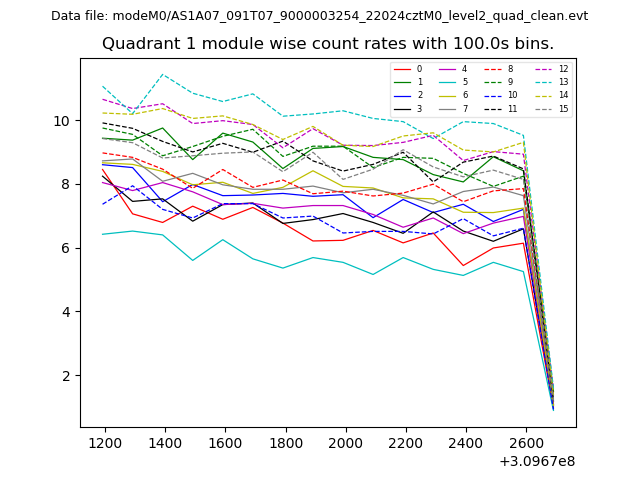
| Module-wise count rates for Quadrant A Data is divided into 100 sec bins |
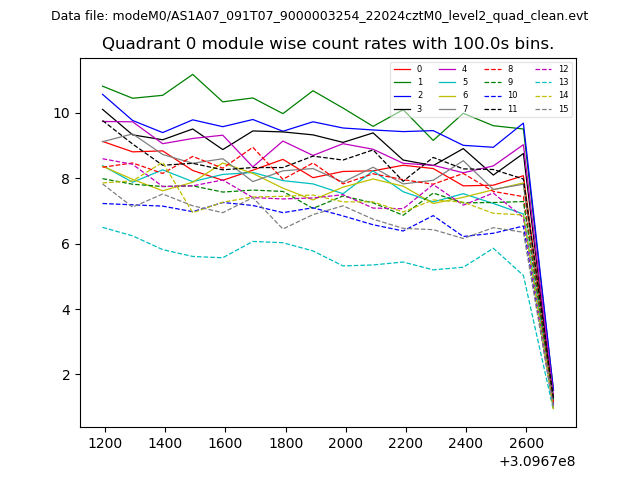 |
 |
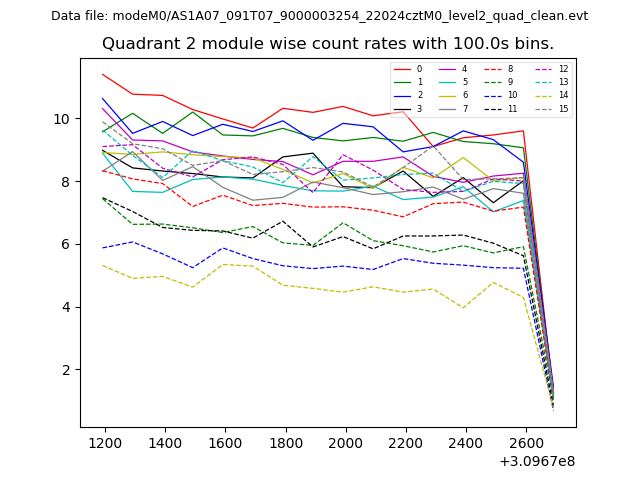
| Module-wise count rates for Quadrant B Data is divided into 100 sec bins |
 |
 |
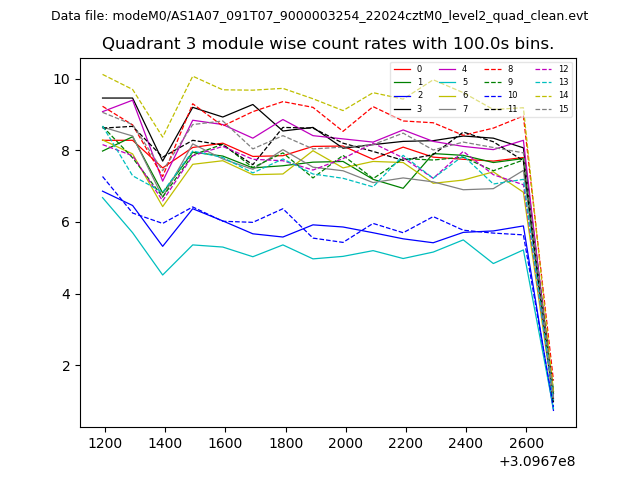
| Module-wise count rates for Quadrant C Data is divided into 100 sec bins |
 |
 |
| Module-wise count rates for Quadrant D Data is divided into 100 sec bins |
 |
 |
| Parameter | Plot |
|---|---|
| CZT HV Monitor | 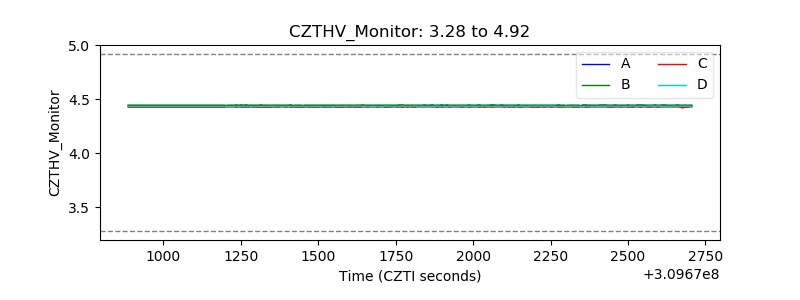 |
| D_VDD | 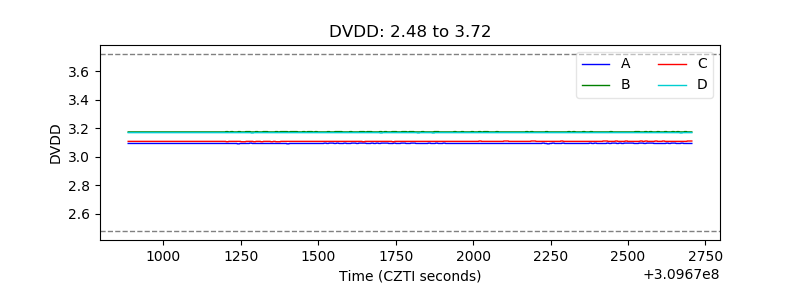 |
| Temperature 1 | 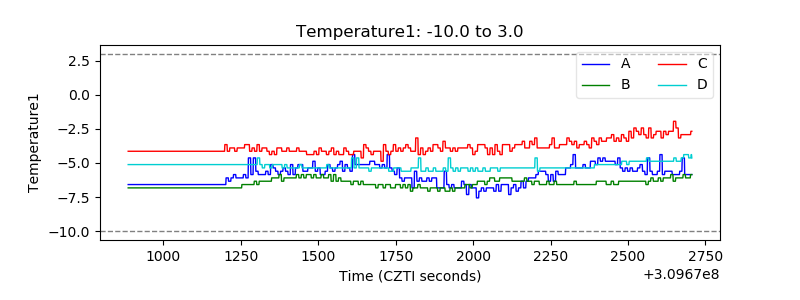 |
| Veto HV Monitor | 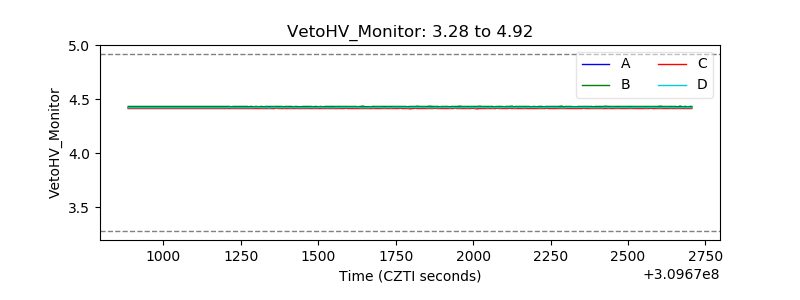 |
| Veto LLD | 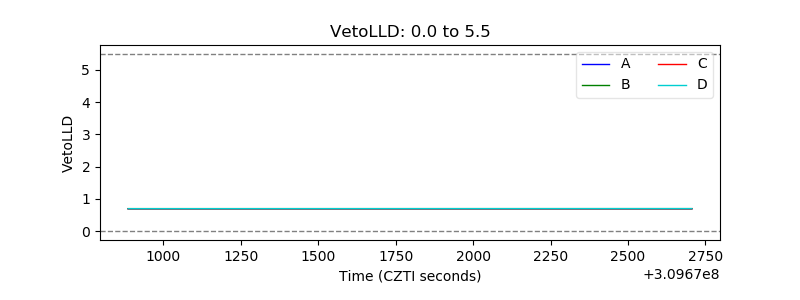 |
| Alpha Counter | 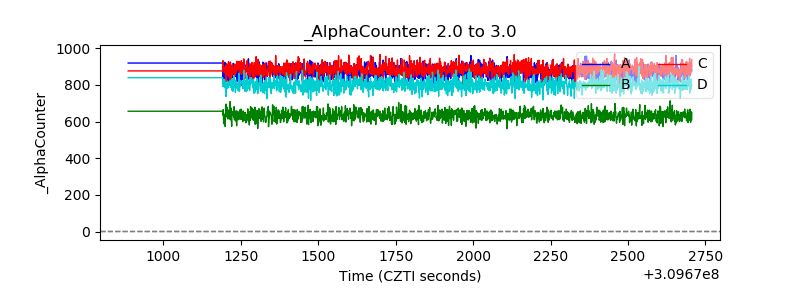 |
| _CPM_Rate | 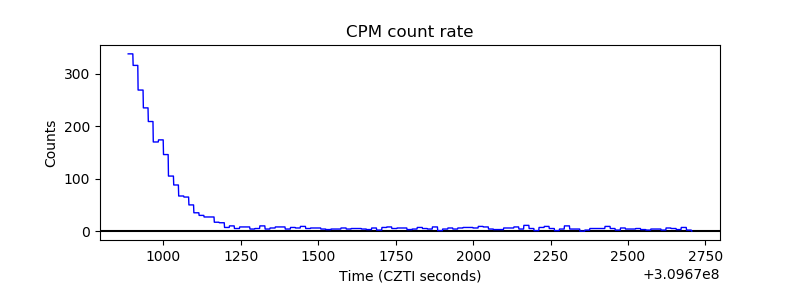 |
| CZT Counter | 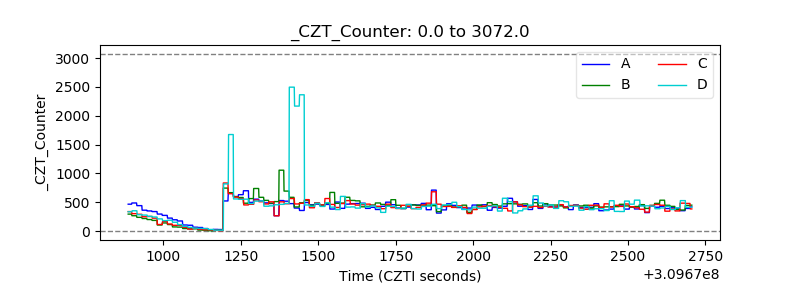 |
| +2.5 Volts monitor |  |
| +5 Volts monitor |  |
| _ROLL_ROT | 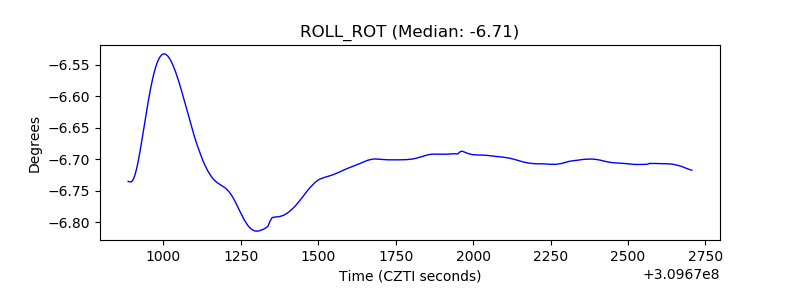 |
| _Roll_DEC | 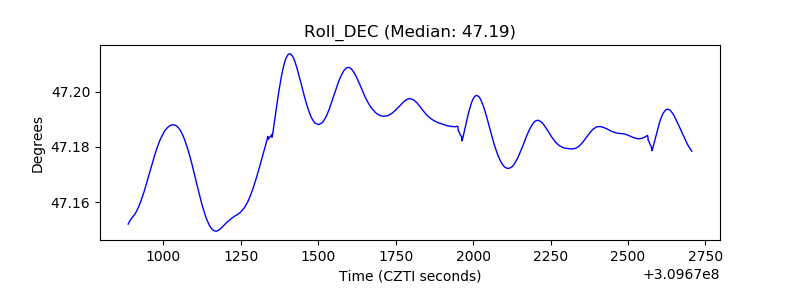 |
| _Roll_RA | 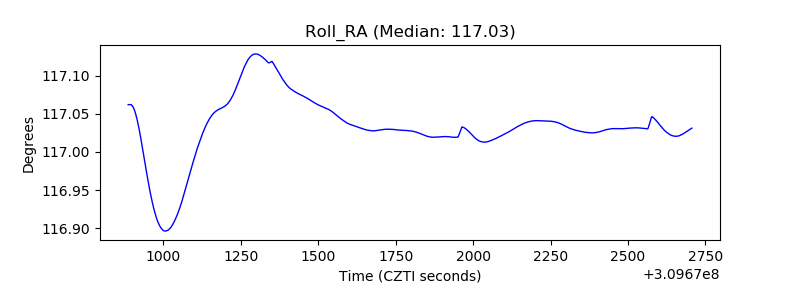 |
| Veto Counter | 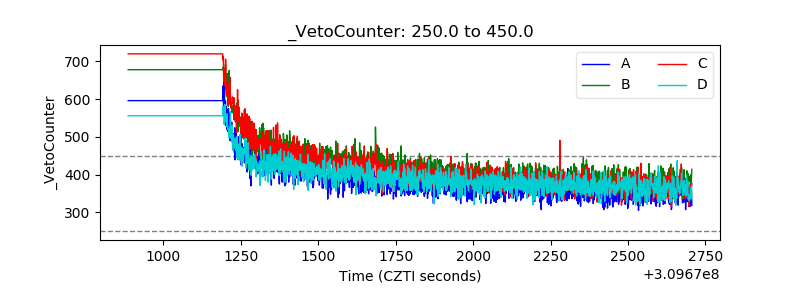 |